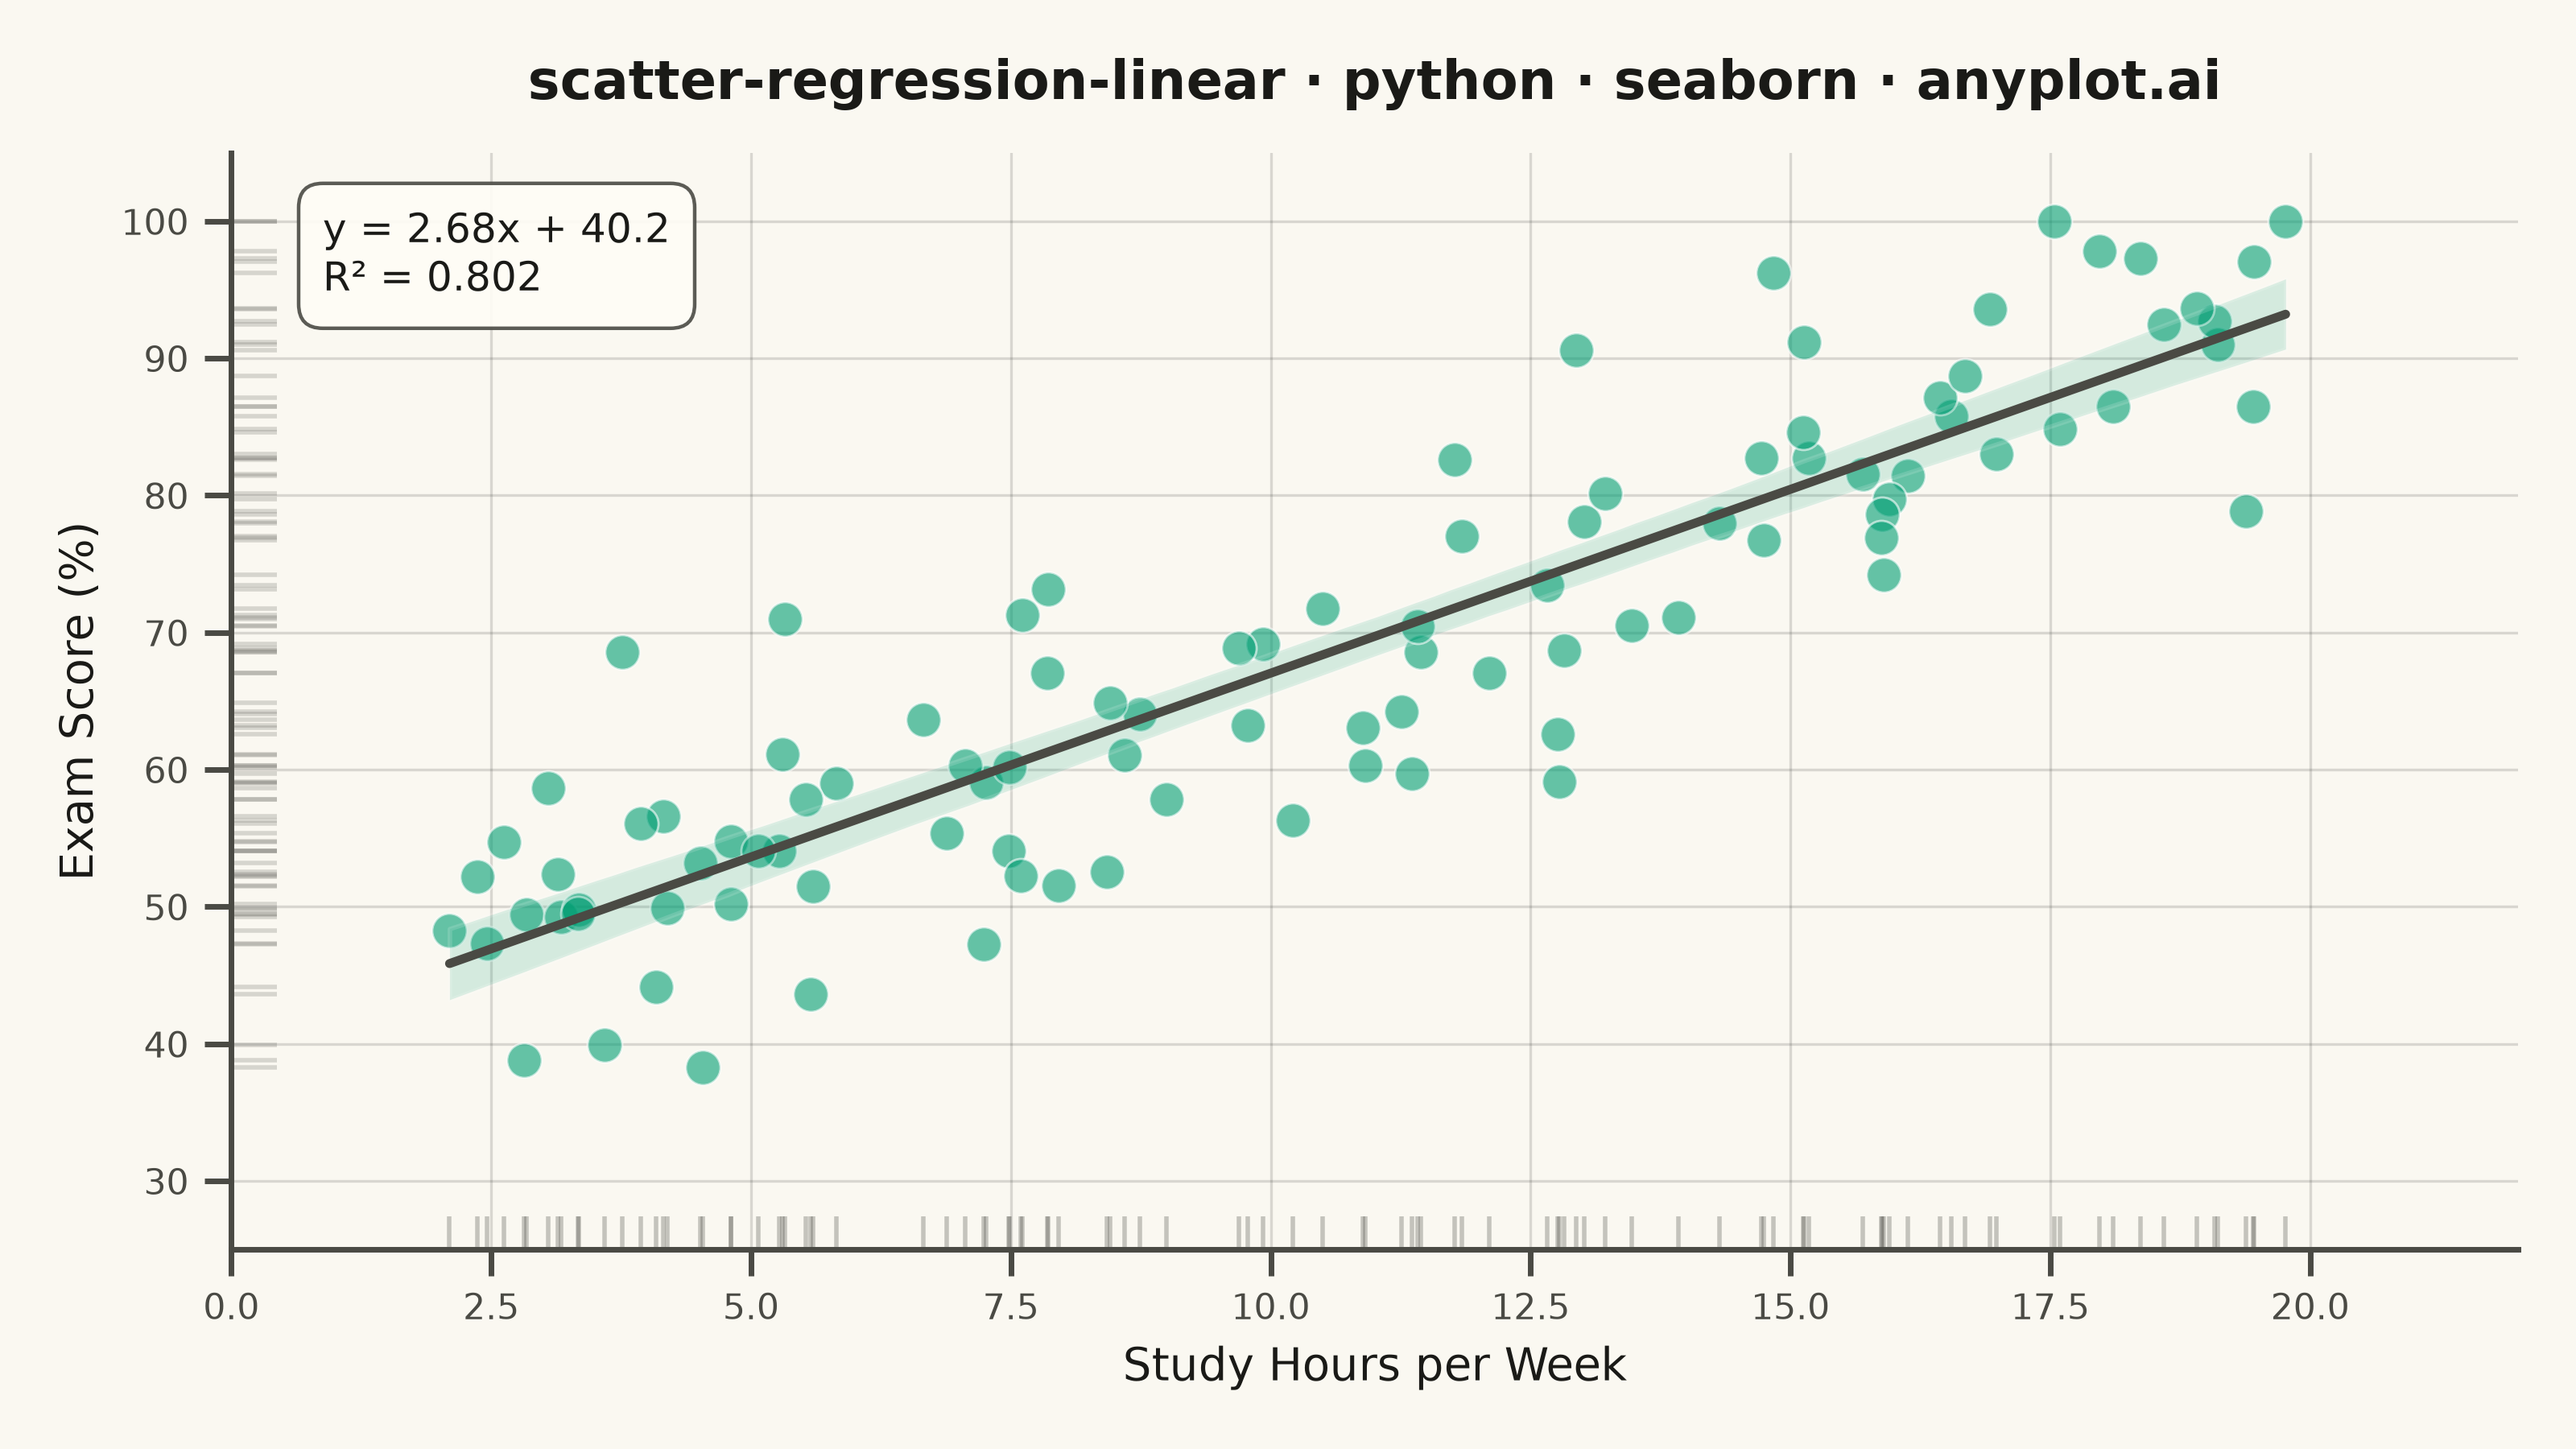
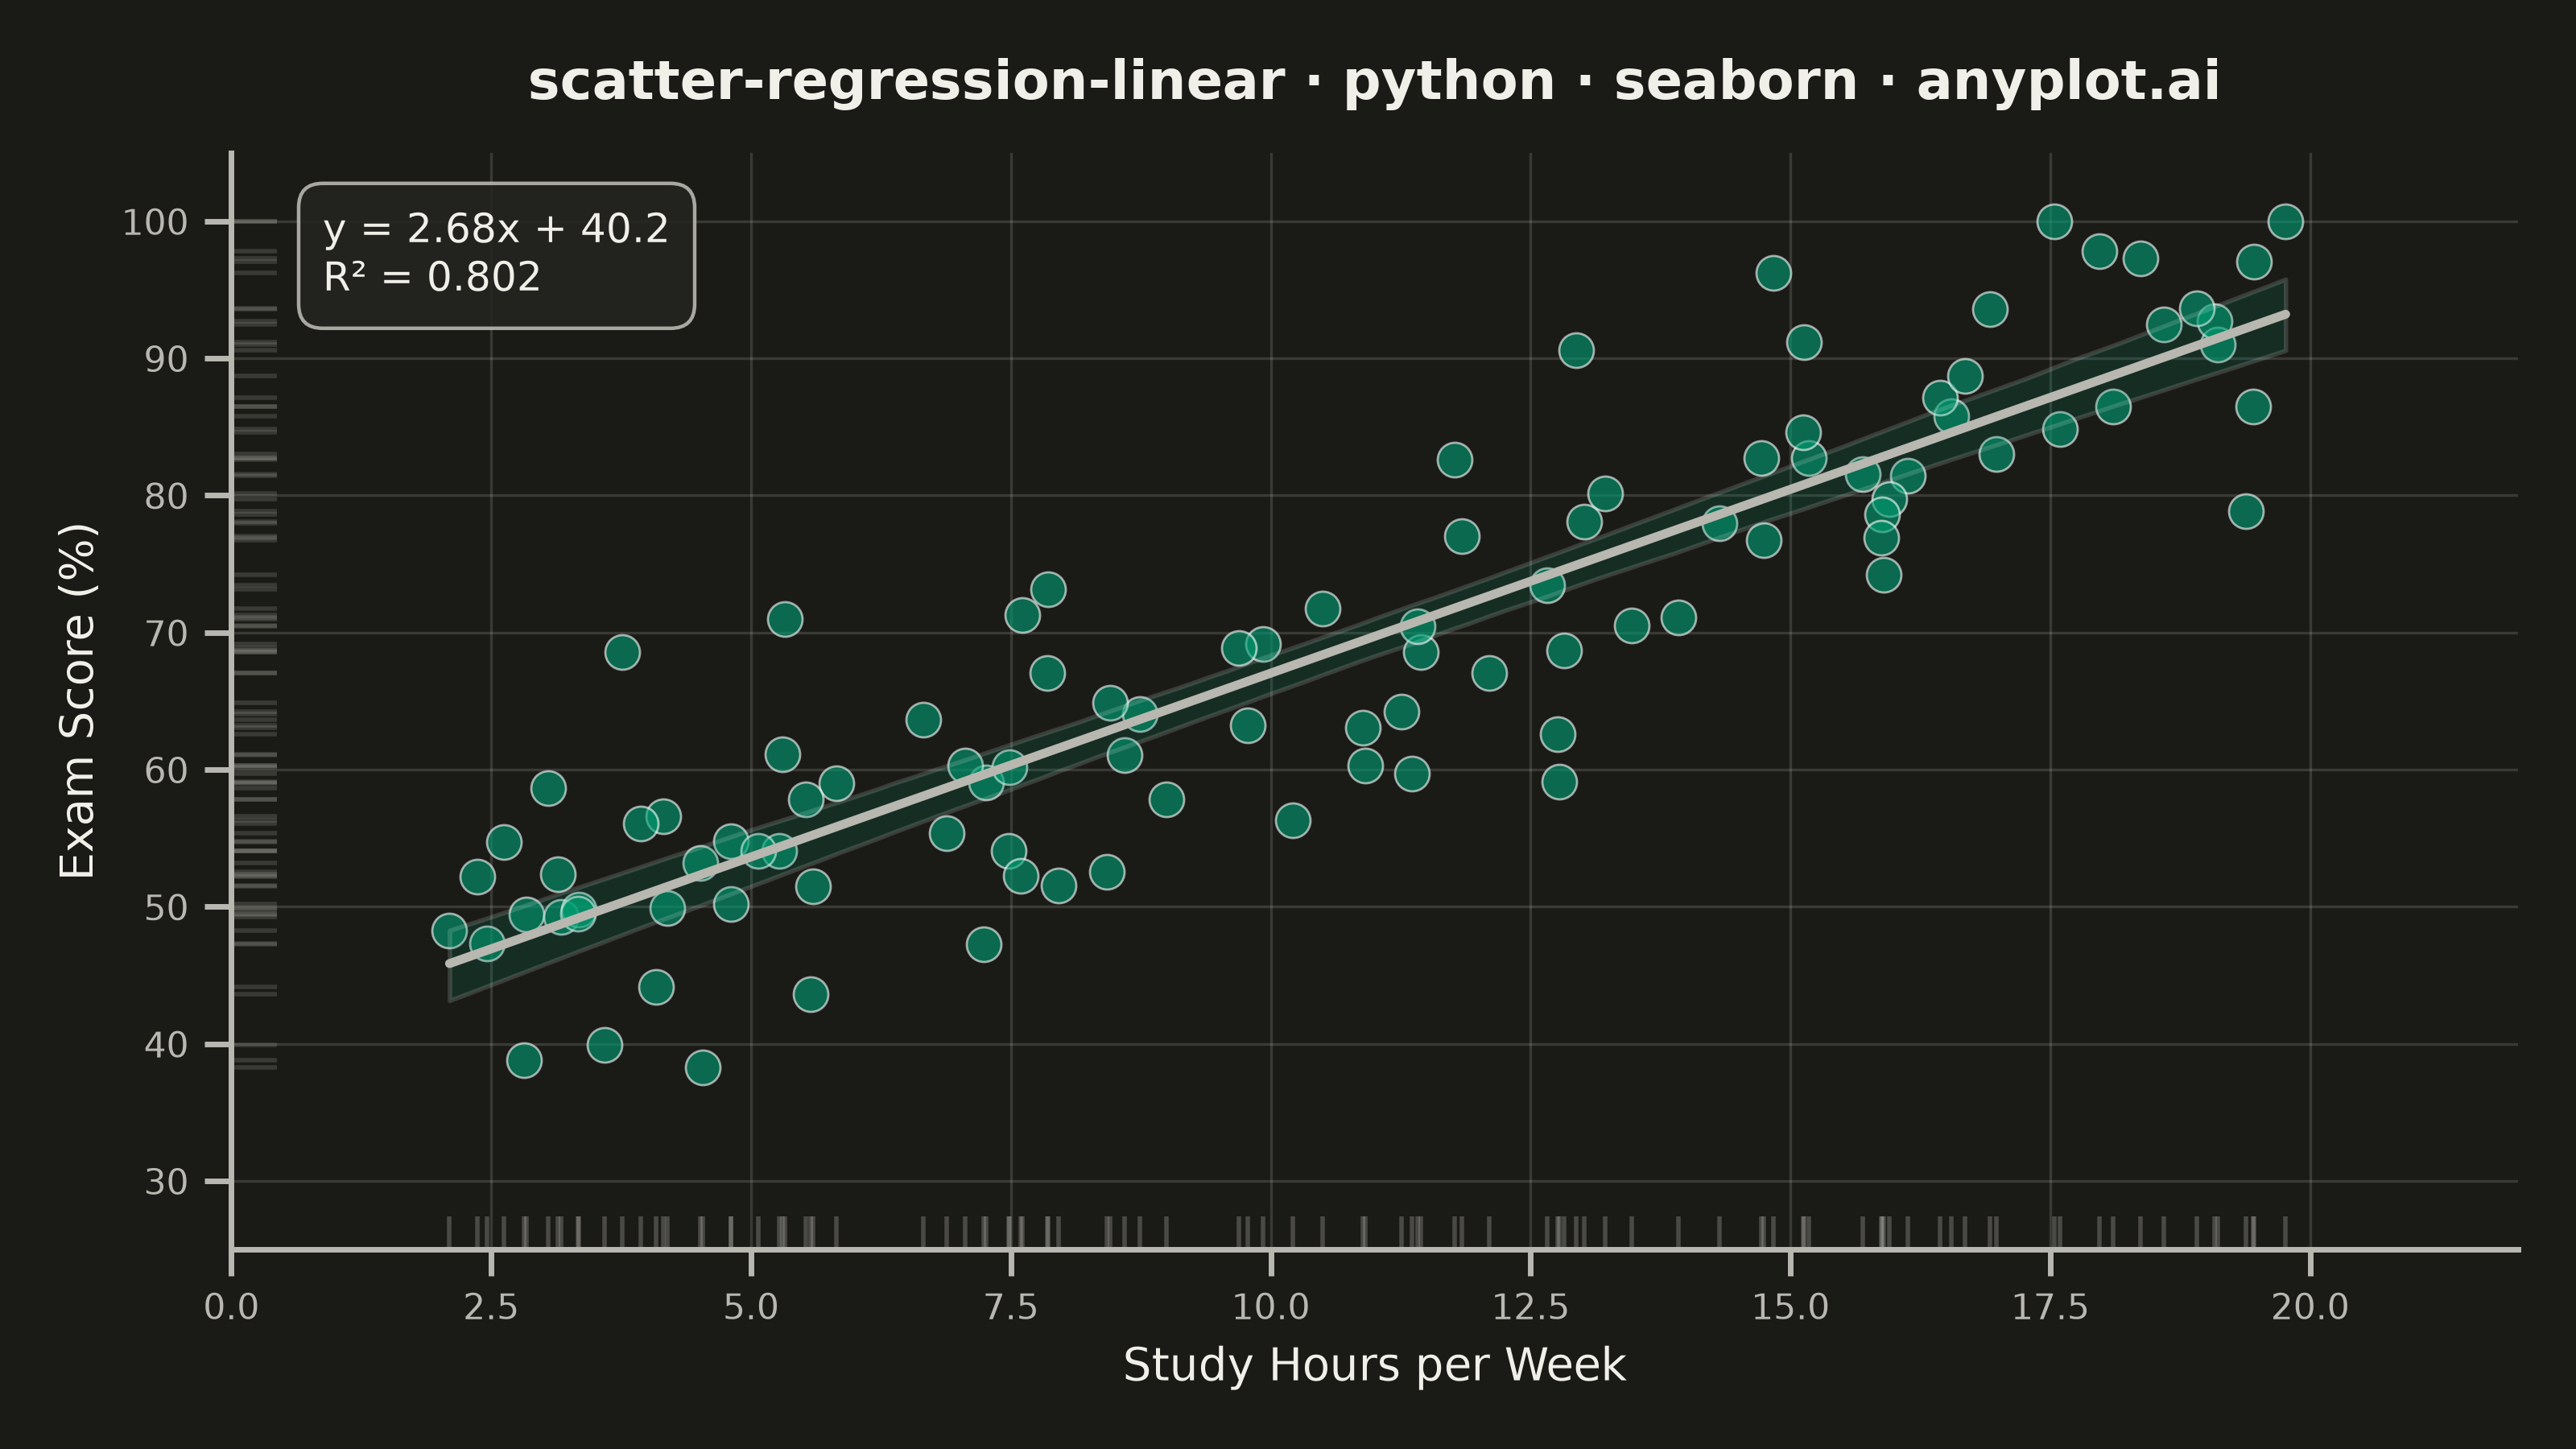
A scatter plot that displays the relationship between two numeric variables with a fitted linear regression line and confidence interval band. This visualization extends the basic scatter plot by adding statistical modeling elements, making it ideal for understanding linear relationships, assessing model fit, and communicating the strength of correlations with visual uncertainty quantification.
Preview render from the Seaborn implementation.