The same plot in 14 other libraries — JavaScript: Chart.js, D3.js, Apache ECharts, Highcharts; Python: Altair, Bokeh, lets-plot, Matplotlib, Plotly, plotnine, Pygal, Seaborn; R: ggplot2; Julia: Makie.jl. Compare all 15 side by side: Scatter Plot with Linear Regression in Python, R, Julia and JavaScript.
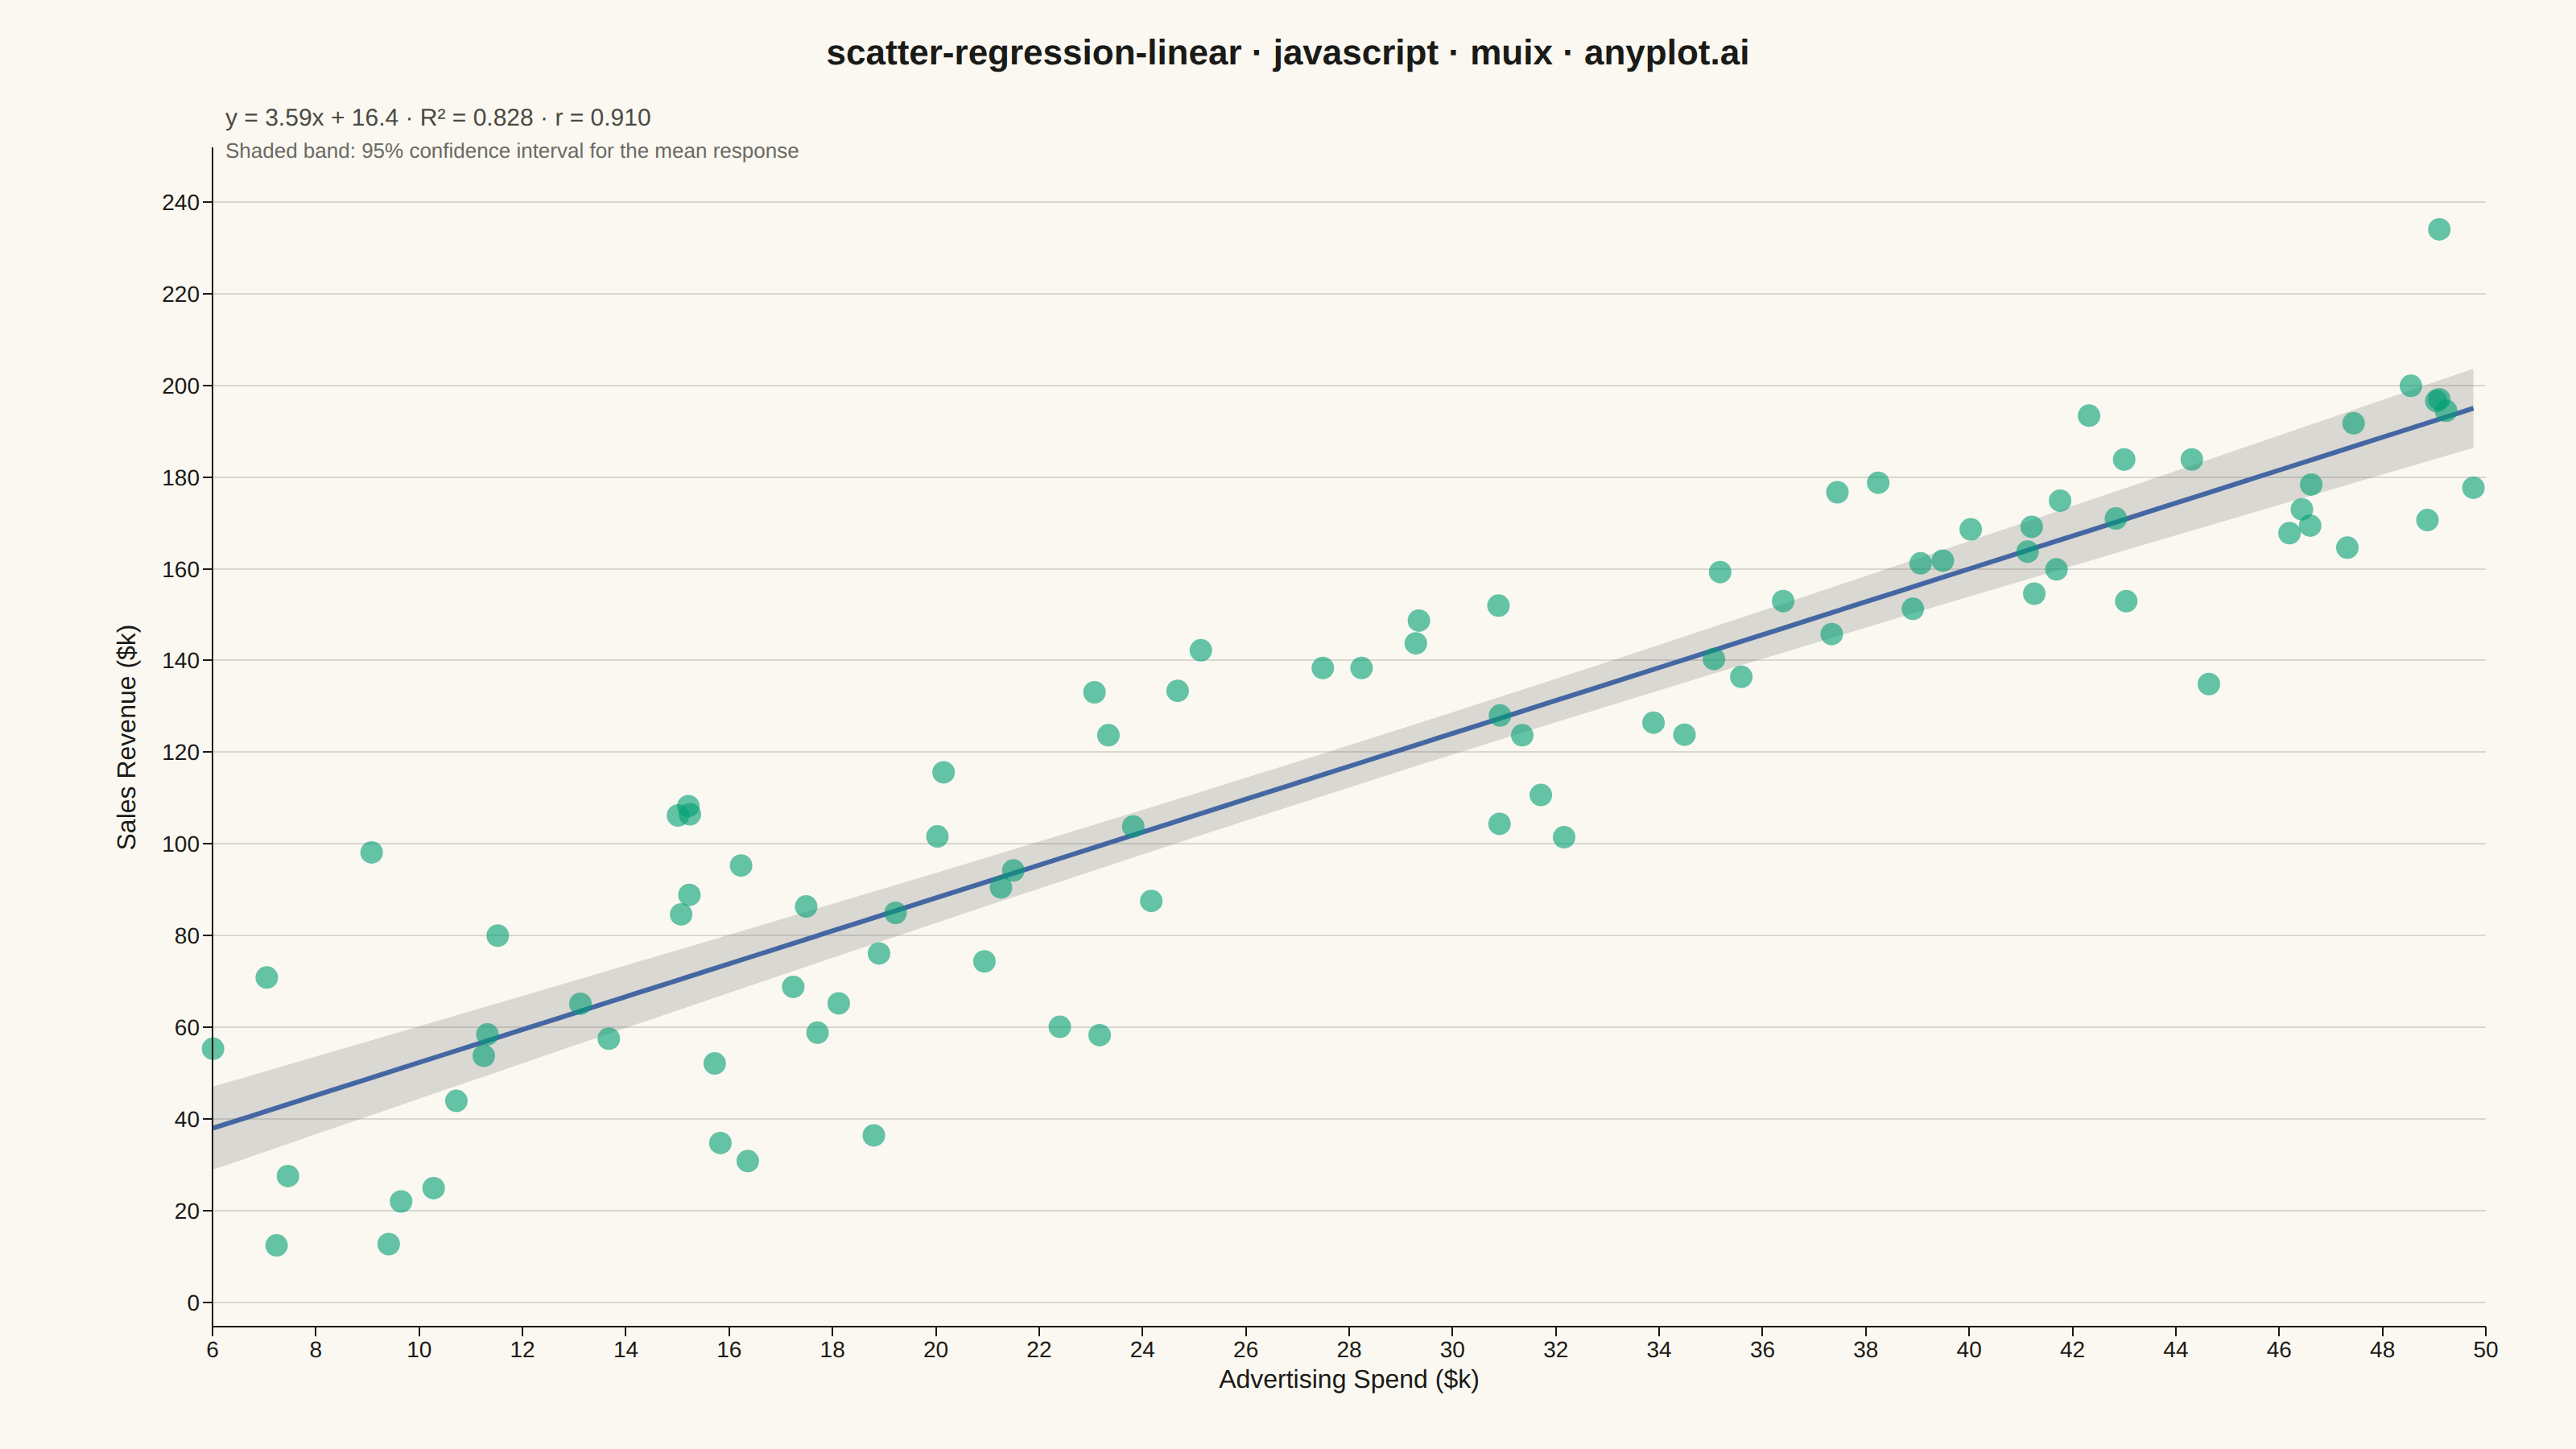
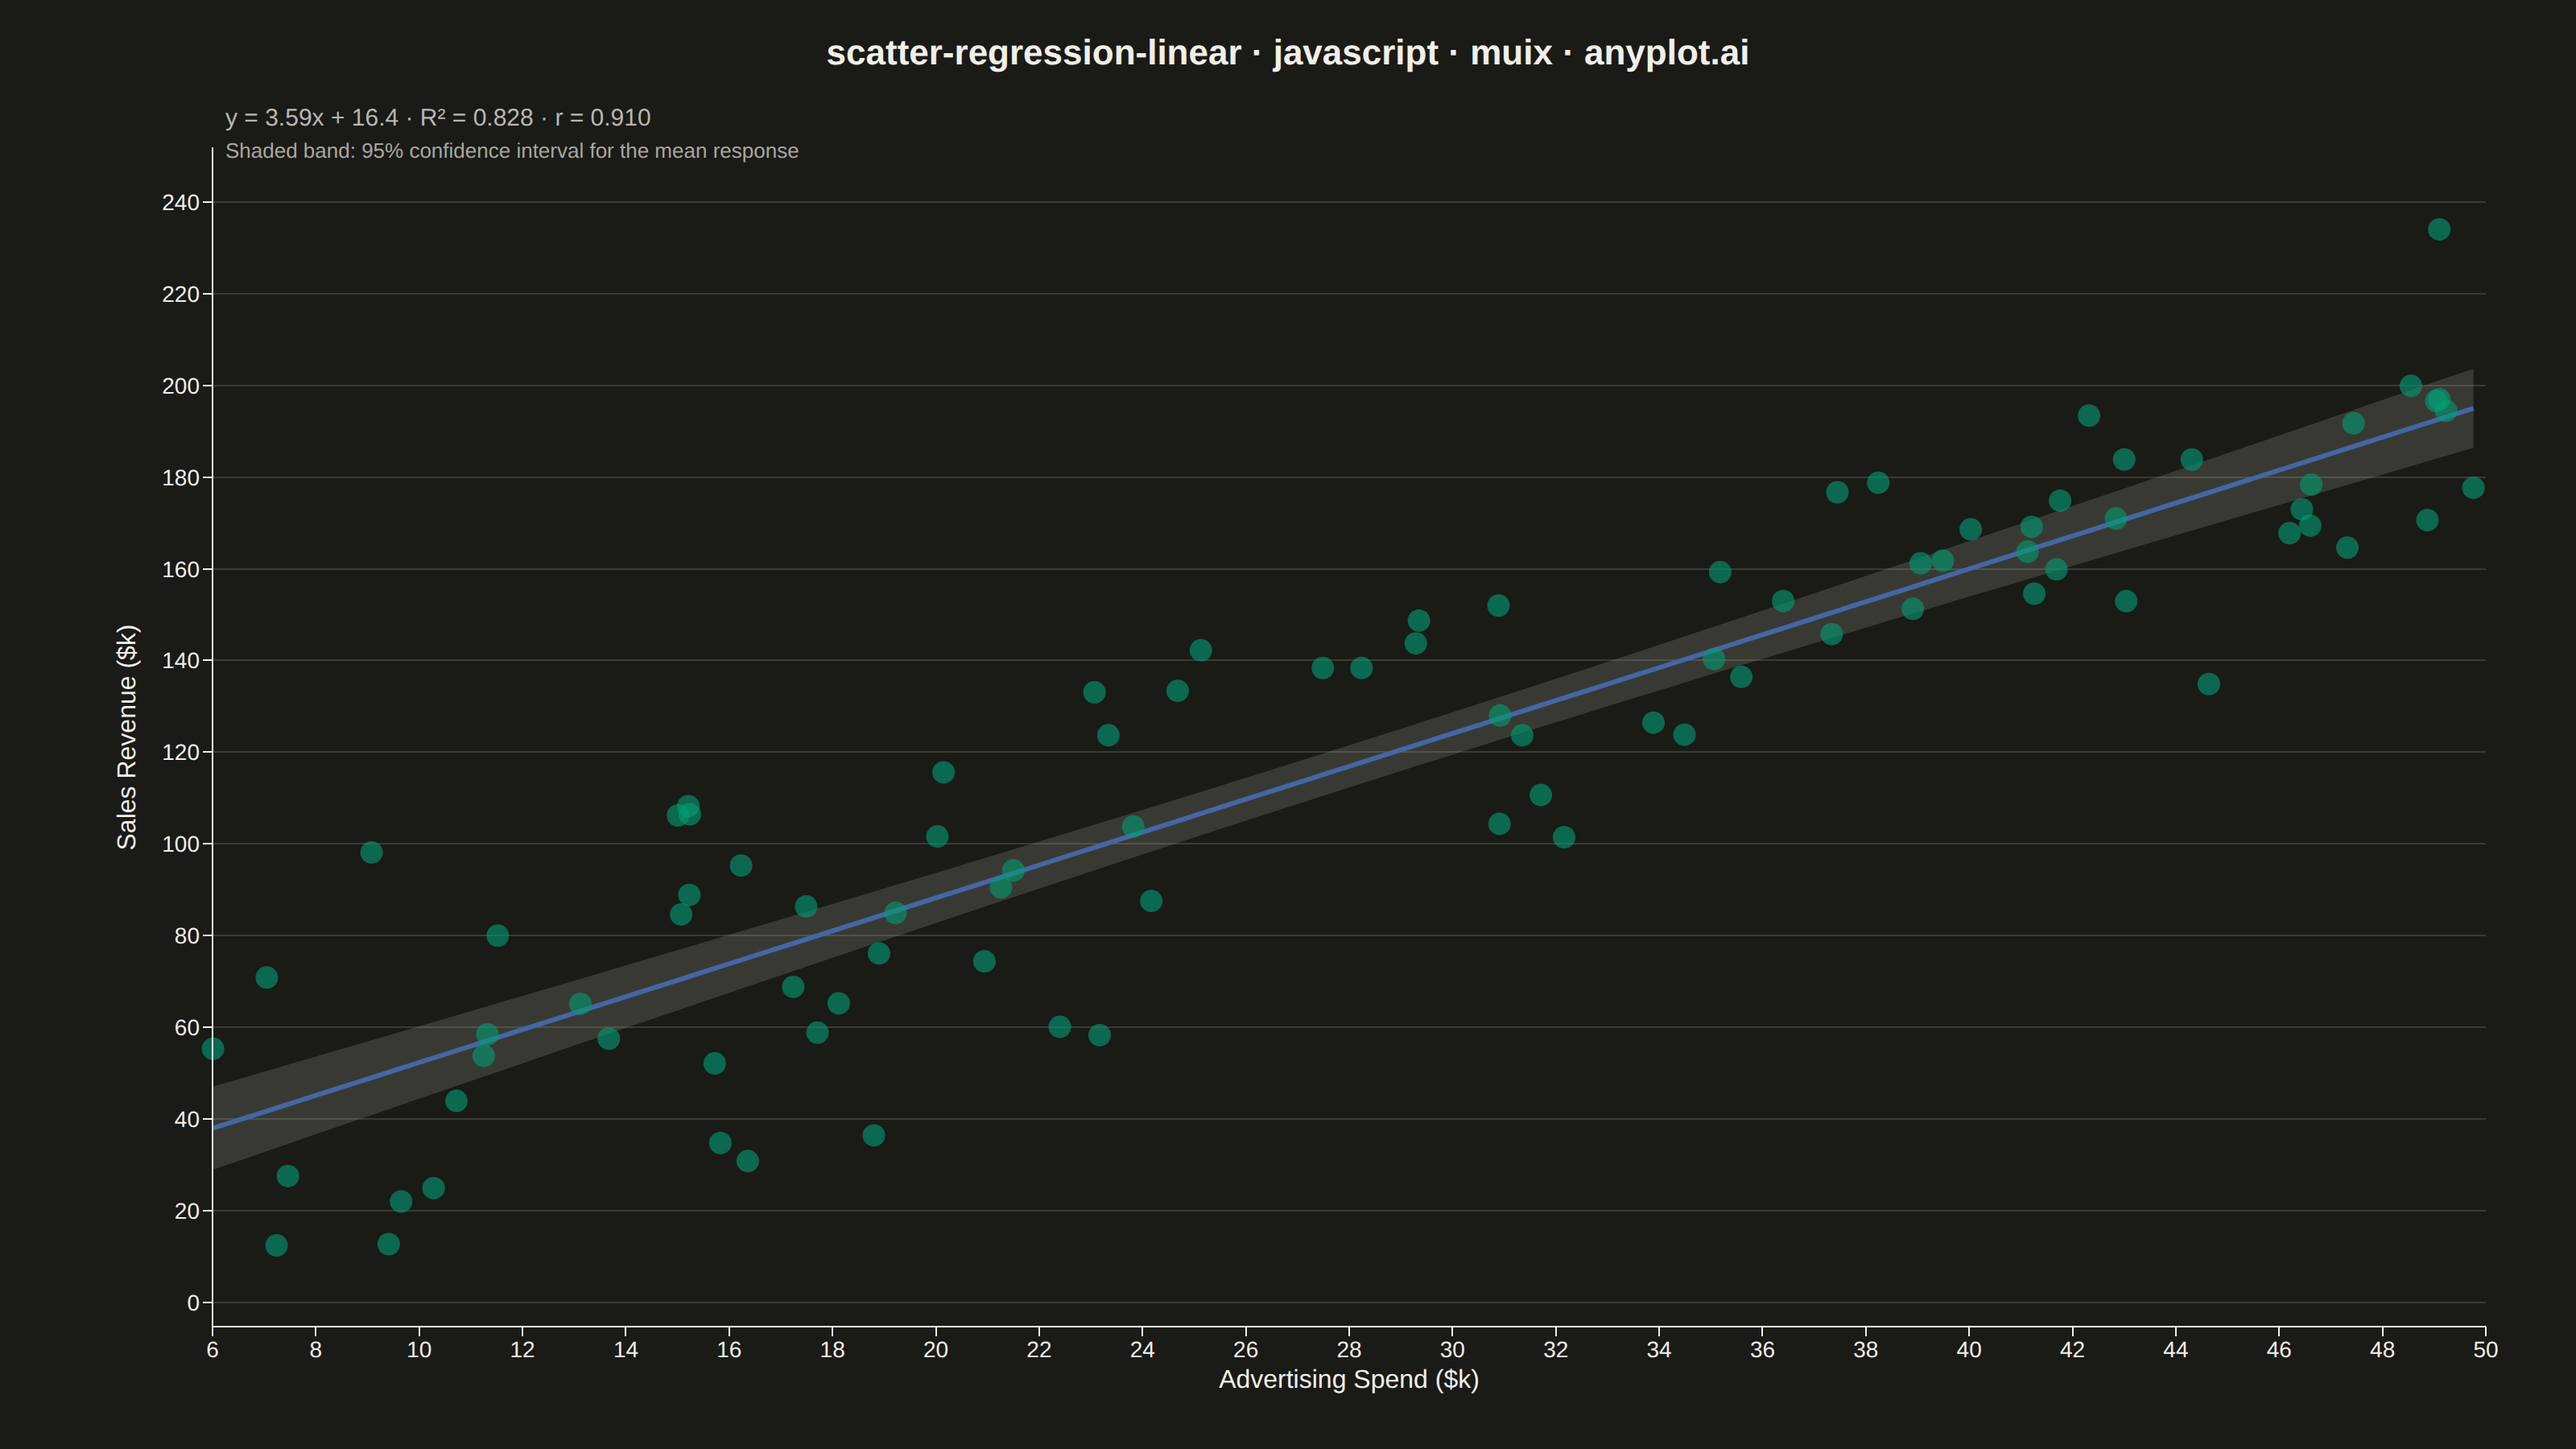
A scatter plot that displays the relationship between two numeric variables with a fitted linear regression line and confidence interval band. This visualization extends the basic scatter plot by adding statistical modeling elements, making it ideal for understanding linear relationships, assessing model fit, and communicating the strength of correlations with visual uncertainty quantification.
// anyplot.ai
// scatter-regression-linear: Scatter Plot with Linear Regression
// Library: muix 7.29.1 | JavaScript 22.23.1
// Quality: 89/100 | Created: 2026-08-05
import { ChartContainer } from "@mui/x-charts/ChartContainer";
import { ScatterPlot } from "@mui/x-charts/ScatterChart";
import { LinePlot } from "@mui/x-charts/LineChart";
import { ChartsXAxis } from "@mui/x-charts/ChartsXAxis";
import { ChartsYAxis } from "@mui/x-charts/ChartsYAxis";
import { ChartsGrid } from "@mui/x-charts/ChartsGrid";
import { useXScale, useYScale } from "@mui/x-charts/hooks";

const t = window.ANYPLOT_TOKENS;
const THEME = window.ANYPLOT_THEME === "dark" ? "dark" : "light";
// ANYPLOT_TOKENS has no "muted" anchor — derive it from default-style-guide.md
// "Theme-adaptive Chrome" (tertiary text / confidence-band fill token).
const INK_MUTED = THEME === "dark" ? "#A8A79F" : "#6B6A63";

// --- Deterministic PRNG (LCG) + Box-Muller for reproducible normal noise ----
function makeLcg(seed: number) {
  let state = seed;
  return function next() {
    state = (state * 1664525 + 1013904223) % 4294967296;
    return state / 4294967296;
  };
}
function randNormal(rand: () => number) {
  const u1 = Math.max(rand(), 1e-9);
  const u2 = rand();
  return Math.sqrt(-2 * Math.log(u1)) * Math.cos(2 * Math.PI * u2);
}

// --- Data: advertising spend ($k) vs sales revenue ($k) ---------------------
const rand = makeLcg(42);
const POINT_COUNT = 90;
const adSpend: number[] = [];
const salesRevenue: number[] = [];
for (let i = 0; i < POINT_COUNT; i += 1) {
  const spend = 5 + rand() * 45;
  const revenue = 22 + spend * 3.4 + randNormal(rand) * 24;
  adSpend.push(Number(spend.toFixed(2)));
  salesRevenue.push(Number(Math.max(revenue, 8).toFixed(2)));
}

// --- Ordinary least-squares regression + 95% confidence band ----------------
const n = adSpend.length;
const xMean = adSpend.reduce((a, b) => a + b, 0) / n;
const yMean = salesRevenue.reduce((a, b) => a + b, 0) / n;
let sxy = 0;
let sxx = 0;
for (let i = 0; i < n; i += 1) {
  sxy += (adSpend[i] - xMean) * (salesRevenue[i] - yMean);
  sxx += (adSpend[i] - xMean) ** 2;
}
const slope = sxy / sxx;
const intercept = yMean - slope * xMean;

let ssRes = 0;
let ssTot = 0;
for (let i = 0; i < n; i += 1) {
  const fitted = intercept + slope * adSpend[i];
  ssRes += (salesRevenue[i] - fitted) ** 2;
  ssTot += (salesRevenue[i] - yMean) ** 2;
}
const rSquared = 1 - ssRes / ssTot;
const correlation = Math.sign(slope) * Math.sqrt(rSquared);
const residualStdErr = Math.sqrt(ssRes / (n - 2));
const T_CRIT_95 = 1.987; // two-tailed 95% critical value, t-distribution df=88

const GRID_POINTS = 60;
const xMin = Math.min(...adSpend);
const xMax = Math.max(...adSpend);
const gridX = Array.from(
  { length: GRID_POINTS },
  (_, i) => xMin + ((xMax - xMin) * i) / (GRID_POINTS - 1),
);
const fittedY = gridX.map((x) => intercept + slope * x);
const bandHalfWidth = gridX.map(
  (x) => T_CRIT_95 * residualStdErr * Math.sqrt(1 / n + (x - xMean) ** 2 / sxx),
);
const upperY = fittedY.map((y, i) => y + bandHalfWidth[i]);
const lowerY = fittedY.map((y, i) => y - bandHalfWidth[i]);

const scatterData = adSpend.map((x, i) => ({
  x,
  y: salesRevenue[i],
  id: `pt-${i}`,
}));

const yAllValues = [...salesRevenue, ...upperY, ...lowerY];
const yPad = (Math.max(...yAllValues) - Math.min(...yAllValues)) * 0.08;
const yDomainMin = Math.min(...yAllValues) - yPad;
const yDomainMax = Math.max(...yAllValues) + yPad;

const regressionColor = t.palette[2]; // blue — distinct from the brand-green points
const equationLabel = `y = ${slope.toFixed(2)}x + ${intercept.toFixed(1)}   ·   R² = ${rSquared.toFixed(3)}   ·   r = ${correlation.toFixed(3)}`;

const title = "scatter-regression-linear · javascript · muix · anyplot.ai";

function ConfidenceBand() {
  const xScale = useXScale();
  const yScale = useYScale();
  const top = gridX
    .map((x, i) => `${xScale(x)},${yScale(upperY[i])}`)
    .join(" L ");
  const bottomIndices = [...gridX.keys()].reverse();
  const bottom = bottomIndices
    .map((i) => `${xScale(gridX[i])},${yScale(lowerY[i])}`)
    .join(" L ");
  return (
    <path
      d={`M ${top} L ${bottom} Z`}
      fill={INK_MUTED}
      opacity={0.22}
      stroke="none"
    />
  );
}

// --- Chart (default-exported component — the harness mounts it) ------------
export default function Chart() {
  const { width, height } = window.ANYPLOT_SIZE;

  return (
    <ChartContainer
      width={width}
      height={height}
      margin={{ top: 92, right: 56, bottom: 76, left: 132 }}
      series={[
        {
          type: "scatter",
          id: "observations",
          data: scatterData,
          markerSize: 7,
          color: `${t.palette[0]}99`,
        },
        {
          type: "line",
          id: "regression",
          data: fittedY,
          curve: "linear",
          color: regressionColor,
          showMark: false,
          disableHighlight: true,
        },
      ]}
      xAxis={[
        {
          data: gridX,
          scaleType: "linear",
          label: "Advertising Spend ($k)",
          tickLabelStyle: { fontSize: 14 },
          labelStyle: { fontSize: 16 },
        },
      ]}
      yAxis={[
        {
          scaleType: "linear",
          min: yDomainMin,
          max: yDomainMax,
          label: "Sales Revenue ($k)",
          // tickFontSize drives the y-axis label's clearance from the tick labels
          // (MUI X positions the rotated label at tickFontSize + tickSize + 10 px
          // from the axis line); it's set well above tickLabelStyle.fontSize so
          // the label never collides with 3-digit tick values like "140".
          tickFontSize: 32,
          tickLabelStyle: { fontSize: 14 },
          labelStyle: { fontSize: 16 },
        },
      ]}
      skipAnimation
    >
      <ChartsGrid horizontal />
      <ConfidenceBand />
      <LinePlot
        skipAnimation
        slotProps={{ line: { style: { strokeWidth: 3 } } }}
      />
      <ScatterPlot />
      <ChartsXAxis />
      <ChartsYAxis />
      <text
        x={width / 2}
        y={40}
        textAnchor="middle"
        fontSize={22}
        fontWeight={600}
        fill={t.ink}
      >
        {title}
      </text>
      <text x={140} y={78} fontSize={15} fill={t.inkSoft}>
        {equationLabel}
      </text>
      <text x={140} y={98} fontSize={13} fill={INK_MUTED}>
        Shaded band: 95% confidence interval for the mean response
      </text>
    </ChartContainer>
  );
}
Runnable source as JSON, for any HTTP client: https://api.anyplot.ai/specs/scatter-regression-linear/muix/code. Any spec id and library id listed in llms-full.txt fit the same URL shape; every URL below is complete and callable.
{
  "spec_id": "scatter-regression-linear",
  "language": "javascript",
  "library": "muix",
  "page": "https://anyplot.ai/scatter-regression-linear/javascript/muix",
  "hub": "https://anyplot.ai/scatter-regression-linear",
  "code_json": "https://api.anyplot.ai/specs/scatter-regression-linear/muix/code",
  "spec_json": "https://api.anyplot.ai/specs/scatter-regression-linear",
  "render_light_png": "https://storage.googleapis.com/anyplot-images/plots/scatter-regression-linear/javascript/muix/plot-light.png",
  "render_dark_png": "https://storage.googleapis.com/anyplot-images/plots/scatter-regression-linear/javascript/muix/plot-dark.png",
  "interactive_light_html": "https://storage.googleapis.com/anyplot-images/plots/scatter-regression-linear/javascript/muix/plot-light.html",
  "interactive_dark_html": "https://storage.googleapis.com/anyplot-images/plots/scatter-regression-linear/javascript/muix/plot-dark.html",
  "quality_score": 89.0,
  "license": "MIT",
  "guide": "https://anyplot.ai/llms.txt"
}
Part of Scatter Plot with Linear Regression on anyplot.ai.