The same plot in 14 other libraries — JavaScript: D3.js, Apache ECharts, Highcharts, MUI X Charts; Python: Altair, Bokeh, lets-plot, Matplotlib, Plotly, plotnine, Pygal, Seaborn; R: ggplot2; Julia: Makie.jl. Compare all 15 side by side: Basketball Shot Chart in Python, R, Julia and JavaScript.
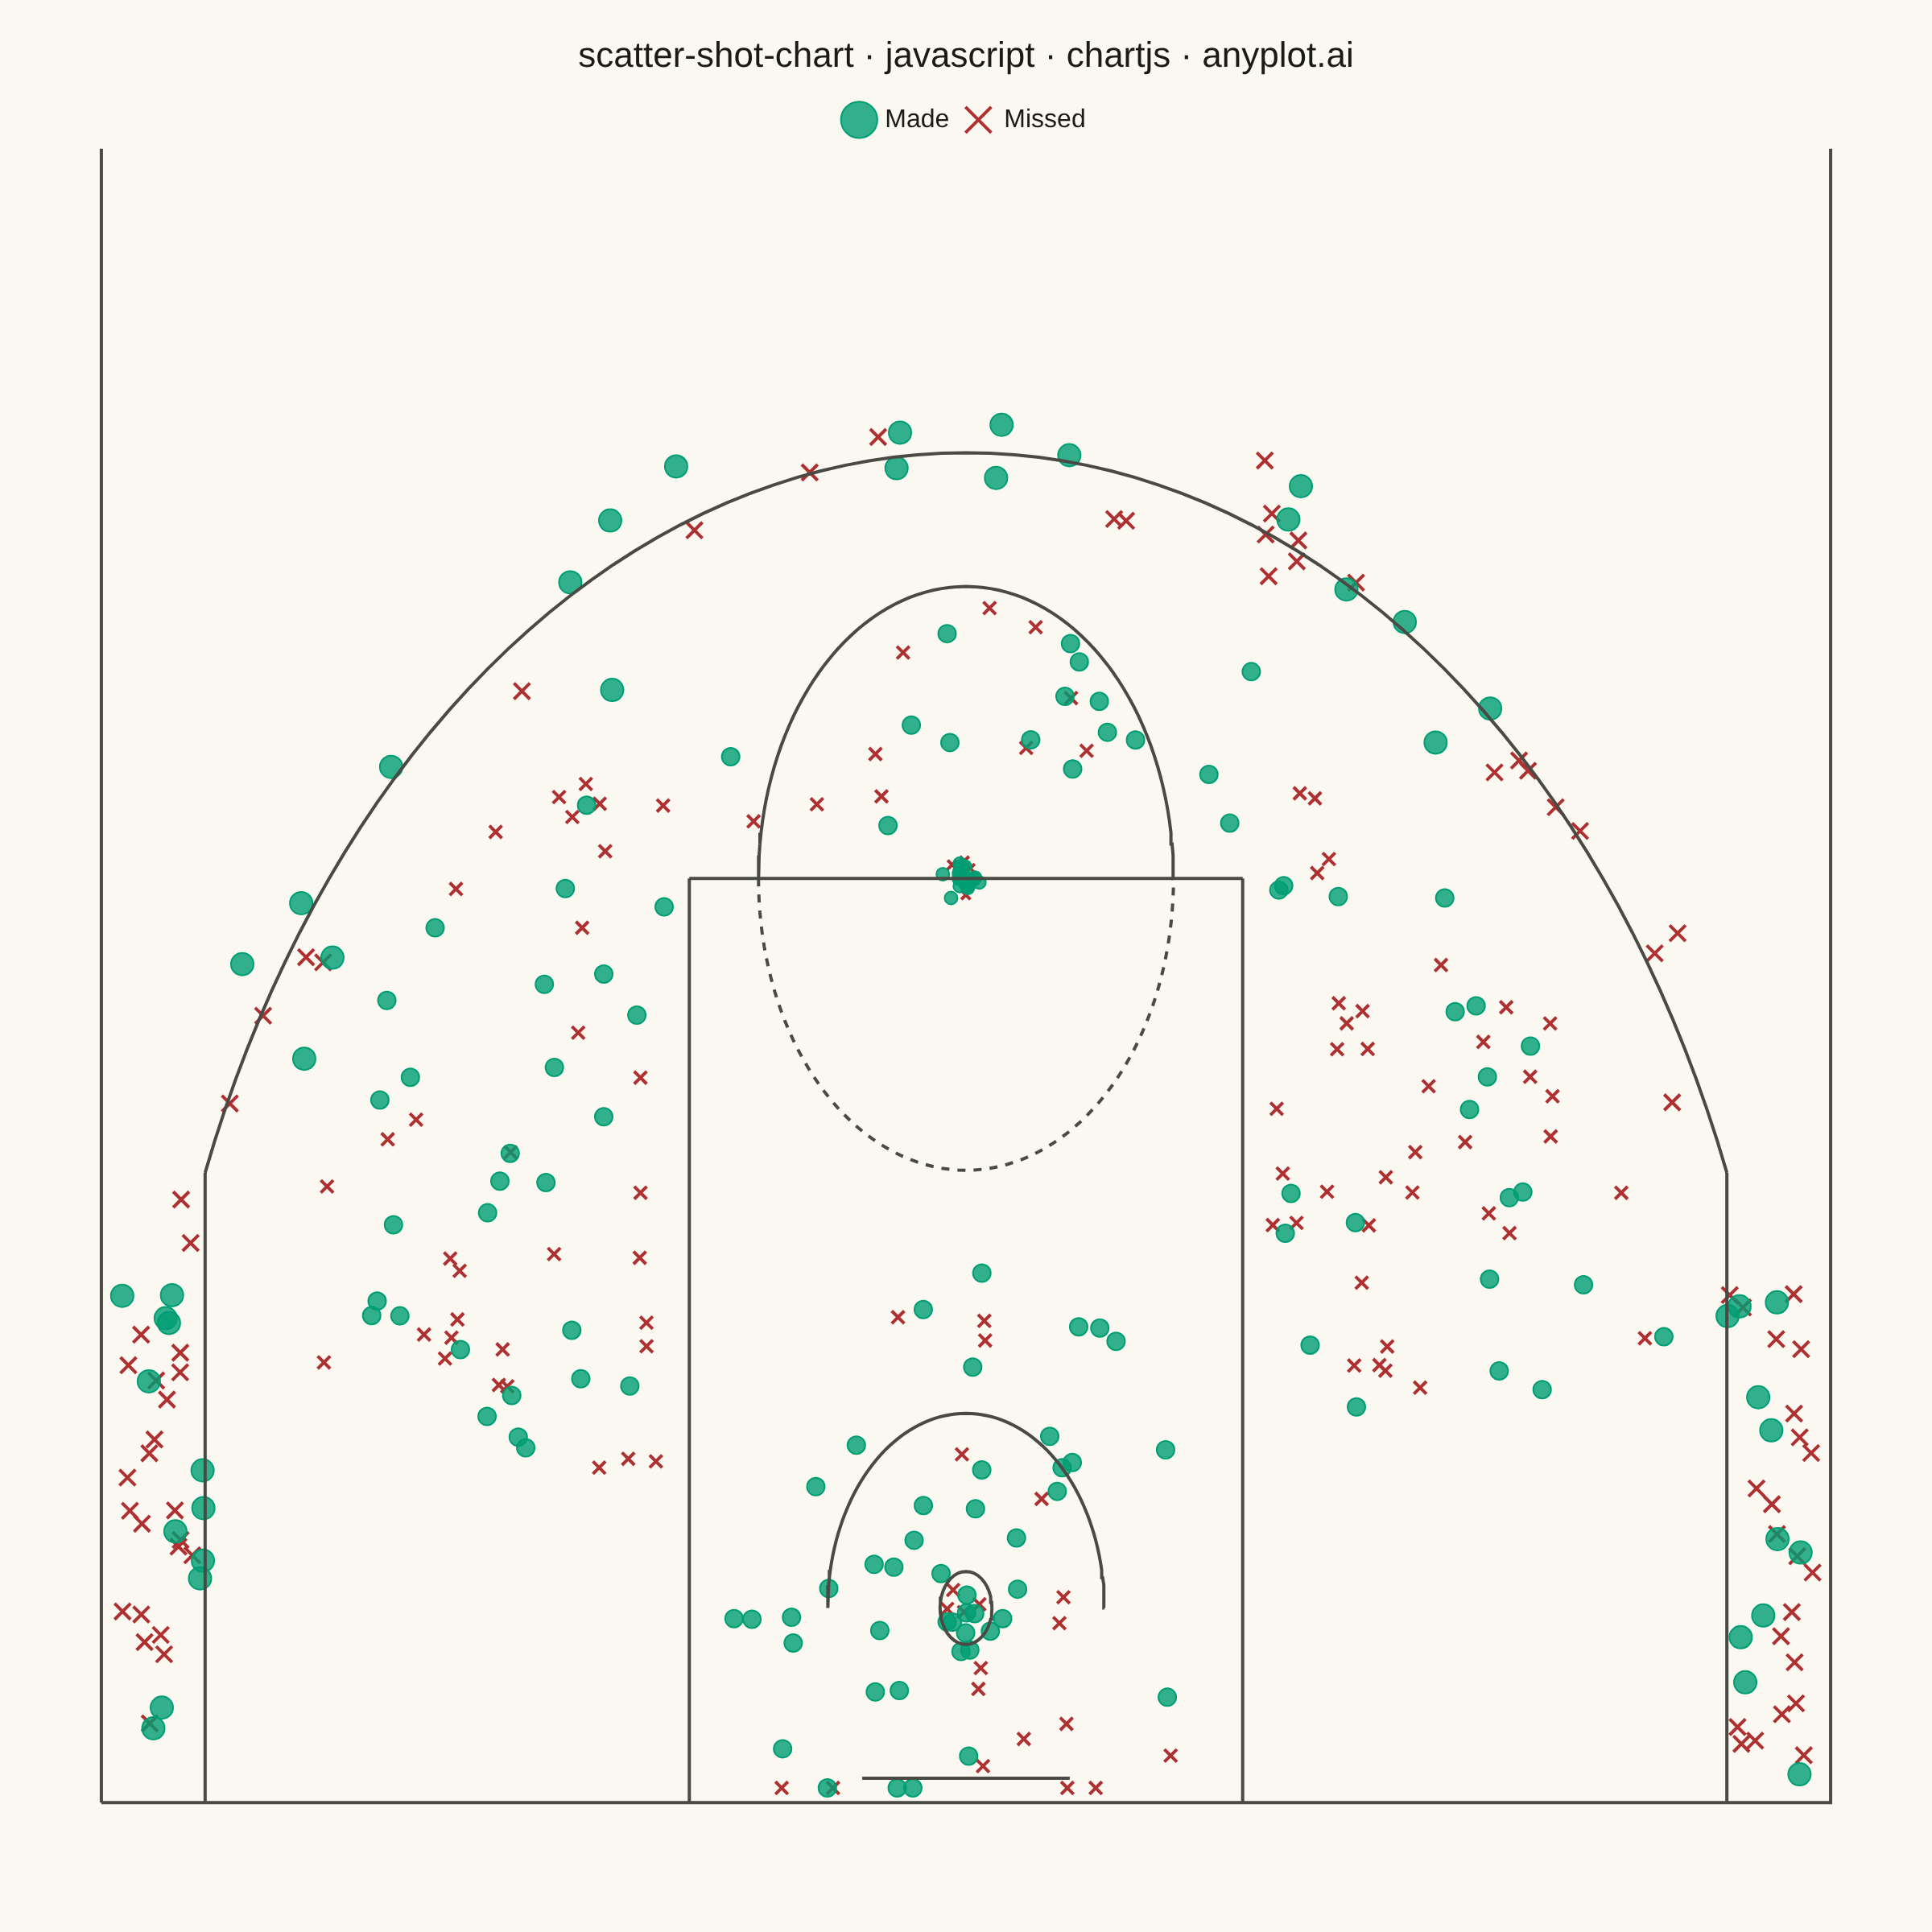
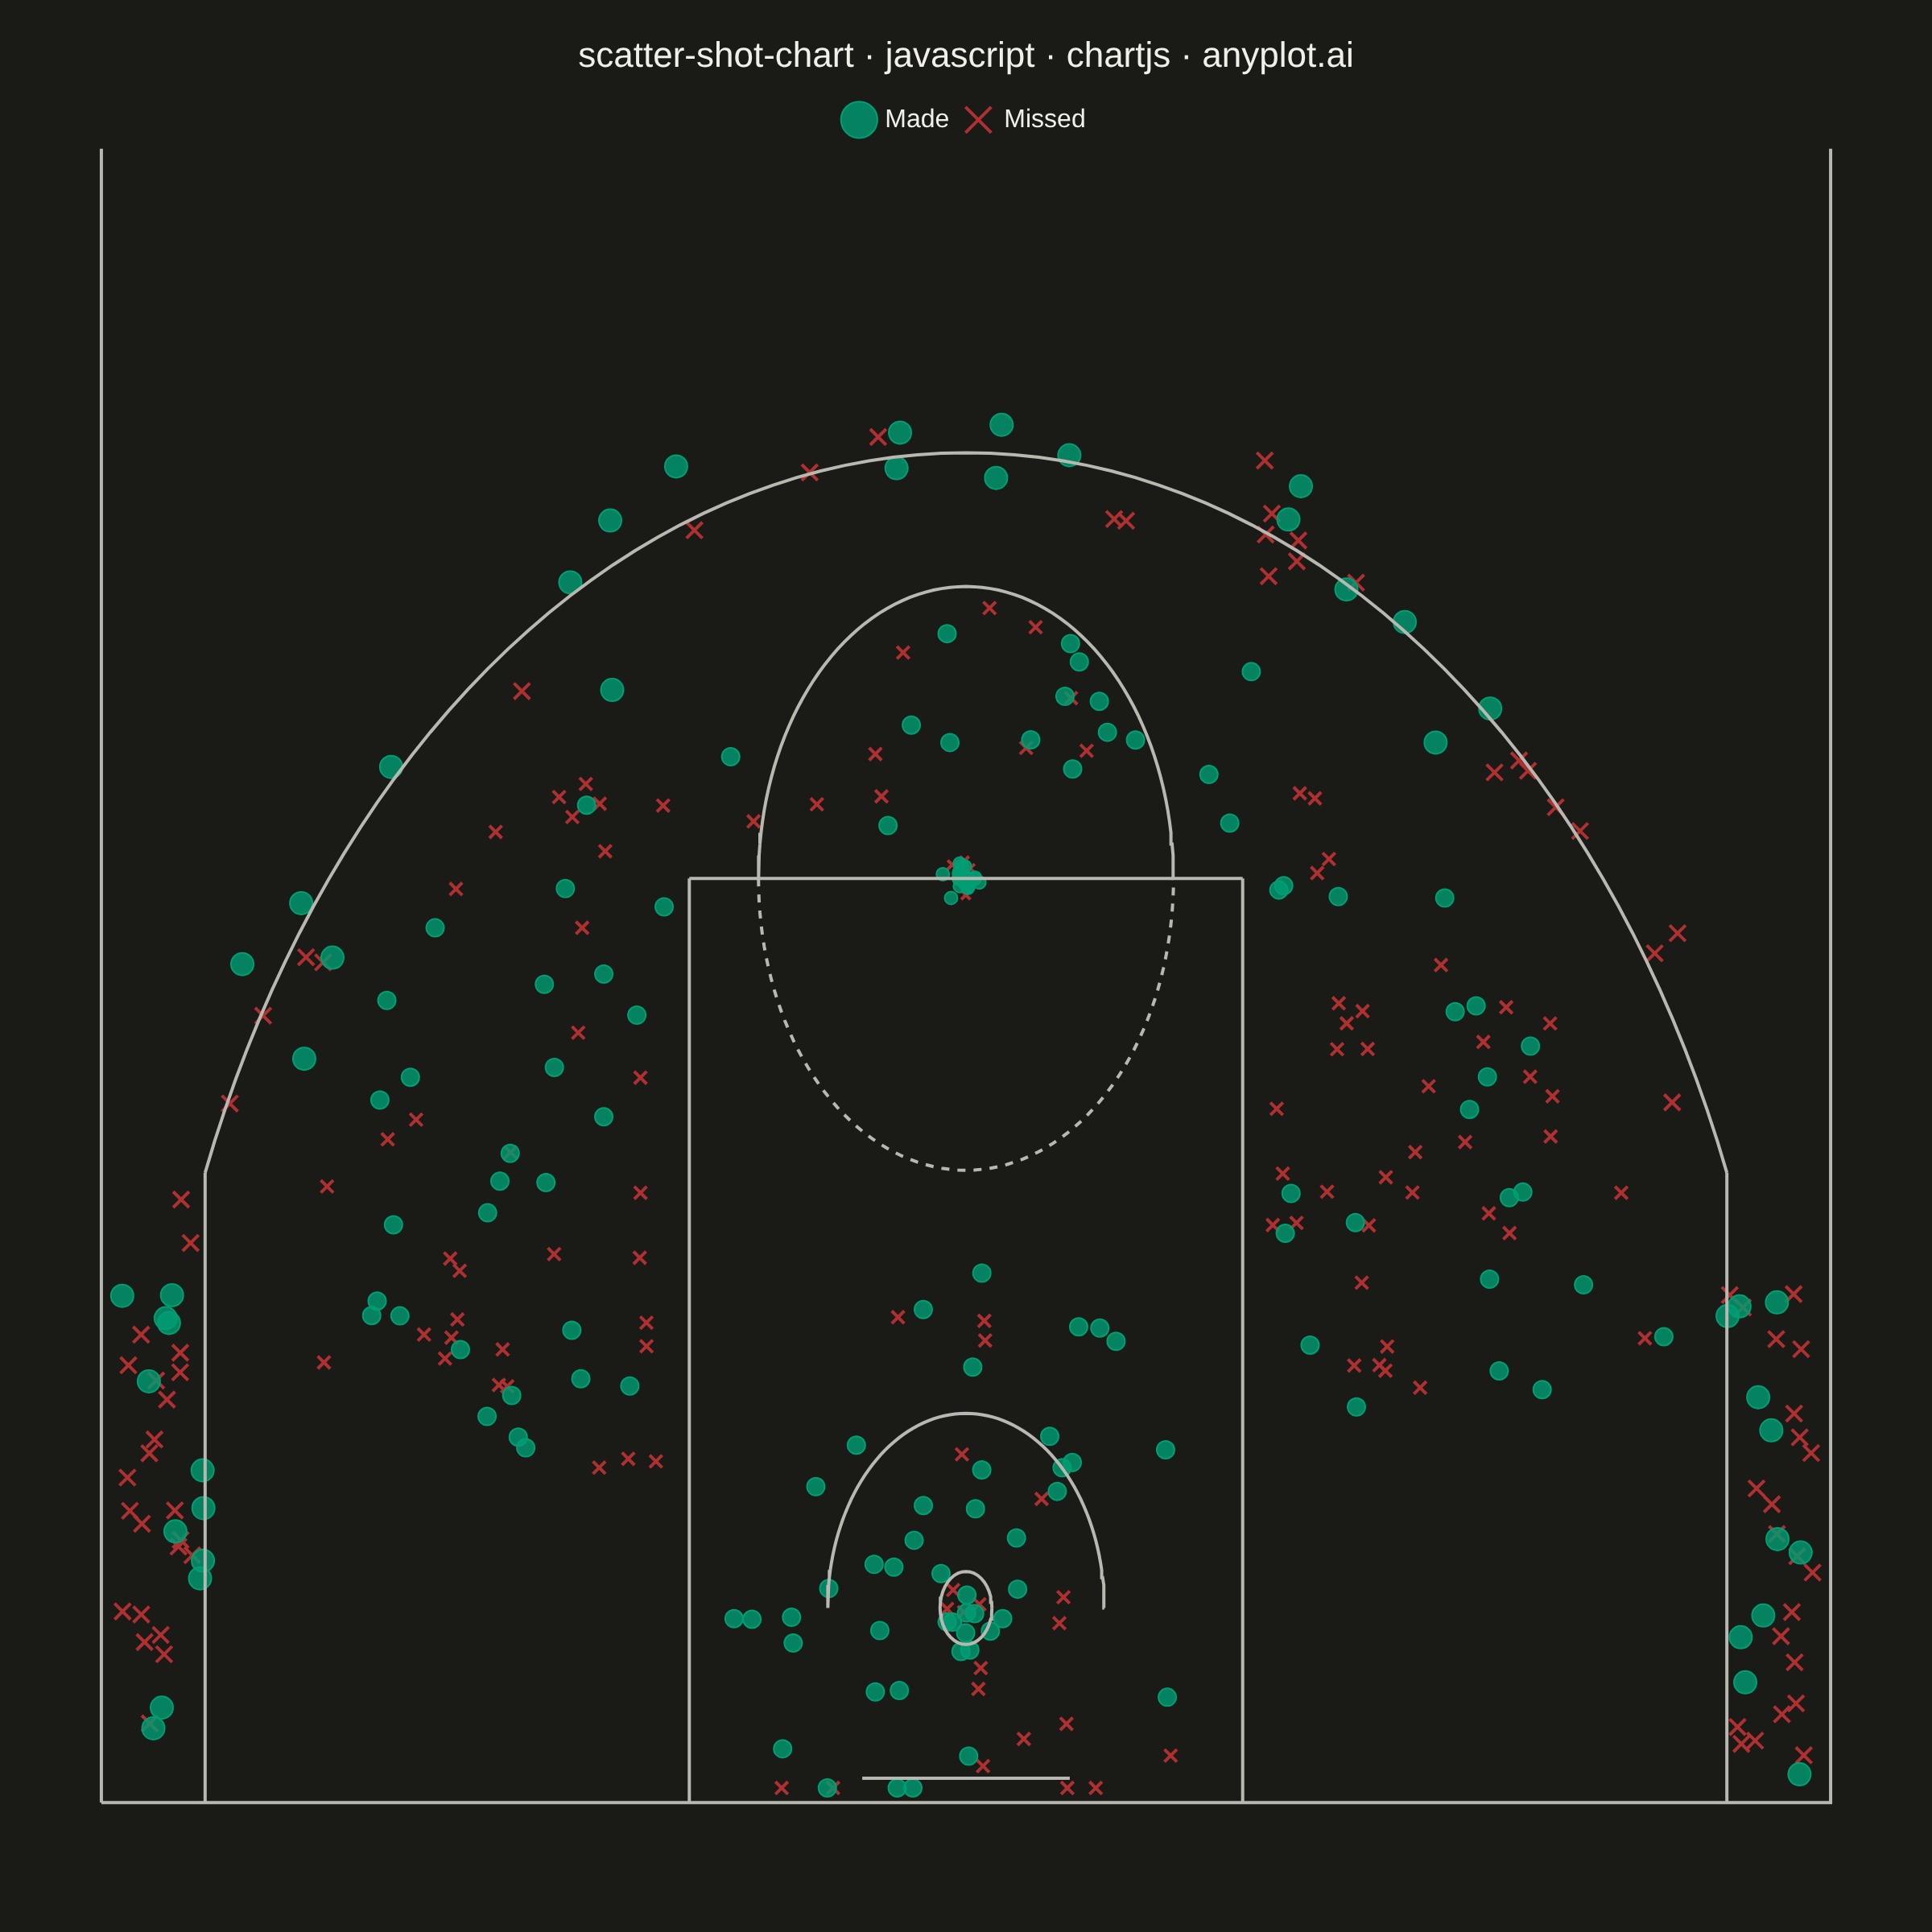
A basketball shot chart overlays shooting data on a half-court diagram, plotting each shot attempt as a point colored by outcome (made or missed). The court drawing includes the three-point arc, free-throw line, paint/key area, and basket, providing spatial context for analyzing shooting patterns and efficiency. Essential for basketball analytics and player evaluation.
// anyplot.ai
// scatter-shot-chart: Basketball Shot Chart
// Library: chartjs 4.4.7 | JavaScript 22.22.3
// Quality: 87/100 | Created: 2026-06-21

//# anyplot-orientation: square

const t = window.ANYPLOT_TOKENS;

// --- Seeded LCG for deterministic data ------------------------------------
let seed = 42;
function lcg() {
  seed = (seed * 1664525 + 1013904223) >>> 0;
  return seed / 0x100000000;
}
function randn(mean, std) {
  const u1 = Math.max(lcg(), 1e-10);
  const u2 = lcg();
  return mean + std * Math.sqrt(-2 * Math.log(u1)) * Math.cos(2 * Math.PI * u2);
}

// --- NBA Half-Court Geometry (feet) ---------------------------------------
// Basket at (BX, BY); court: x in [-25, 25], y in [0, 47]
const BX = 0, BY = 4;
const C3X = 22;
const TP_R = 23.75;
const FT_Y = BY + 15;
const C3Y = BY + Math.sqrt(TP_R * TP_R - C3X * C3X); // ~12.95

function arcPts(cx, cy, r, a0, a1, n) {
  const steps = n || 80;
  const pts = [];
  for (let i = 0; i <= steps; i++) {
    const a = a0 + (a1 - a0) * (i / steps);
    pts.push({ x: cx + r * Math.cos(a), y: cy + r * Math.sin(a) });
  }
  return pts;
}

// Three-point arc: left corner → top → right corner (decreasing angle)
const tpA0 = Math.atan2(C3Y - BY, -C3X);
const tpA1 = Math.atan2(C3Y - BY, C3X);

function courtLine(data, dash) {
  const ds = {
    type: 'line',
    data: data,
    borderColor: t.inkSoft,
    borderWidth: 2,
    backgroundColor: 'transparent',
    fill: false,
    pointRadius: 0,
    pointHoverRadius: 0,
    tension: 0,
    showLine: true,
    order: 0,
  };
  if (dash) ds.borderDash = dash;
  return ds;
}

const courtDatasets = [
  // Outer boundary
  courtLine([{x:-25,y:0},{x:25,y:0},{x:25,y:47},{x:-25,y:47},{x:-25,y:0}]),
  // Paint left/right
  courtLine([{x:-8,y:0},{x:-8,y:FT_Y}]),
  courtLine([{x:8,y:0},{x:8,y:FT_Y}]),
  // Free-throw line
  courtLine([{x:-8,y:FT_Y},{x:8,y:FT_Y}]),
  // FT circle top — solid, faces court
  courtLine(arcPts(BX, FT_Y, 6, 0, Math.PI)),
  // FT circle bottom — dashed, inside key
  courtLine(arcPts(BX, FT_Y, 6, Math.PI, 2 * Math.PI), [5, 5]),
  // Three-point corner straights
  courtLine([{x:-C3X,y:0},{x:-C3X,y:C3Y}]),
  courtLine([{x:C3X,y:0},{x:C3X,y:C3Y}]),
  // Three-point arc
  courtLine(arcPts(BX, BY, TP_R, tpA0, tpA1)),
  // Restricted area arc
  courtLine(arcPts(BX, BY, 4, 0, Math.PI)),
  // Basket ring
  courtLine(arcPts(BX, BY, 0.75, 0, 2 * Math.PI, 40)),
  // Backboard
  courtLine([{x:-3,y:0.5},{x:3,y:0.5}]),
];

// --- Shot Data (350 attempts) ---------------------------------------------
// Marker radius encodes shot type: free-throw=4, 2-pointer=5.5, 3-pointer=7
const TYPE_RADIUS = { 'free-throw': 4, '2-pointer': 5.5, '3-pointer': 7 };

function genShots(n) {
  const shots = [];
  for (let i = 0; i < n; i++) {
    const z = lcg();
    let x, y, made, shot_type;
    if (z < 0.07) {
      // Free throw — clustered at FT line
      x = BX + randn(0, 0.25);
      y = FT_Y + randn(0, 0.25);
      made = lcg() < 0.78;
      shot_type = 'free-throw';
    } else if (z < 0.30) {
      // At rim / paint → 2-pointer
      const d = lcg() * 7, a = lcg() * 2 * Math.PI;
      x = BX + d * Math.cos(a);
      y = Math.max(0.3, BY + d * Math.sin(a));
      made = lcg() < 0.63;
      shot_type = '2-pointer';
    } else if (z < 0.40) {
      // Left corner 3
      x = -(C3X + lcg() * 2.5);
      y = 0.5 + lcg() * 10;
      made = lcg() < 0.39;
      shot_type = '3-pointer';
    } else if (z < 0.50) {
      // Right corner 3
      x = C3X + lcg() * 2.5;
      y = 0.5 + lcg() * 10;
      made = lcg() < 0.39;
      shot_type = '3-pointer';
    } else if (z < 0.63) {
      // Above-the-break 3
      const a = Math.PI * 0.10 + lcg() * Math.PI * 0.80;
      const d = TP_R + randn(0, 0.8);
      x = Math.max(-24.5, Math.min(24.5, BX + d * Math.cos(a)));
      y = Math.max(0.3, Math.min(32, BY + d * Math.sin(a)));
      made = lcg() < 0.35;
      shot_type = '3-pointer';
    } else {
      // Mid-range → 2-pointer
      let tries = 0, x2, y2;
      do {
        const a = Math.PI * 0.08 + lcg() * Math.PI * 0.84;
        const d = 9 + lcg() * 12;
        x2 = BX + d * Math.cos(a);
        y2 = BY + d * Math.sin(a);
        tries++;
      } while (tries < 20 && (Math.abs(x2) < 8.5 && y2 < FT_Y + 1));
      x = Math.max(-24.5, Math.min(24.5, x2));
      y = Math.max(0.3, Math.min(32, y2));
      made = lcg() < 0.43;
      shot_type = '2-pointer';
    }
    shots.push({ x: x, y: y, made: made, shot_type: shot_type });
  }
  return shots;
}

const shots = genShots(350);
const madeShots    = shots.filter(function(s) { return  s.made; });
const missedShots  = shots.filter(function(s) { return !s.made; });
const madeData     = madeShots.map(function(s) { return { x: s.x, y: s.y }; });
const missedData   = missedShots.map(function(s) { return { x: s.x, y: s.y }; });
const madeRadius   = madeShots.map(function(s) { return TYPE_RADIUS[s.shot_type]; });
const missedRadius = missedShots.map(function(s) { return TYPE_RADIUS[s.shot_type]; });

// --- Mount ----------------------------------------------------------------
const canvas = document.createElement('canvas');
document.getElementById('container').appendChild(canvas);

// --- Chart ----------------------------------------------------------------
new Chart(canvas, {
  type: 'scatter',
  data: {
    datasets: courtDatasets.concat([
      {
        label: 'Made',
        data: madeData,
        backgroundColor: t.palette[0] + 'cc',
        borderColor: t.palette[0],
        borderWidth: 1,
        pointRadius: madeRadius,
        pointHoverRadius: madeRadius,
        pointStyle: 'circle',
        order: 1,
      },
      {
        label: 'Missed',
        data: missedData,
        backgroundColor: 'transparent',
        borderColor: t.palette[4],
        borderWidth: 2,
        pointRadius: missedRadius,
        pointHoverRadius: missedRadius,
        pointStyle: 'crossRot',
        order: 2,
      },
    ]),
  },
  options: {
    responsive: true,
    maintainAspectRatio: false,
    animation: false,
    plugins: {
      title: {
        display: true,
        text: 'scatter-shot-chart · javascript · chartjs · anyplot.ai',
        color: t.ink,
        font: { size: 22, weight: '500' },
        padding: { top: 12, bottom: 8 },
      },
      legend: {
        display: true,
        labels: {
          color: t.ink,
          font: { size: 16 },
          usePointStyle: true,
          filter: function(item) { return item.datasetIndex >= courtDatasets.length; },
        },
      },
    },
    scales: {
      x: {
        type: 'linear',
        min: -27,
        max: 27,
        display: false,
        grid: { display: false },
      },
      y: {
        type: 'linear',
        min: -2,
        max: 34,
        display: false,
        grid: { display: false },
      },
    },
    layout: {
      padding: { top: 10, bottom: 20, left: 20, right: 20 },
    },
  },
  plugins: [{
    id: 'background',
    beforeDraw: function(chart) {
      const ctx = chart.ctx;
      ctx.save();
      ctx.fillStyle = t.pageBg;
      ctx.fillRect(0, 0, chart.width, chart.height);
      ctx.restore();
    },
  }],
});
Runnable source as JSON, for any HTTP client: https://api.anyplot.ai/specs/scatter-shot-chart/chartjs/code. Any spec id and library id listed in llms-full.txt fit the same URL shape; every URL below is complete and callable.
{
  "spec_id": "scatter-shot-chart",
  "language": "javascript",
  "library": "chartjs",
  "page": "https://anyplot.ai/scatter-shot-chart/javascript/chartjs",
  "hub": "https://anyplot.ai/scatter-shot-chart",
  "code_json": "https://api.anyplot.ai/specs/scatter-shot-chart/chartjs/code",
  "spec_json": "https://api.anyplot.ai/specs/scatter-shot-chart",
  "render_light_png": "https://storage.googleapis.com/anyplot-images/plots/scatter-shot-chart/javascript/chartjs/plot-light.png",
  "render_dark_png": "https://storage.googleapis.com/anyplot-images/plots/scatter-shot-chart/javascript/chartjs/plot-dark.png",
  "interactive_light_html": "https://storage.googleapis.com/anyplot-images/plots/scatter-shot-chart/javascript/chartjs/plot-light.html",
  "interactive_dark_html": "https://storage.googleapis.com/anyplot-images/plots/scatter-shot-chart/javascript/chartjs/plot-dark.html",
  "quality_score": 87.0,
  "license": "MIT",
  "guide": "https://anyplot.ai/llms.txt"
}
Part of Basketball Shot Chart on anyplot.ai.