The same plot in 14 other libraries — JavaScript: Chart.js, Apache ECharts, Highcharts, MUI X Charts; Python: Altair, Bokeh, lets-plot, Matplotlib, Plotly, plotnine, Pygal, Seaborn; R: ggplot2; Julia: Makie.jl. Compare all 15 side by side: Basketball Shot Chart in Python, R, Julia and JavaScript.
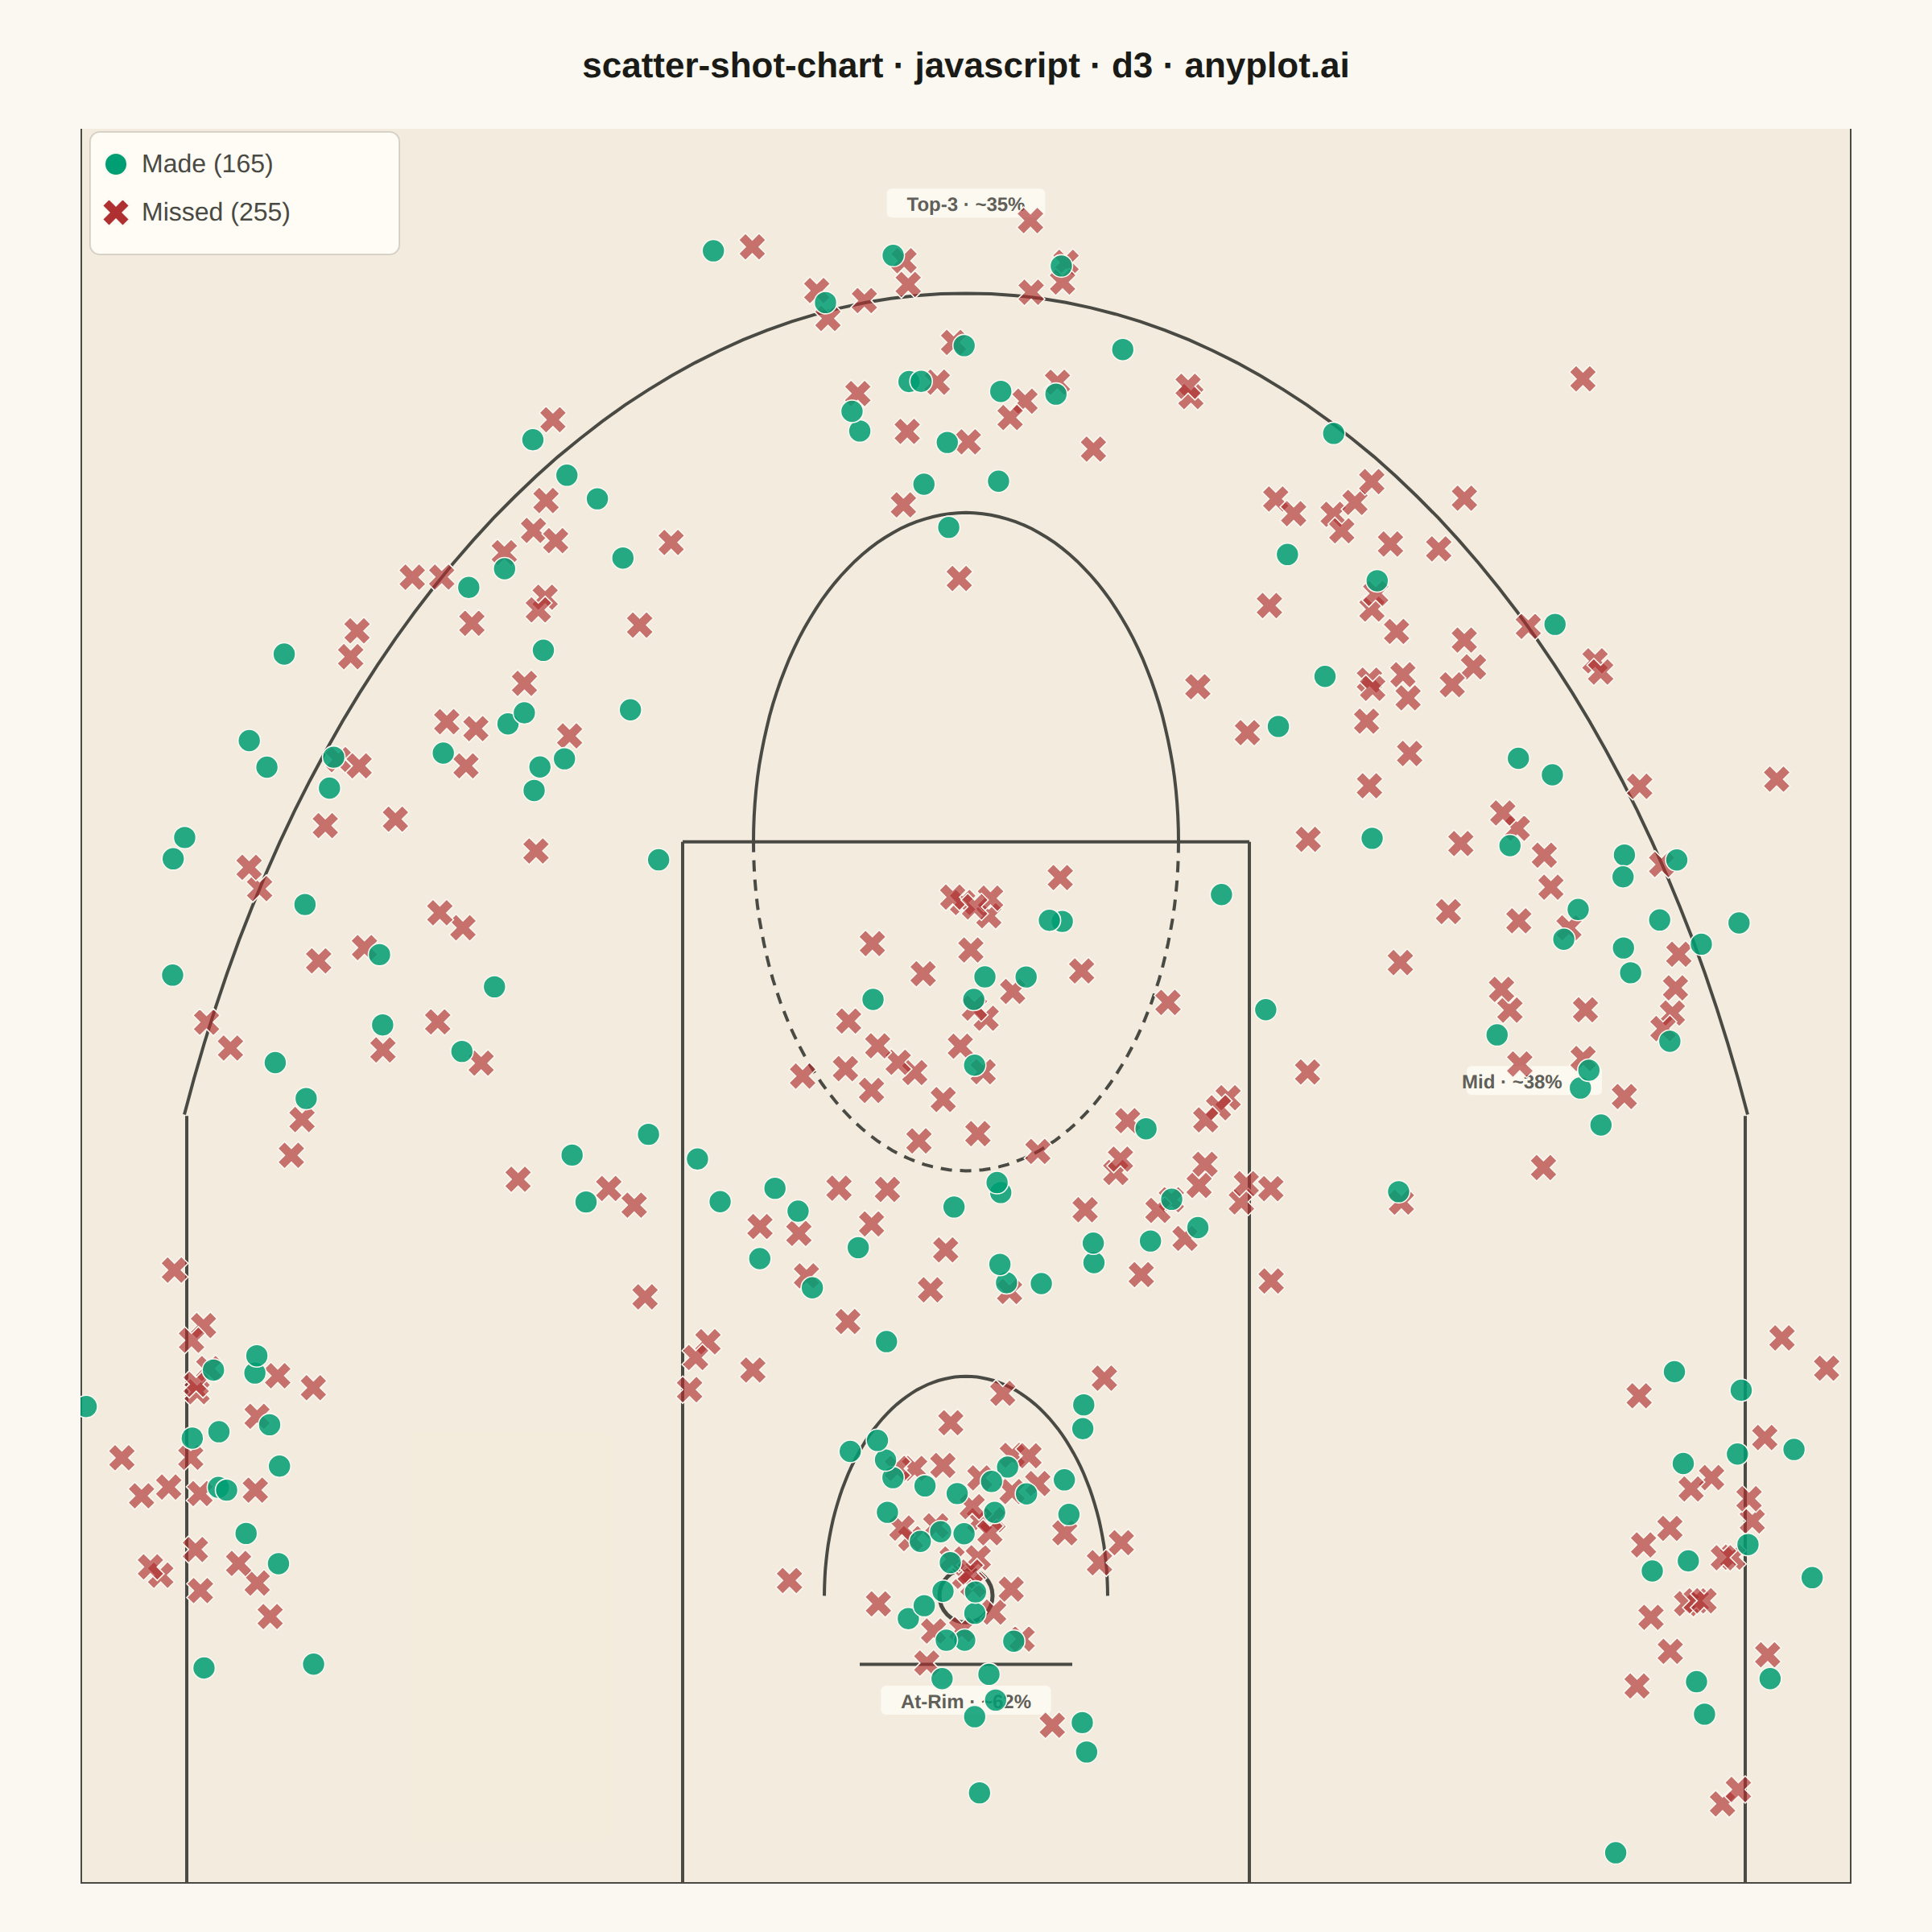
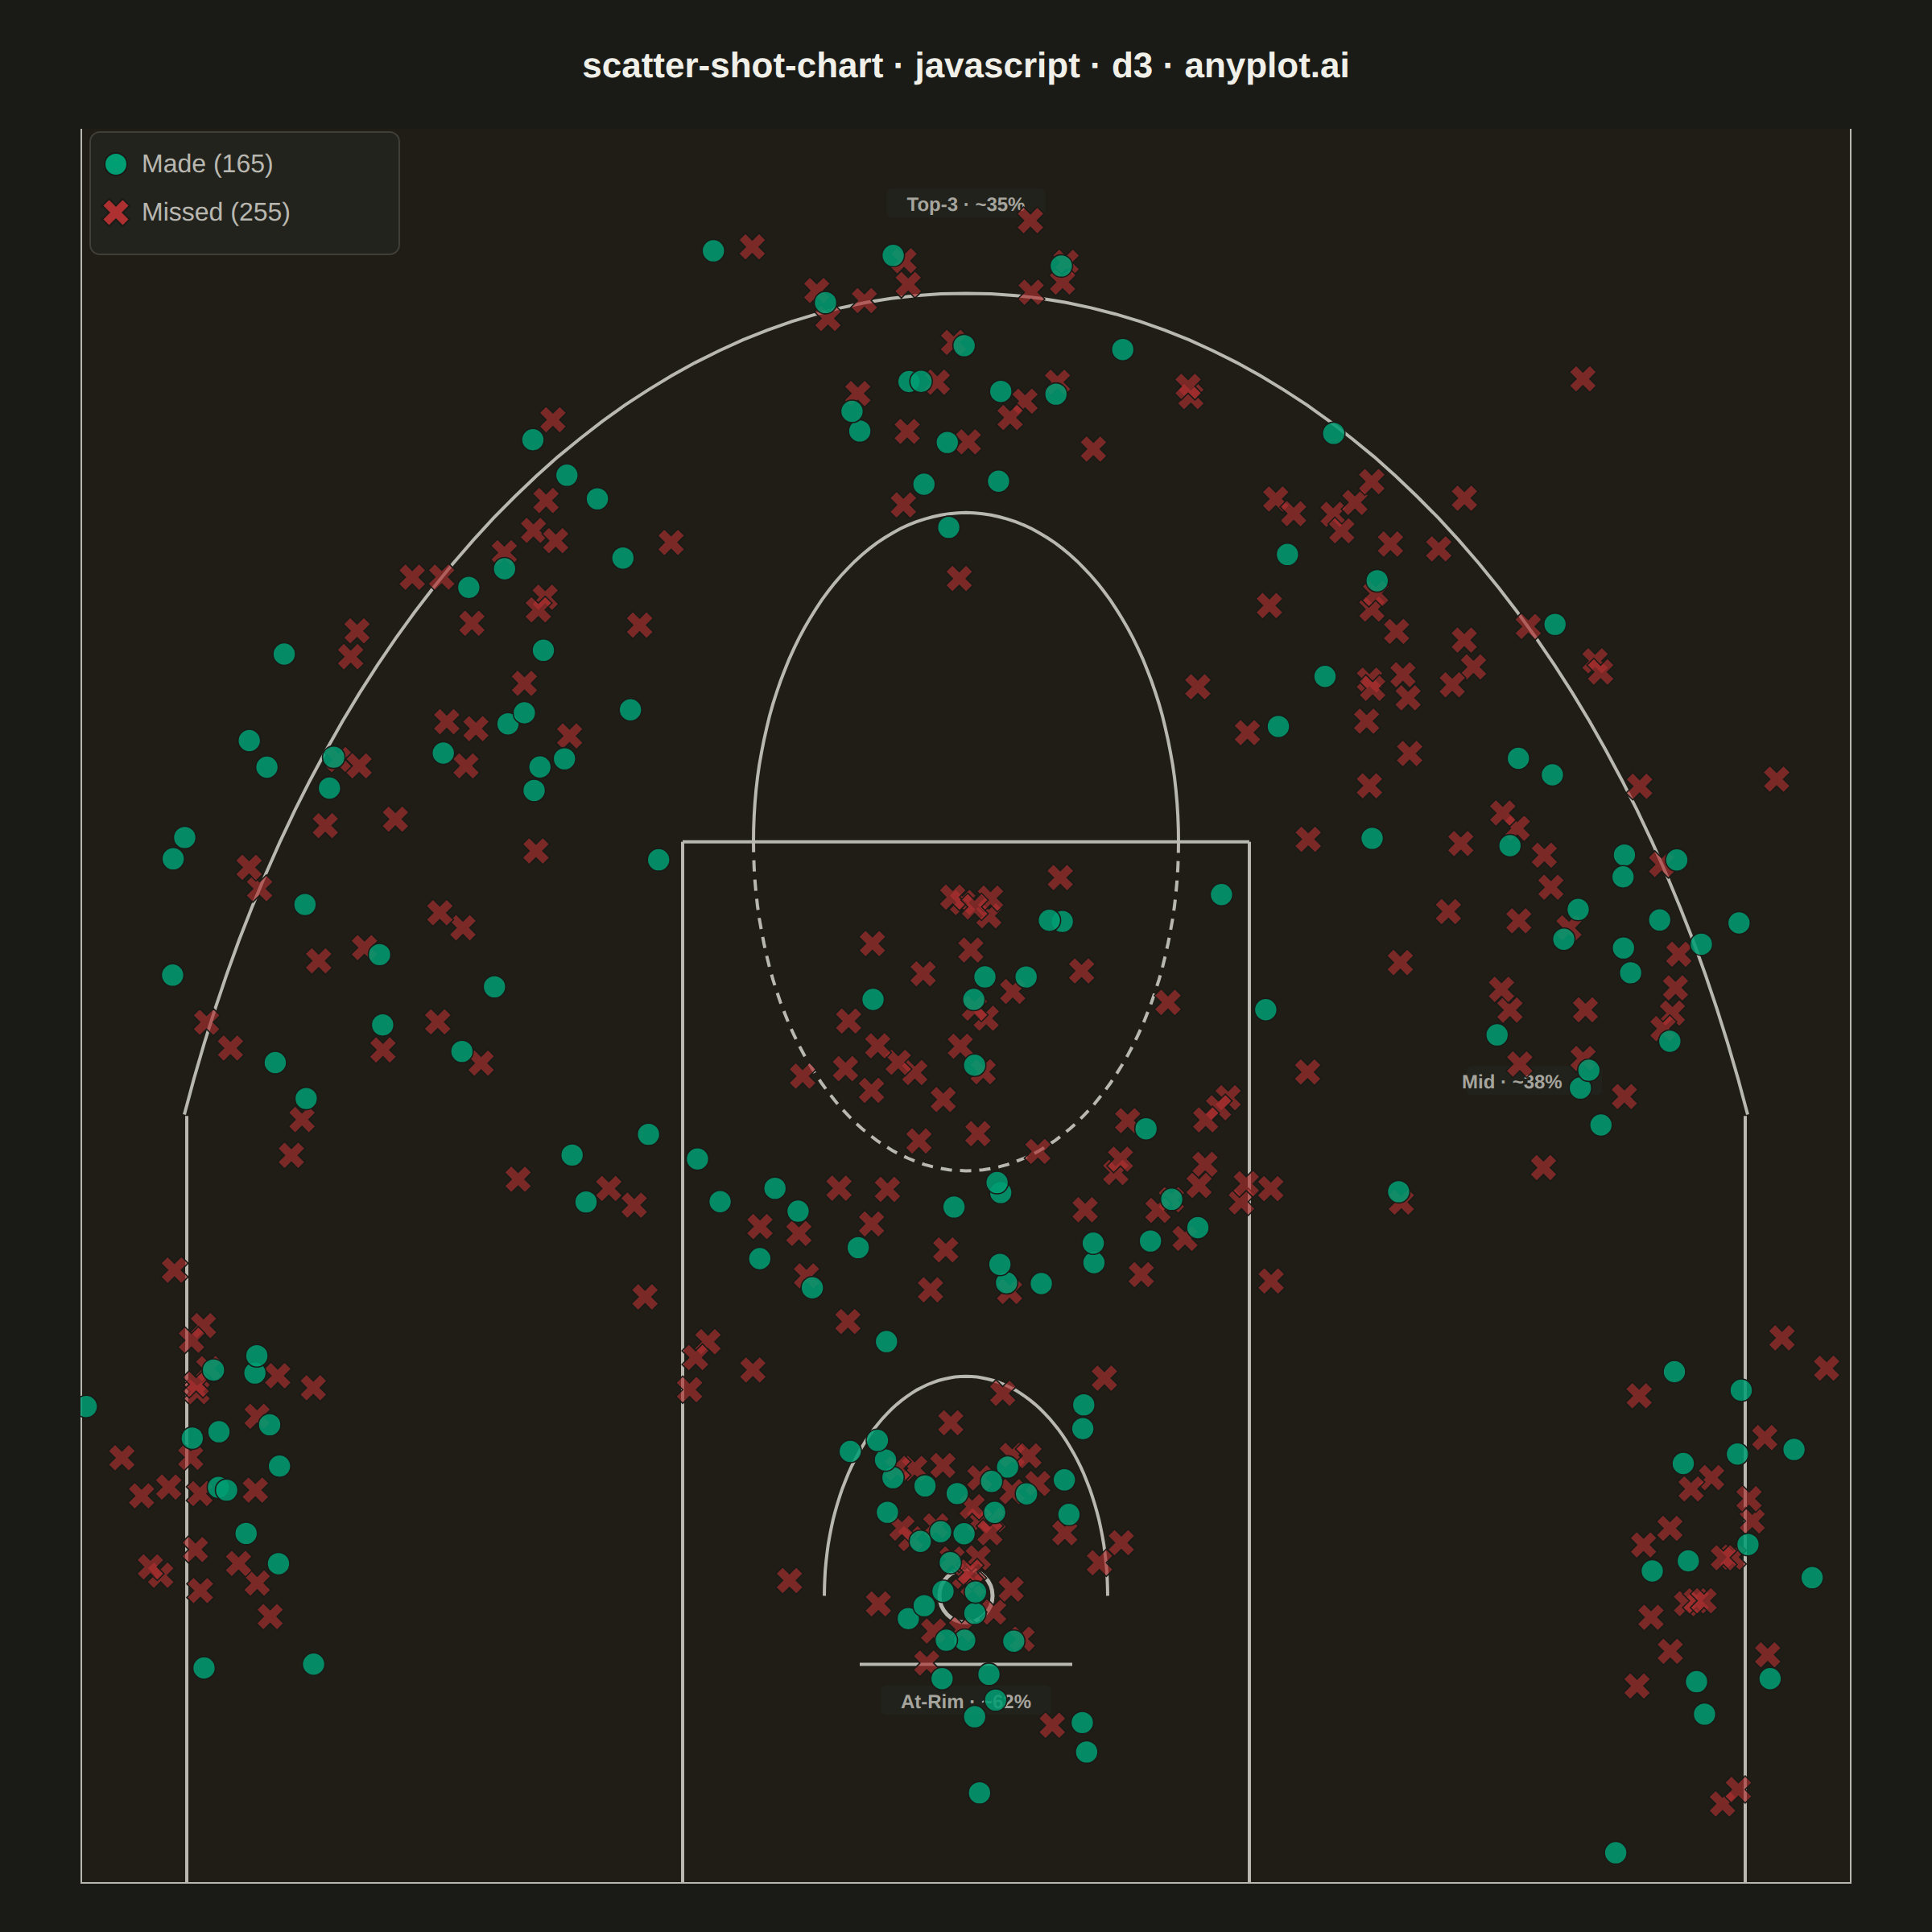
A basketball shot chart overlays shooting data on a half-court diagram, plotting each shot attempt as a point colored by outcome (made or missed). The court drawing includes the three-point arc, free-throw line, paint/key area, and basket, providing spatial context for analyzing shooting patterns and efficiency. Essential for basketball analytics and player evaluation.
// anyplot.ai
// scatter-shot-chart: Basketball Shot Chart
// Library: d3 7.9.0 | JavaScript 22.22.3
// Quality: 89/100 | Created: 2026-06-21
//# anyplot-orientation: square

const t = window.ANYPLOT_TOKENS;
const THEME = window.ANYPLOT_THEME;
const { width, height } = window.ANYPLOT_SIZE;

// Imprint palette: made = brand green (pos 1), missed = matte red (semantic anchor for loss/error)
const COLOR_MADE   = t.palette[0];  // #009E73
const COLOR_MISSED = t.palette[4];  // #AE3030

// Deterministic LCG — browser has no seeded Math.random
function makeLcg(seed) {
  let s = seed >>> 0;
  return () => { s = (Math.imul(s, 1664525) + 1013904223) >>> 0; return s / 4294967296; };
}
const rng = makeLcg(42);

function bm() {
  const u1 = Math.max(rng(), 1e-9), u2 = rng();
  const mag = Math.sqrt(-2 * Math.log(u1));
  return [mag * Math.cos(2 * Math.PI * u2), mag * Math.sin(2 * Math.PI * u2)];
}

// Shot clusters [cx, cy, spreadX, spreadY, madeRate, weight]
// x = horizontal from court center, y = distance from baseline (ft); basket at (0, 5.25)
const CLUSTERS = [
  [0,    5.5,  1.8, 1.5, 0.62, 0.12],  // at-rim
  [0,   16.0,  2.0, 1.5, 0.38, 0.07],  // mid-range top
  [-7,  13.0,  2.5, 2.0, 0.37, 0.07],  // left mid
  [7,   13.0,  2.5, 2.0, 0.37, 0.07],  // right mid
  [-21,  6.5,  1.5, 2.5, 0.38, 0.09],  // left corner 3
  [21,   6.5,  1.5, 2.5, 0.38, 0.09],  // right corner 3
  [-18, 18.0,  2.5, 2.5, 0.34, 0.10],  // left wing 3
  [18,  18.0,  2.5, 2.5, 0.34, 0.10],  // right wing 3
  [0,   28.0,  2.5, 1.5, 0.35, 0.10],  // top of 3-point arc
  [-12, 23.0,  2.5, 2.0, 0.33, 0.10],  // left 3
  [12,  23.0,  2.5, 2.0, 0.33, 0.10],  // right 3
  [0,    9.5,  3.5, 2.5, 0.40, 0.09],  // paint
];
const W_SUM = CLUSTERS.reduce((a, c) => a + c[5], 0);

const shots = [];
for (let i = 0; i < 420; i++) {
  let pick = rng() * W_SUM, ci = 0, acc = 0;
  for (let j = 0; j < CLUSTERS.length; j++) {
    acc += CLUSTERS[j][5];
    if (pick <= acc) { ci = j; break; }
  }
  const [cx, cy, spx, spy, madeRate] = CLUSTERS[ci];
  const [z0, z1] = bm();
  const sx = cx + spx * z0;
  const sy = cy + spy * z1;
  if (sx < -25 || sx > 25 || sy < 0 || sy > 47) continue;
  shots.push({ x: sx, y: sy, made: rng() < madeRate });
}

// Layout
const margin = { top: 80, right: 50, bottom: 30, left: 50 };
const iw = width - margin.left - margin.right;
const ih = height - margin.top - margin.bottom;

const BKST_X = 0, BKST_Y = 5.25;

const xSc = d3.scaleLinear().domain([-25, 25]).range([0, iw]);
// Crop to [0, 32] — removes dead upper-court area; 3-pt arc peaks at ~29ft
const ySc = d3.scaleLinear().domain([0, 32]).range([ih, 0]);

const svg = d3.select("#container").append("svg")
  .attr("width", width).attr("height", height);

// ClipPath keeps court elements within the plot rectangle
svg.append("defs").append("clipPath")
  .attr("id", "plotClip")
  .append("rect").attr("width", iw).attr("height", ih);

const g = svg.append("g")
  .attr("transform", `translate(${margin.left},${margin.top})`)
  .attr("clip-path", "url(#plotClip)");

// Court floor tint
const floorColor = THEME === "dark" ? "#3A2B12" : "#D4B483";
g.append("rect")
  .attr("x", 0).attr("y", 0).attr("width", iw).attr("height", ih)
  .attr("fill", floorColor).attr("fill-opacity", 0.18);

// Arc path helper: math-coord angles (y-axis flip handled by ySc)
function aPath(cx, cy, r, a0, a1, steps = 80) {
  return Array.from({ length: steps + 1 }, (_, i) => {
    const a = a0 + (a1 - a0) * i / steps;
    return `${i ? "L" : "M"}${xSc(cx + r * Math.cos(a)).toFixed(1)},${ySc(cy + r * Math.sin(a)).toFixed(1)}`;
  }).join("");
}

const LC = t.inkSoft;
const LW = 2;

function cLine(x1, y1, x2, y2) {
  g.append("line")
    .attr("x1", xSc(x1)).attr("y1", ySc(y1))
    .attr("x2", xSc(x2)).attr("y2", ySc(y2))
    .attr("stroke", LC).attr("stroke-width", LW);
}

// Court boundary — sidelines extend to y=47 but are clipped at y=32
cLine(-25, 0, 25, 0);
cLine(-25, 0, -25, 47);
cLine(25, 0, 25, 47);

// Paint / key
cLine(-8, 0, -8, 19);
cLine(8, 0, 8, 19);
cLine(-8, 19, 8, 19);

// Free-throw circle (6 ft radius, center at y=19)
g.append("path").attr("d", aPath(0, 19, 6, Math.PI, 0))
  .attr("fill", "none").attr("stroke", LC).attr("stroke-width", LW);
g.append("path").attr("d", aPath(0, 19, 6, 0, -Math.PI))
  .attr("fill", "none").attr("stroke", LC).attr("stroke-width", LW)
  .attr("stroke-dasharray", "7,5");

// Backboard and basket
cLine(-3, 4, 3, 4);
g.append("circle")
  .attr("cx", xSc(BKST_X)).attr("cy", ySc(BKST_Y))
  .attr("r", xSc(BKST_X + 0.75) - xSc(BKST_X))
  .attr("fill", "none").attr("stroke", LC).attr("stroke-width", 2.5);

// Restricted area arc (4 ft radius)
g.append("path").attr("d", aPath(BKST_X, BKST_Y, 4, Math.PI, 0))
  .attr("fill", "none").attr("stroke", LC).attr("stroke-width", LW);

// Three-point line: straight corner segments + arc at 23.75 ft
cLine(-22, 0, -22, 14);
cLine(22, 0, 22, 14);
g.append("path")
  .attr("d", aPath(
    BKST_X, BKST_Y, 23.75,
    Math.atan2(14 - BKST_Y, -22 - BKST_X),
    Math.atan2(14 - BKST_Y,  22 - BKST_X),
  ))
  .attr("fill", "none").attr("stroke", LC).attr("stroke-width", LW);

// Zone FG% annotations — rendered before markers so shots sit on top
const ZONE_LABELS = [
  { x:  0,    y: 30.5, text: "Top-3 · ~35%",  anchor: "middle" },
  { x:  14,   y: 14.5, text: "Mid · ~38%",    anchor: "start" },
  { x:  0,    y: 3.2,  text: "At-Rim · ~62%", anchor: "middle" },
];
ZONE_LABELS.forEach(({ x, y, text, anchor }) => {
  const tx = xSc(x), ty = ySc(y);
  const approxW = text.length * 7.2 + 12;
  const bx = anchor === "middle" ? tx - approxW / 2
            : anchor === "end"   ? tx - approxW - 3
            : tx + 3;
  g.append("rect")
    .attr("x", bx).attr("y", ty - 14).attr("width", approxW).attr("height", 18)
    .attr("fill", t.elevatedBg).attr("fill-opacity", 0.72).attr("rx", 3);
  g.append("text")
    .attr("x", tx).attr("y", ty)
    .attr("text-anchor", anchor)
    .attr("fill", t.inkSoft).attr("fill-opacity", 0.90)
    .style("font-size", "12px").style("font-weight", "600")
    .text(text);
});

// CVD accessibility: missed shots rendered as X (cross rotated 45°), made as circles
// Shape + color dual encoding distinguishes outcome for color-vision-deficient viewers
const MARKER_AREA = 180;  // sq px; visually balances r=7 circle (≈154 sq px)
const crossPath = d3.symbol().type(d3.symbolCross).size(MARKER_AREA)();

const madeArr   = shots.filter(d =>  d.made);
const missedArr = shots.filter(d => !d.made);

// Missed: X shape
g.selectAll(".miss").data(missedArr).join("path")
  .attr("d", crossPath)
  .attr("transform", d => `translate(${xSc(d.x)},${ySc(d.y)}) rotate(45)`)
  .attr("fill", COLOR_MISSED).attr("fill-opacity", 0.65)
  .attr("stroke", t.pageBg).attr("stroke-width", 0.8);

// Made: circle (rendered on top)
g.selectAll(".make").data(madeArr).join("circle")
  .attr("cx", d => xSc(d.x)).attr("cy", d => ySc(d.y))
  .attr("r", 7)
  .attr("fill", COLOR_MADE).attr("fill-opacity", 0.85)
  .attr("stroke", t.pageBg).attr("stroke-width", 0.8);

// Legend — legend group is unclipped so append to svg with absolute position
const lgOffX = margin.left + 16, lgOffY = margin.top + 14;
const lgW = 192, lgH = 76;
svg.append("rect")
  .attr("x", lgOffX - 10).attr("y", lgOffY - 12)
  .attr("width", lgW).attr("height", lgH)
  .attr("fill", t.elevatedBg).attr("rx", 6).attr("fill-opacity", 0.92)
  .attr("stroke", t.grid).attr("stroke-width", 1);

const lgItems = [
  { label: `Made (${madeArr.length})`,     color: COLOR_MADE,   shape: "circle" },
  { label: `Missed (${missedArr.length})`, color: COLOR_MISSED, shape: "cross" },
];
lgItems.forEach((d, i) => {
  const lx = lgOffX + 6, ly = lgOffY + 8 + i * 30;
  if (d.shape === "circle") {
    svg.append("circle")
      .attr("cx", lx).attr("cy", ly)
      .attr("r", 7).attr("fill", d.color)
      .attr("stroke", t.pageBg).attr("stroke-width", 1);
  } else {
    svg.append("path")
      .attr("d", crossPath)
      .attr("transform", `translate(${lx},${ly}) rotate(45)`)
      .attr("fill", d.color).attr("stroke", t.pageBg).attr("stroke-width", 1);
  }
  svg.append("text")
    .attr("x", lgOffX + 22).attr("y", lgOffY + 13 + i * 30)
    .attr("fill", t.inkSoft).style("font-size", "16px")
    .text(d.label);
});

// Title
svg.append("text")
  .attr("x", width / 2).attr("y", 48)
  .attr("text-anchor", "middle")
  .attr("fill", t.ink)
  .style("font-size", "22px").style("font-weight", "600")
  .text("scatter-shot-chart · javascript · d3 · anyplot.ai");
Runnable source as JSON, for any HTTP client: https://api.anyplot.ai/specs/scatter-shot-chart/d3/code. Any spec id and library id listed in llms-full.txt fit the same URL shape; every URL below is complete and callable.
{
  "spec_id": "scatter-shot-chart",
  "language": "javascript",
  "library": "d3",
  "page": "https://anyplot.ai/scatter-shot-chart/javascript/d3",
  "hub": "https://anyplot.ai/scatter-shot-chart",
  "code_json": "https://api.anyplot.ai/specs/scatter-shot-chart/d3/code",
  "spec_json": "https://api.anyplot.ai/specs/scatter-shot-chart",
  "render_light_png": "https://storage.googleapis.com/anyplot-images/plots/scatter-shot-chart/javascript/d3/plot-light.png",
  "render_dark_png": "https://storage.googleapis.com/anyplot-images/plots/scatter-shot-chart/javascript/d3/plot-dark.png",
  "interactive_light_html": "https://storage.googleapis.com/anyplot-images/plots/scatter-shot-chart/javascript/d3/plot-light.html",
  "interactive_dark_html": "https://storage.googleapis.com/anyplot-images/plots/scatter-shot-chart/javascript/d3/plot-dark.html",
  "quality_score": 89.0,
  "license": "MIT",
  "guide": "https://anyplot.ai/llms.txt"
}
Part of Basketball Shot Chart on anyplot.ai.