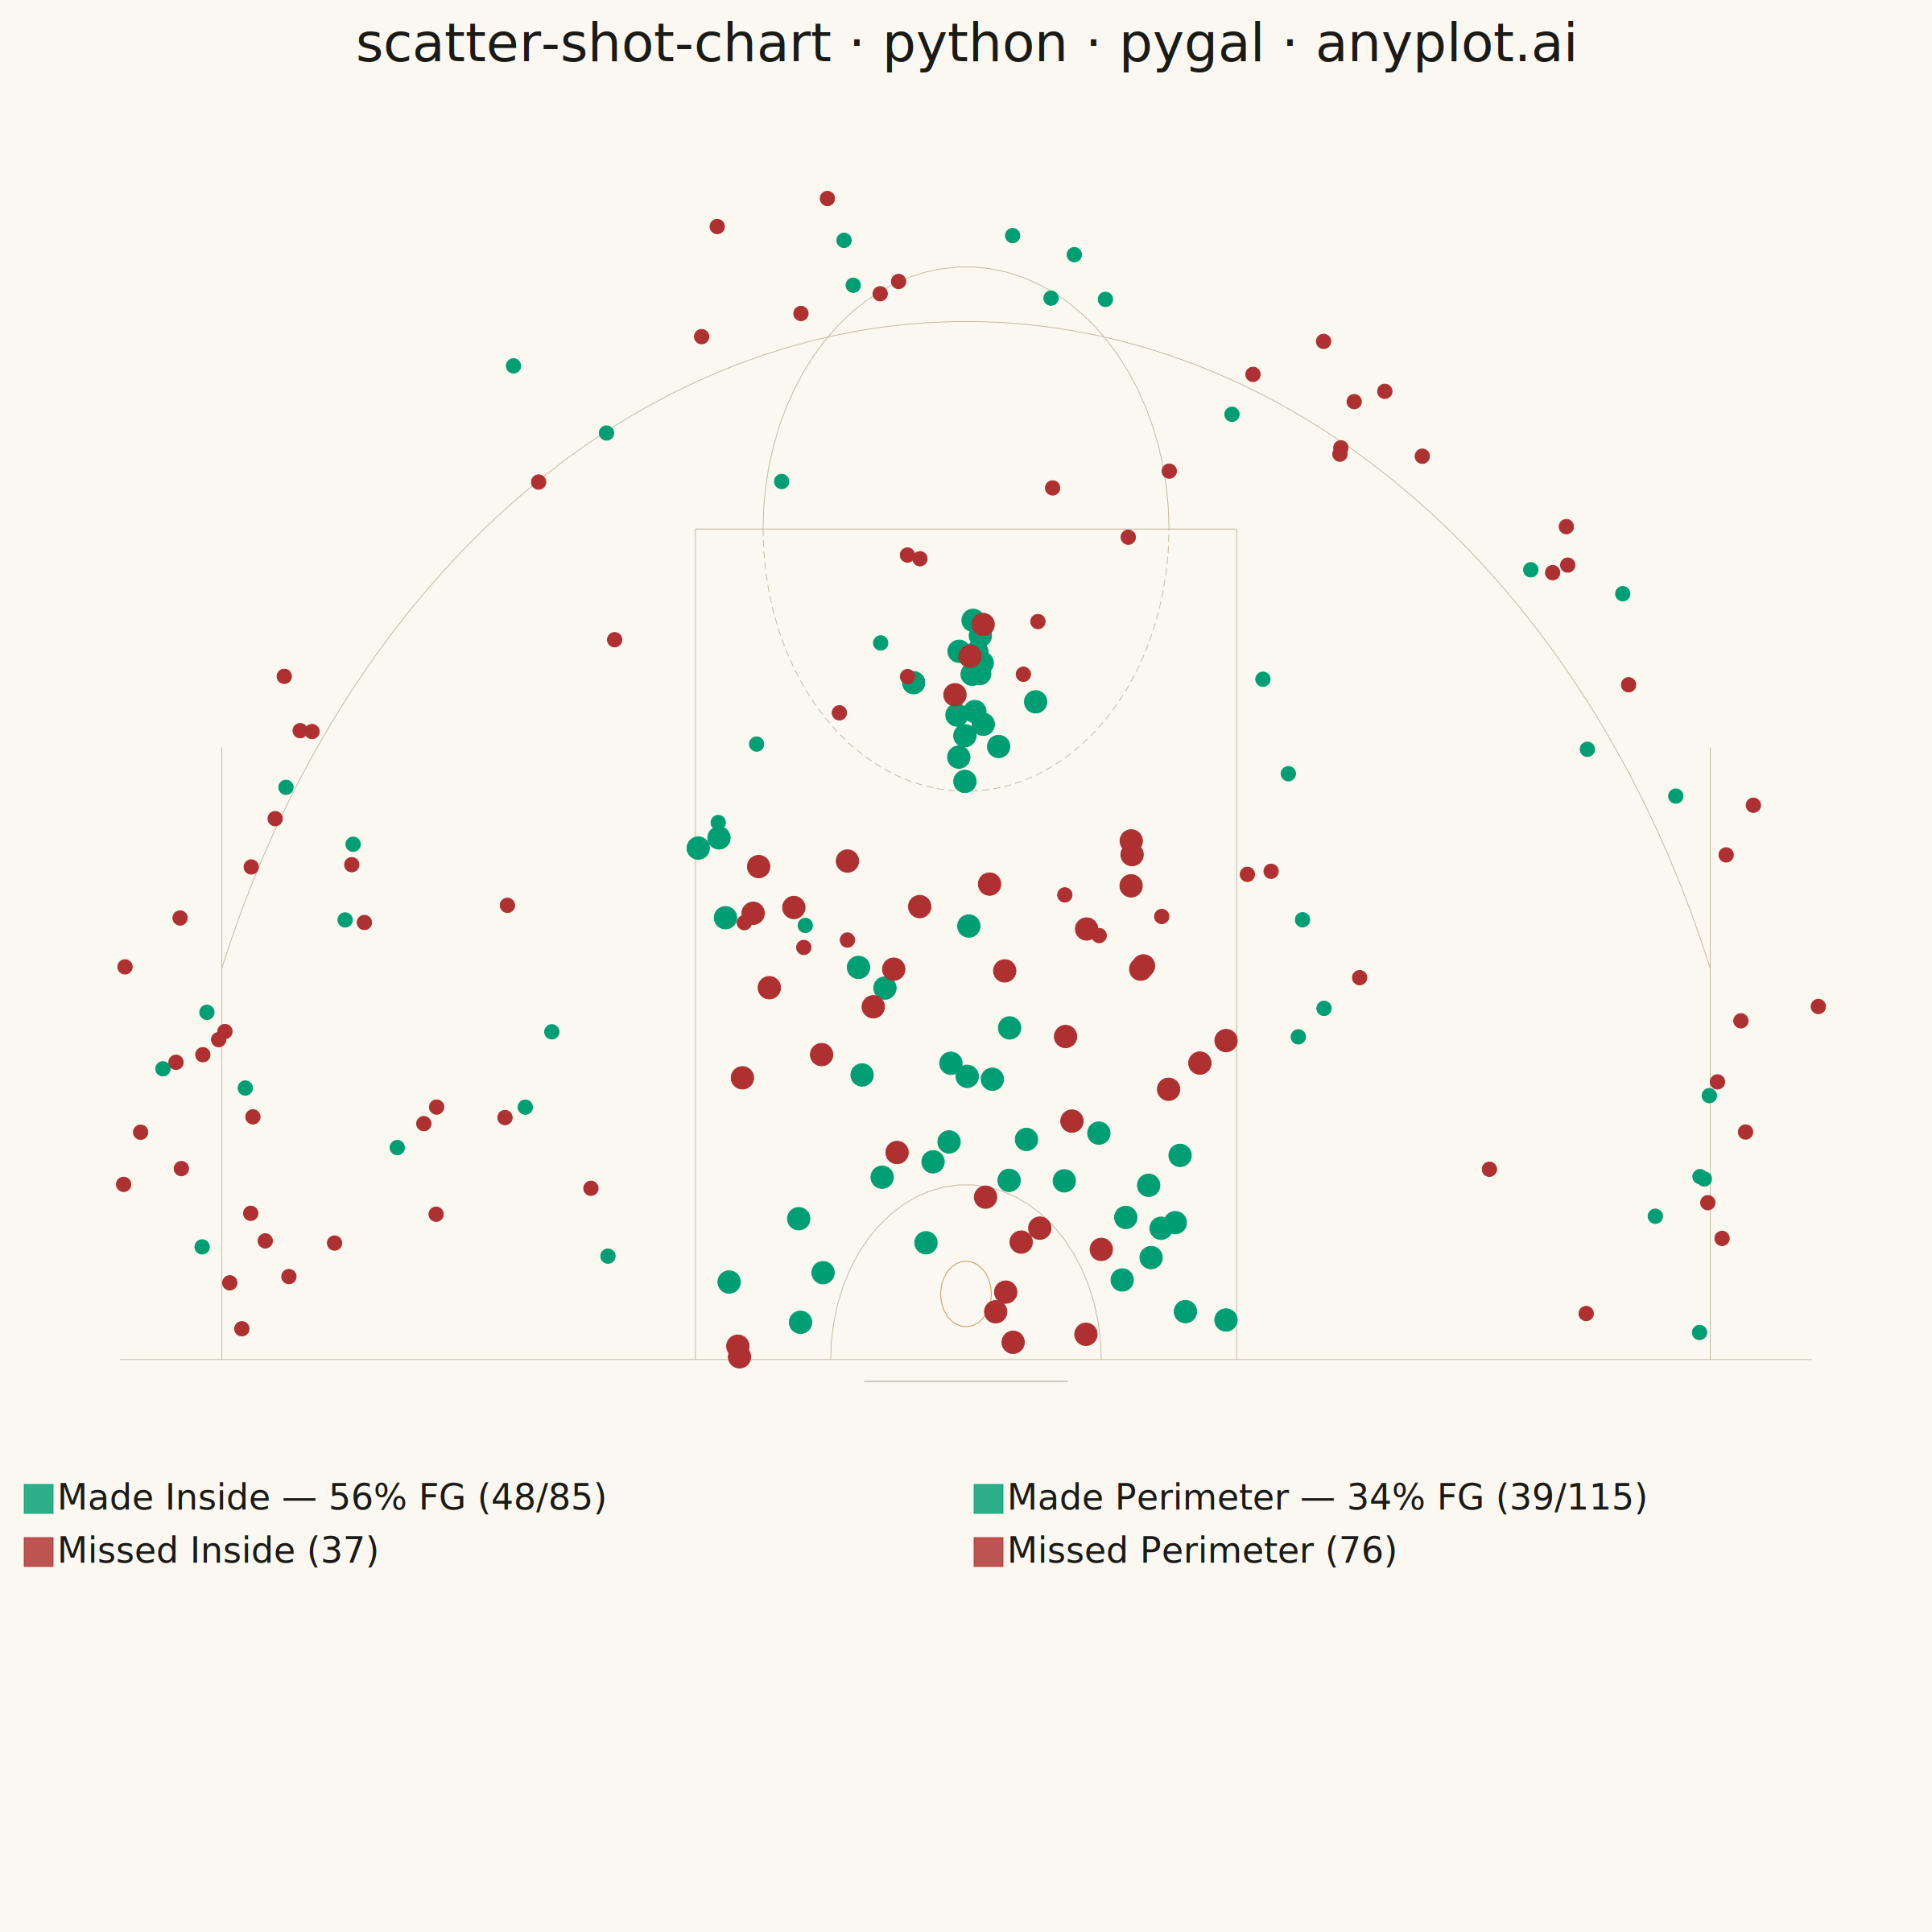
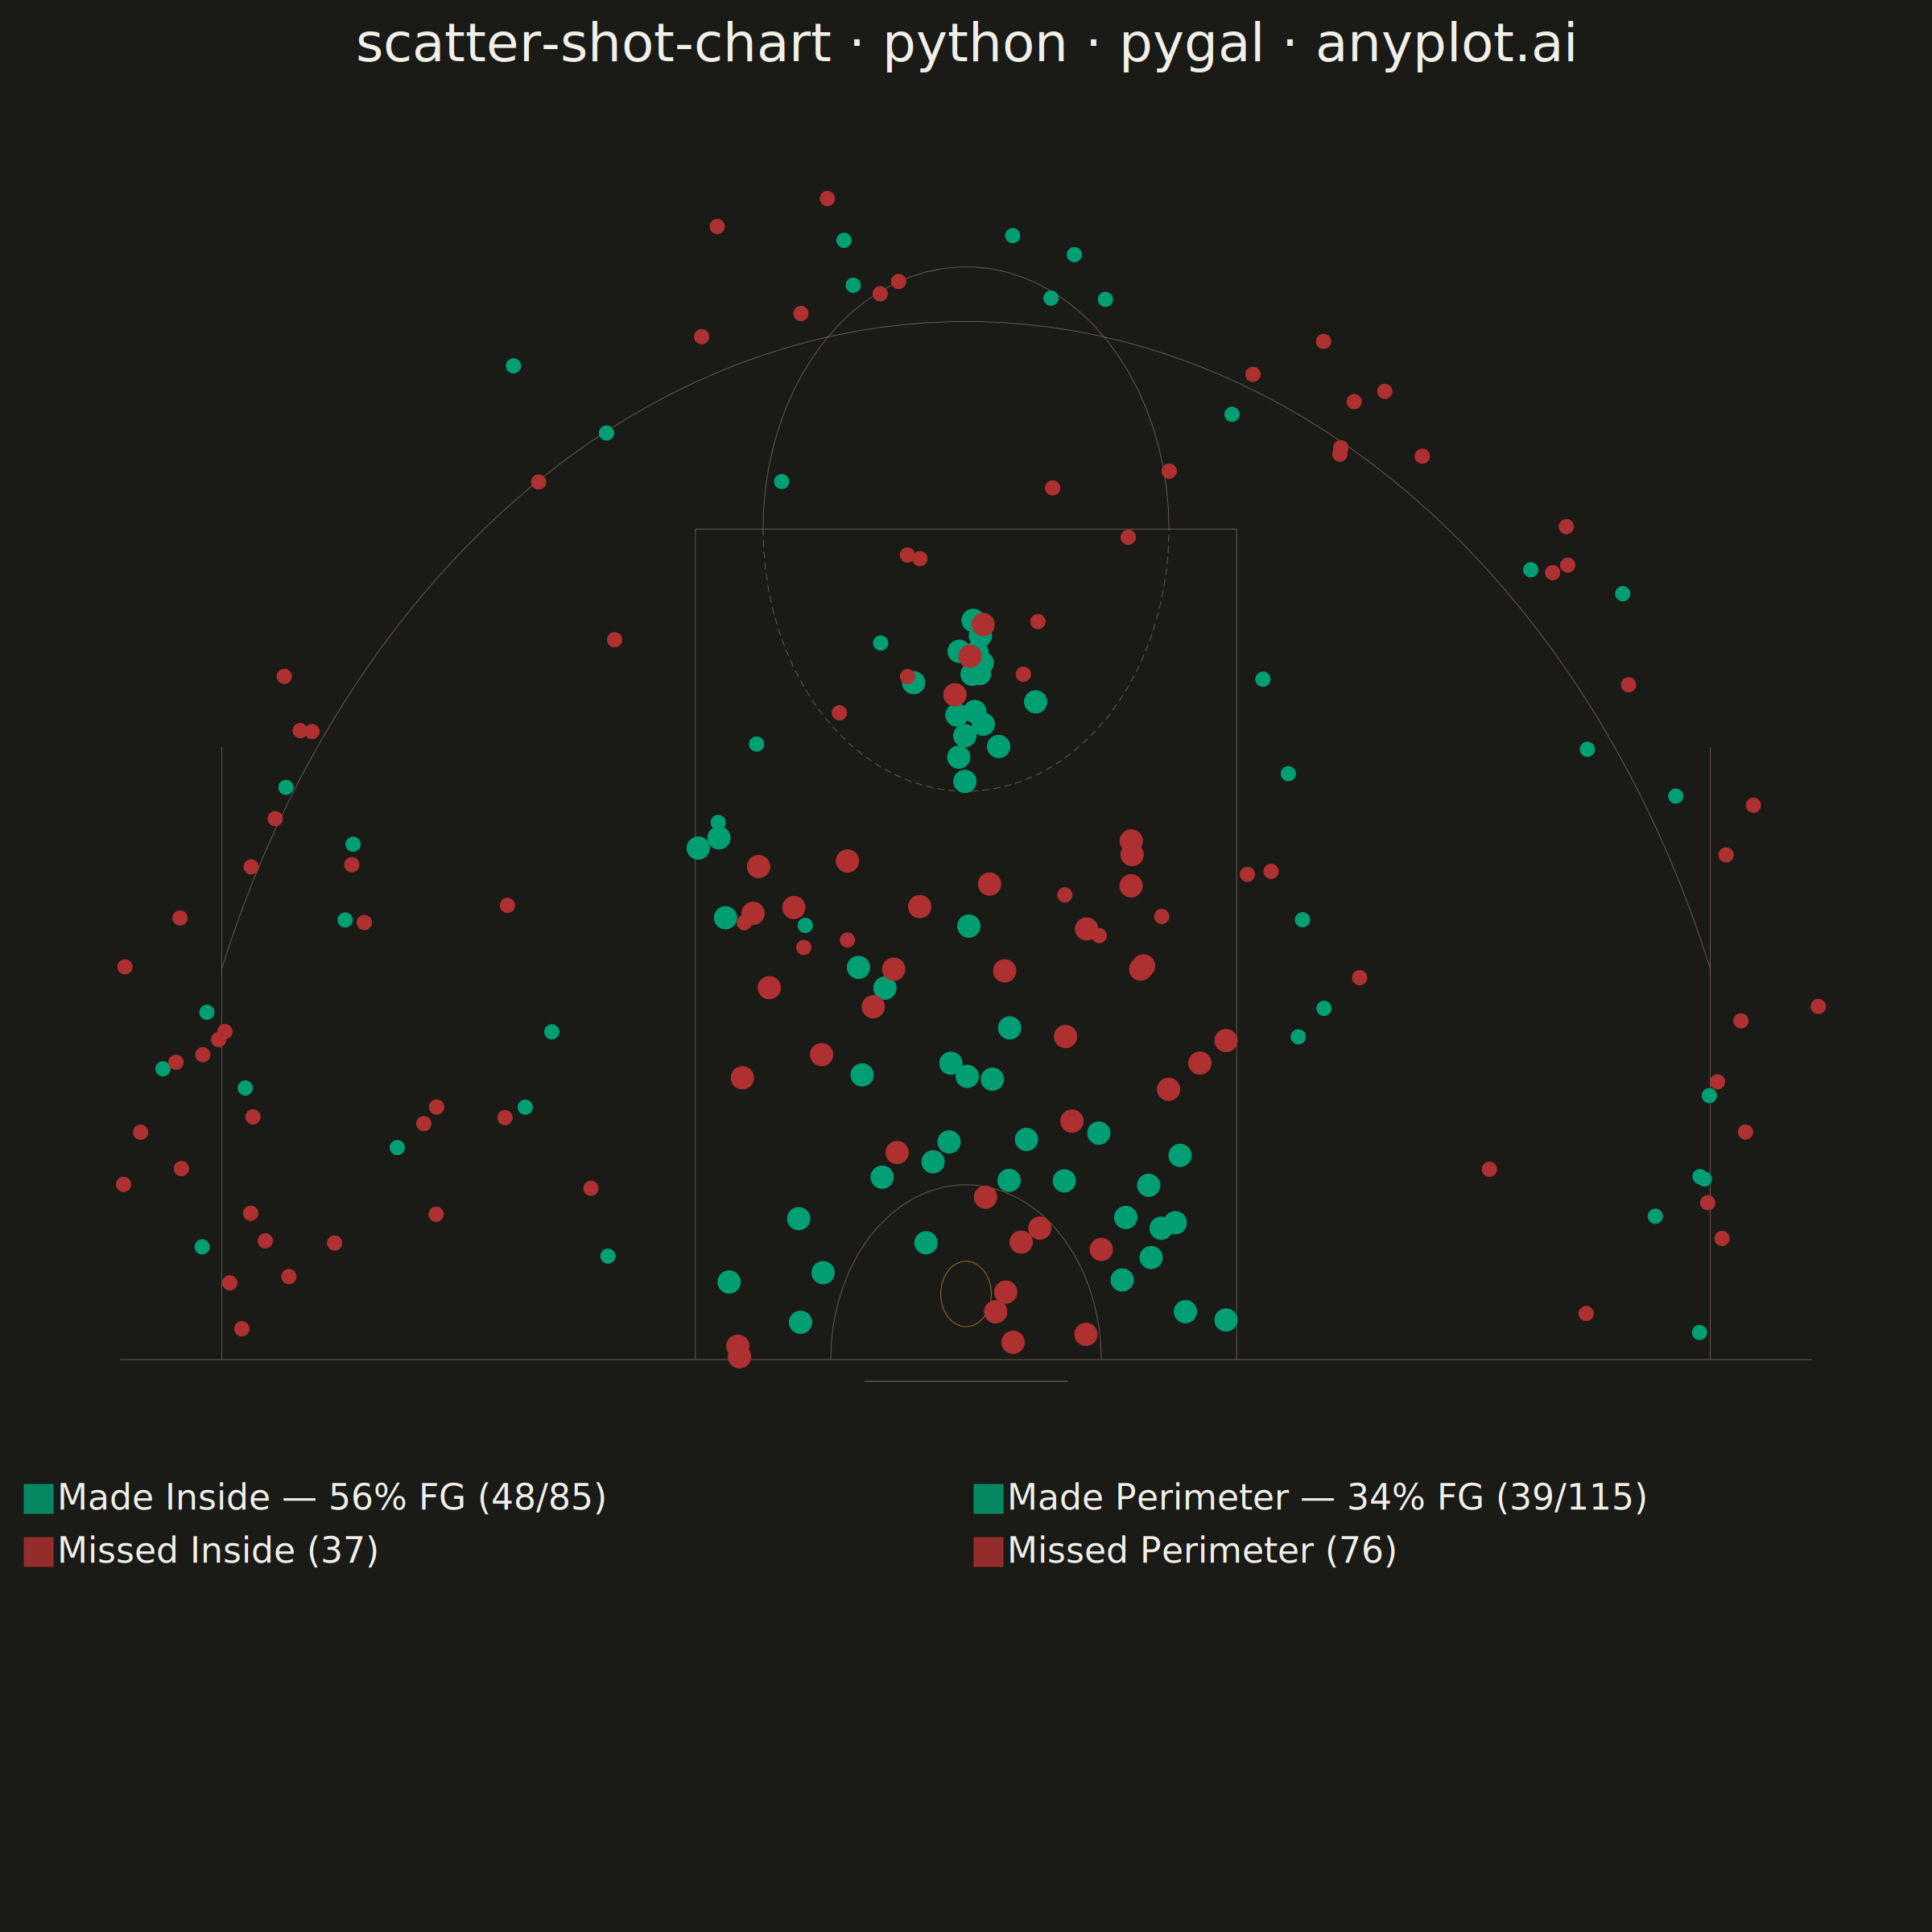
A basketball shot chart overlays shooting data on a half-court diagram, plotting each shot attempt as a point colored by outcome (made or missed). The court drawing includes the three-point arc, free-throw line, paint/key area, and basket, providing spatial context for analyzing shooting patterns and efficiency. Essential for basketball analytics and player evaluation.
""" anyplot.ai
scatter-shot-chart: Basketball Shot Chart
Library: pygal 3.1.3 | Python 3.13.14
Quality: 86/100 | Updated: 2026-06-21
"""

import math
import os

import numpy as np
import pygal
from pygal.style import Style


# Theme tokens — Imprint style guide
THEME = os.getenv("ANYPLOT_THEME", "light")
PAGE_BG = "#FAF8F1" if THEME == "light" else "#1A1A17"
INK = "#1A1A17" if THEME == "light" else "#F0EFE8"
INK_MUTED = "#6B6A63" if THEME == "light" else "#A8A79F"

# Court structural colors (non-categorical, contextual)
COURT_LINE = "#B8A990" if THEME == "light" else "#7A6A5A"
COURT_BOARD = "#8C7E6E" if THEME == "light" else "#9A8A7A"
COURT_RIM = "#BD8233"  # Imprint ochre — approximates real orange rim, visible in both themes

# Imprint palette — semantic: made = good (green), missed = error (red)
MADE_COLOR = "#009E73"  # Imprint position 1 — brand green
MISSED_COLOR = "#AE3030"  # Imprint position 5 — matte red, semantic anchor for bad/loss/error

# Data — synthetic NBA shot chart (200 attempts)
np.random.seed(42)

n_shots = 200
zones = np.random.choice(["paint", "midrange", "three", "free_throw"], n_shots, p=[0.30, 0.25, 0.35, 0.10])

x = np.zeros(n_shots)
y = np.zeros(n_shots)
made = np.zeros(n_shots, dtype=bool)
shot_type = []

for i in range(n_shots):
    if zones[i] == "paint":
        x[i] = np.random.uniform(-8, 8)
        y[i] = np.random.uniform(0, 12)
        made[i] = np.random.random() < 0.55
        shot_type.append("2-pointer")
    elif zones[i] == "midrange":
        angle = np.random.uniform(0, math.pi)
        r = np.random.uniform(10, 22)
        x[i] = r * math.cos(angle)
        y[i] = r * math.sin(angle)
        made[i] = np.random.random() < 0.40
        shot_type.append("2-pointer")
    elif zones[i] == "three":
        angle = np.random.uniform(0.15, math.pi - 0.15)
        r = np.random.uniform(23, 27)
        x[i] = r * math.cos(angle)
        y[i] = r * math.sin(angle)
        # Corner threes
        if np.random.random() < 0.25:
            x[i] = np.random.choice([-22, 22]) + np.random.normal(0, 0.5)
            y[i] = np.random.uniform(0, 8)
        made[i] = np.random.random() < 0.36
        shot_type.append("3-pointer")
    else:
        x[i] = np.random.normal(0, 0.8)
        y[i] = 15 + np.random.normal(0, 0.8)
        made[i] = np.random.random() < 0.80
        shot_type.append("free-throw")

# Court geometry — NBA half-court (origin at basket center)
# Three-point arc: 23.75 ft radius, 22 ft corner lines to ~14 ft out
three_pt_angles = np.linspace(math.acos(22.0 / 23.75), math.pi - math.acos(22.0 / 23.75), 80)
three_pt_arc = [(23.75 * math.cos(a), 23.75 * math.sin(a)) for a in three_pt_angles]
three_pt_left_corner = [(-22, 0), (-22, 14)]
three_pt_right_corner = [(22, 0), (22, 14)]

# Paint / key area: 16 ft wide, 19 ft deep (to free-throw line)
paint = [(-8, 0), (-8, 19), (8, 19), (8, 0)]

# Free-throw circle: 6 ft radius centered at free-throw line (top half solid, bottom dashed)
ft_circle_angles = np.linspace(0, math.pi, 40)
ft_circle_top = [(6 * math.cos(a), 19 + 6 * math.sin(a)) for a in ft_circle_angles]
ft_circle_bottom_angles = np.linspace(math.pi, 2 * math.pi, 40)
ft_circle_bottom = [(6 * math.cos(a), 19 + 6 * math.sin(a)) for a in ft_circle_bottom_angles]

# Restricted area arc: 4 ft radius
restricted_angles = np.linspace(0, math.pi, 30)
restricted_arc = [(4 * math.cos(a), 4 * math.sin(a)) for a in restricted_angles]

# Backboard and rim
backboard = [(-3, -0.5), (3, -0.5)]
rim_angles = np.linspace(0, 2 * math.pi, 30)
rim = [(0.75 * math.cos(a), 1.5 + 0.75 * math.sin(a)) for a in rim_angles]

baseline = [(-25, 0), (25, 0)]

# FG% statistics by zone for legend labels
paint_ft_mask = np.array([z in ("paint", "free_throw") for z in zones])
perim_mask = ~paint_ft_mask
n_inside = int(np.sum(paint_ft_mask))
n_perim = int(np.sum(perim_mask))
inside_fg = np.sum(made[paint_ft_mask]) / n_inside * 100
perim_fg = np.sum(made[perim_mask]) / n_perim * 100

# Style — colors tuple covers court lines (1–10) + shot series (11–14)
# Court lines are structural/contextual, not categorical data
font = "DejaVu Sans, Helvetica, Arial, sans-serif"
custom_style = Style(
    background=PAGE_BG,
    plot_background=PAGE_BG,
    foreground=INK,
    foreground_strong=INK,
    foreground_subtle=INK_MUTED,
    guide_stroke_color=PAGE_BG,  # guides off, colour matches bg for safety
    colors=(
        COURT_LINE,  # 1: baseline
        COURT_LINE,  # 2: three-point arc
        COURT_LINE,  # 3: corner left
        COURT_LINE,  # 4: corner right
        COURT_LINE,  # 5: paint rectangle
        COURT_LINE,  # 6: free-throw circle top
        COURT_LINE,  # 7: free-throw circle bottom (dashed)
        COURT_LINE,  # 8: restricted arc
        COURT_BOARD,  # 9: backboard (darker)
        COURT_RIM,  # 10: rim (Imprint ochre ≈ real orange)
        MADE_COLOR,  # 11: Made Inside — Imprint green, large markers
        MADE_COLOR,  # 12: Made Perimeter — Imprint green, smaller markers
        MISSED_COLOR,  # 13: Missed Inside — Imprint red, large markers
        MISSED_COLOR,  # 14: Missed Perimeter — Imprint red, smaller markers
    ),
    font_family=font,
    title_font_family=font,
    title_font_size=66,
    label_font_size=56,
    major_label_font_size=44,
    legend_font_size=44,
    legend_font_family=font,
    value_font_size=36,
    tooltip_font_size=30,
    tooltip_font_family=font,
    opacity=0.82,
    opacity_hover=1.0,
)

title = "scatter-shot-chart · python · pygal · anyplot.ai"

# Chart — 2400×2400 square for 1:1 court aspect ratio
chart = pygal.XY(
    width=2400,
    height=2400,
    style=custom_style,
    title=title,
    show_legend=True,
    legend_at_bottom=True,
    legend_at_bottom_columns=2,
    legend_box_size=36,
    stroke=True,
    dots_size=0,
    show_x_guides=False,
    show_y_guides=False,
    show_x_labels=False,
    show_y_labels=False,
    xrange=(-27, 27),
    range=(-2, 28),
    margin_bottom=120,
    margin_left=20,
    margin_right=20,
    margin_top=60,
    print_values=False,
    print_zeroes=False,
    tooltip_border_radius=8,
    tooltip_fancy_mode=True,
    truncate_legend=-1,
    value_formatter=lambda val: f"{val:.1f} ft",
    js=[],
)

# Court markings — drawn as stroke series (no dots)
line_style = {"width": 3, "linecap": "round", "linejoin": "round"}
thin_style = {"width": 2.5, "linecap": "round", "linejoin": "round"}

chart.add(None, baseline, stroke=True, show_dots=False, stroke_style={"width": 3.5, "linecap": "round"})
chart.add(None, three_pt_arc, stroke=True, show_dots=False, stroke_style=line_style)
chart.add(None, three_pt_left_corner, stroke=True, show_dots=False, stroke_style=line_style)
chart.add(None, three_pt_right_corner, stroke=True, show_dots=False, stroke_style=line_style)
chart.add(None, paint, stroke=True, show_dots=False, stroke_style=line_style)
chart.add(None, ft_circle_top, stroke=True, show_dots=False, stroke_style=thin_style)
chart.add(
    None,
    ft_circle_bottom,
    stroke=True,
    show_dots=False,
    stroke_style={"width": 2.5, "linecap": "round", "dasharray": "8,6"},
)
chart.add(None, restricted_arc, stroke=True, show_dots=False, stroke_style=thin_style)
chart.add(None, backboard, stroke=True, show_dots=False, stroke_style={"width": 5, "linecap": "round"})
chart.add(None, rim, stroke=True, show_dots=False, stroke_style={"width": 3, "linecap": "round"})

# Shot data — 4 series preserve zone-specific FG% in legend
# Inside shots: larger markers (paint / free-throw zone)
# Perimeter shots: smaller markers (mid-range / three-point)
made_inside = [
    {"value": (float(x[i]), float(y[i])), "label": f"{shot_type[i]} ({zones[i]}) — Made", "node": {"r": 14}}
    for i in range(n_shots)
    if made[i] and zones[i] in ("paint", "free_throw")
]
made_outside = [
    {"value": (float(x[i]), float(y[i])), "label": f"{shot_type[i]} ({zones[i]}) — Made", "node": {"r": 9}}
    for i in range(n_shots)
    if made[i] and zones[i] in ("midrange", "three")
]
missed_inside = [
    {"value": (float(x[i]), float(y[i])), "label": f"{shot_type[i]} ({zones[i]}) — Missed", "node": {"r": 14}}
    for i in range(n_shots)
    if not made[i] and zones[i] in ("paint", "free_throw")
]
missed_outside = [
    {"value": (float(x[i]), float(y[i])), "label": f"{shot_type[i]} ({zones[i]}) — Missed", "node": {"r": 9}}
    for i in range(n_shots)
    if not made[i] and zones[i] in ("midrange", "three")
]

chart.add(
    f"Made Inside — {inside_fg:.0f}% FG ({len(made_inside)}/{n_inside})",
    made_inside,
    stroke=False,
    dots_size=15,
    formatter=lambda val: f"({val[0]:.1f}, {val[1]:.1f}) ft" if isinstance(val, (list, tuple)) else str(val),
)
chart.add(
    f"Made Perimeter — {perim_fg:.0f}% FG ({len(made_outside)}/{n_perim})",
    made_outside,
    stroke=False,
    dots_size=10,
    formatter=lambda val: f"({val[0]:.1f}, {val[1]:.1f}) ft" if isinstance(val, (list, tuple)) else str(val),
)
chart.add(
    f"Missed Inside ({len(missed_inside)})",
    missed_inside,
    stroke=False,
    dots_size=15,
    formatter=lambda val: f"({val[0]:.1f}, {val[1]:.1f}) ft" if isinstance(val, (list, tuple)) else str(val),
)
chart.add(
    f"Missed Perimeter ({len(missed_outside)})",
    missed_outside,
    stroke=False,
    dots_size=10,
    formatter=lambda val: f"({val[0]:.1f}, {val[1]:.1f}) ft" if isinstance(val, (list, tuple)) else str(val),
)

# Save — theme-suffixed for pipeline (light + dark runs)
chart.render_to_png(f"plot-{THEME}.png")
chart.render_to_file(f"plot-{THEME}.html")
Runnable source as JSON, for any HTTP client: https://api.anyplot.ai/specs/scatter-shot-chart/pygal/code. Any spec id and library id listed in llms-full.txt fit the same URL shape; every URL below is complete and callable.
{
  "spec_id": "scatter-shot-chart",
  "language": "python",
  "library": "pygal",
  "page": "https://anyplot.ai/scatter-shot-chart/python/pygal",
  "hub": "https://anyplot.ai/scatter-shot-chart",
  "code_json": "https://api.anyplot.ai/specs/scatter-shot-chart/pygal/code",
  "spec_json": "https://api.anyplot.ai/specs/scatter-shot-chart",
  "render_light_png": "https://storage.googleapis.com/anyplot-images/plots/scatter-shot-chart/python/pygal/plot-light.png",
  "render_dark_png": "https://storage.googleapis.com/anyplot-images/plots/scatter-shot-chart/python/pygal/plot-dark.png",
  "interactive_light_html": "https://storage.googleapis.com/anyplot-images/plots/scatter-shot-chart/python/pygal/plot-light.html",
  "interactive_dark_html": "https://storage.googleapis.com/anyplot-images/plots/scatter-shot-chart/python/pygal/plot-dark.html",
  "quality_score": 86.0,
  "license": "MIT",
  "guide": "https://anyplot.ai/llms.txt"
}
Part of Basketball Shot Chart on anyplot.ai.