The same plot in 14 other libraries — JavaScript: Chart.js, D3.js, Highcharts, MUI X Charts; Python: Altair, Bokeh, lets-plot, Matplotlib, Plotly, plotnine, Pygal, Seaborn; R: ggplot2; Julia: Makie.jl. Compare all 15 side by side: Basketball Shot Chart in Python, R, Julia and JavaScript.
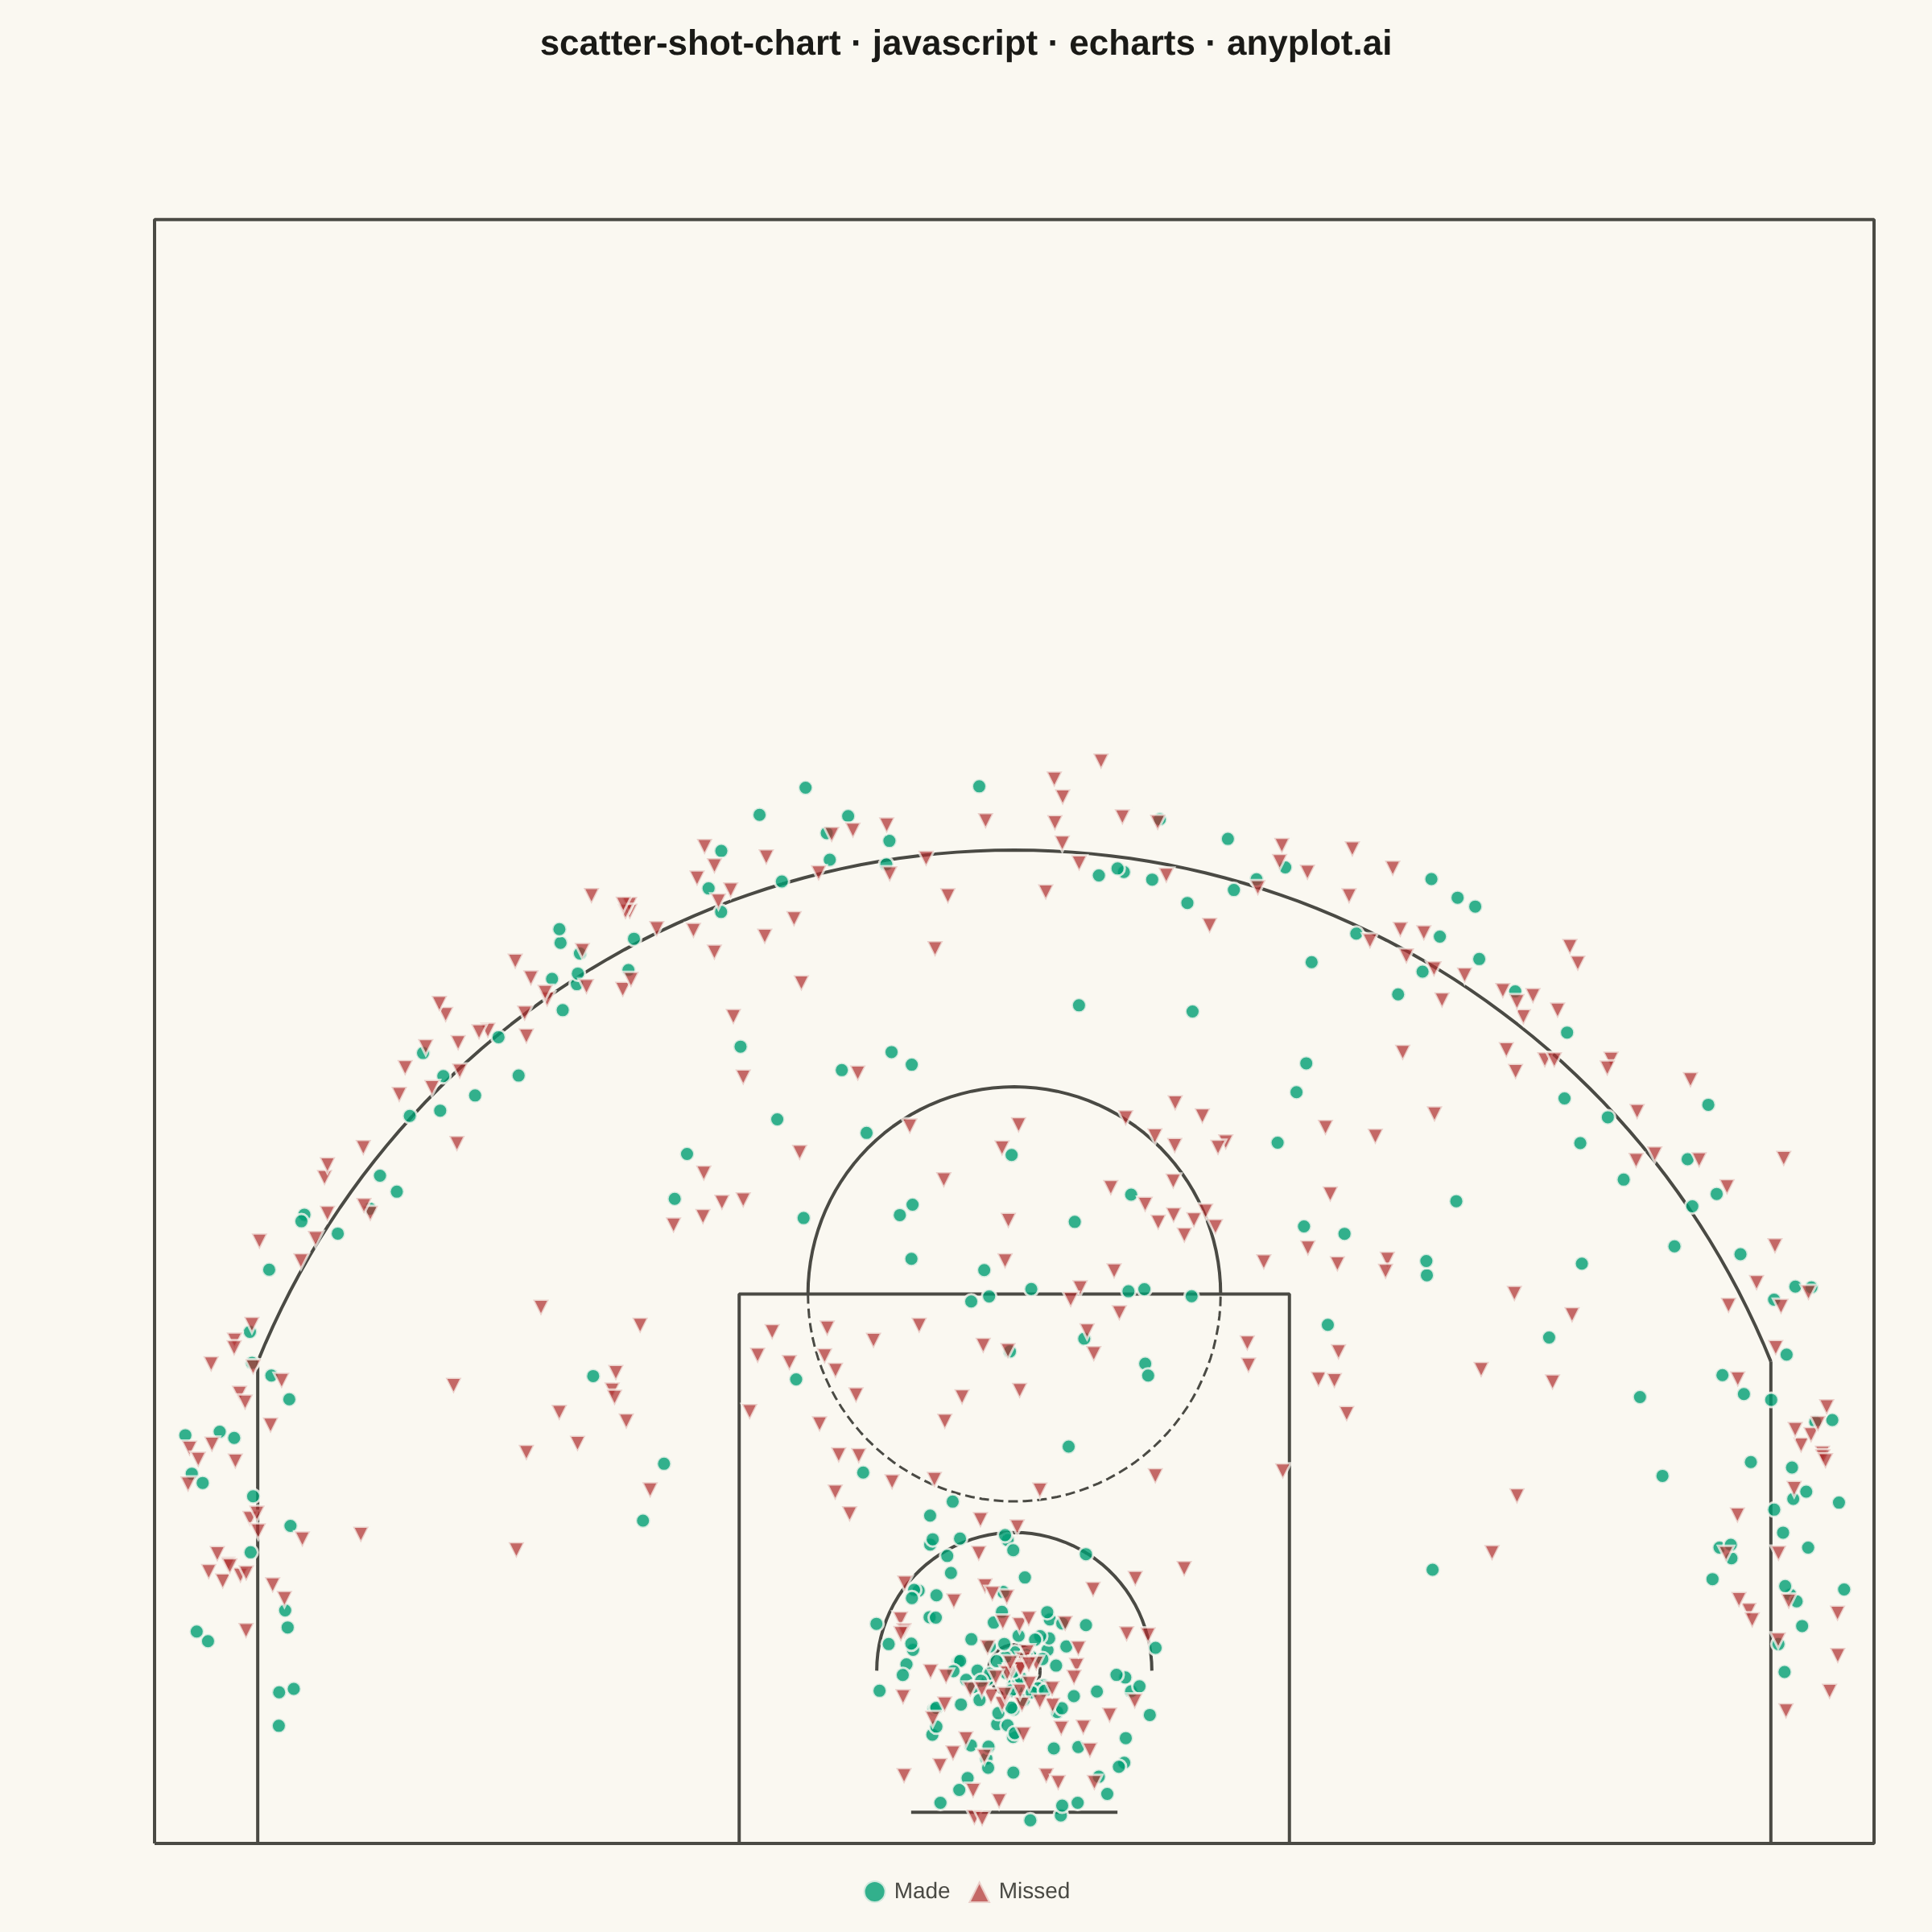
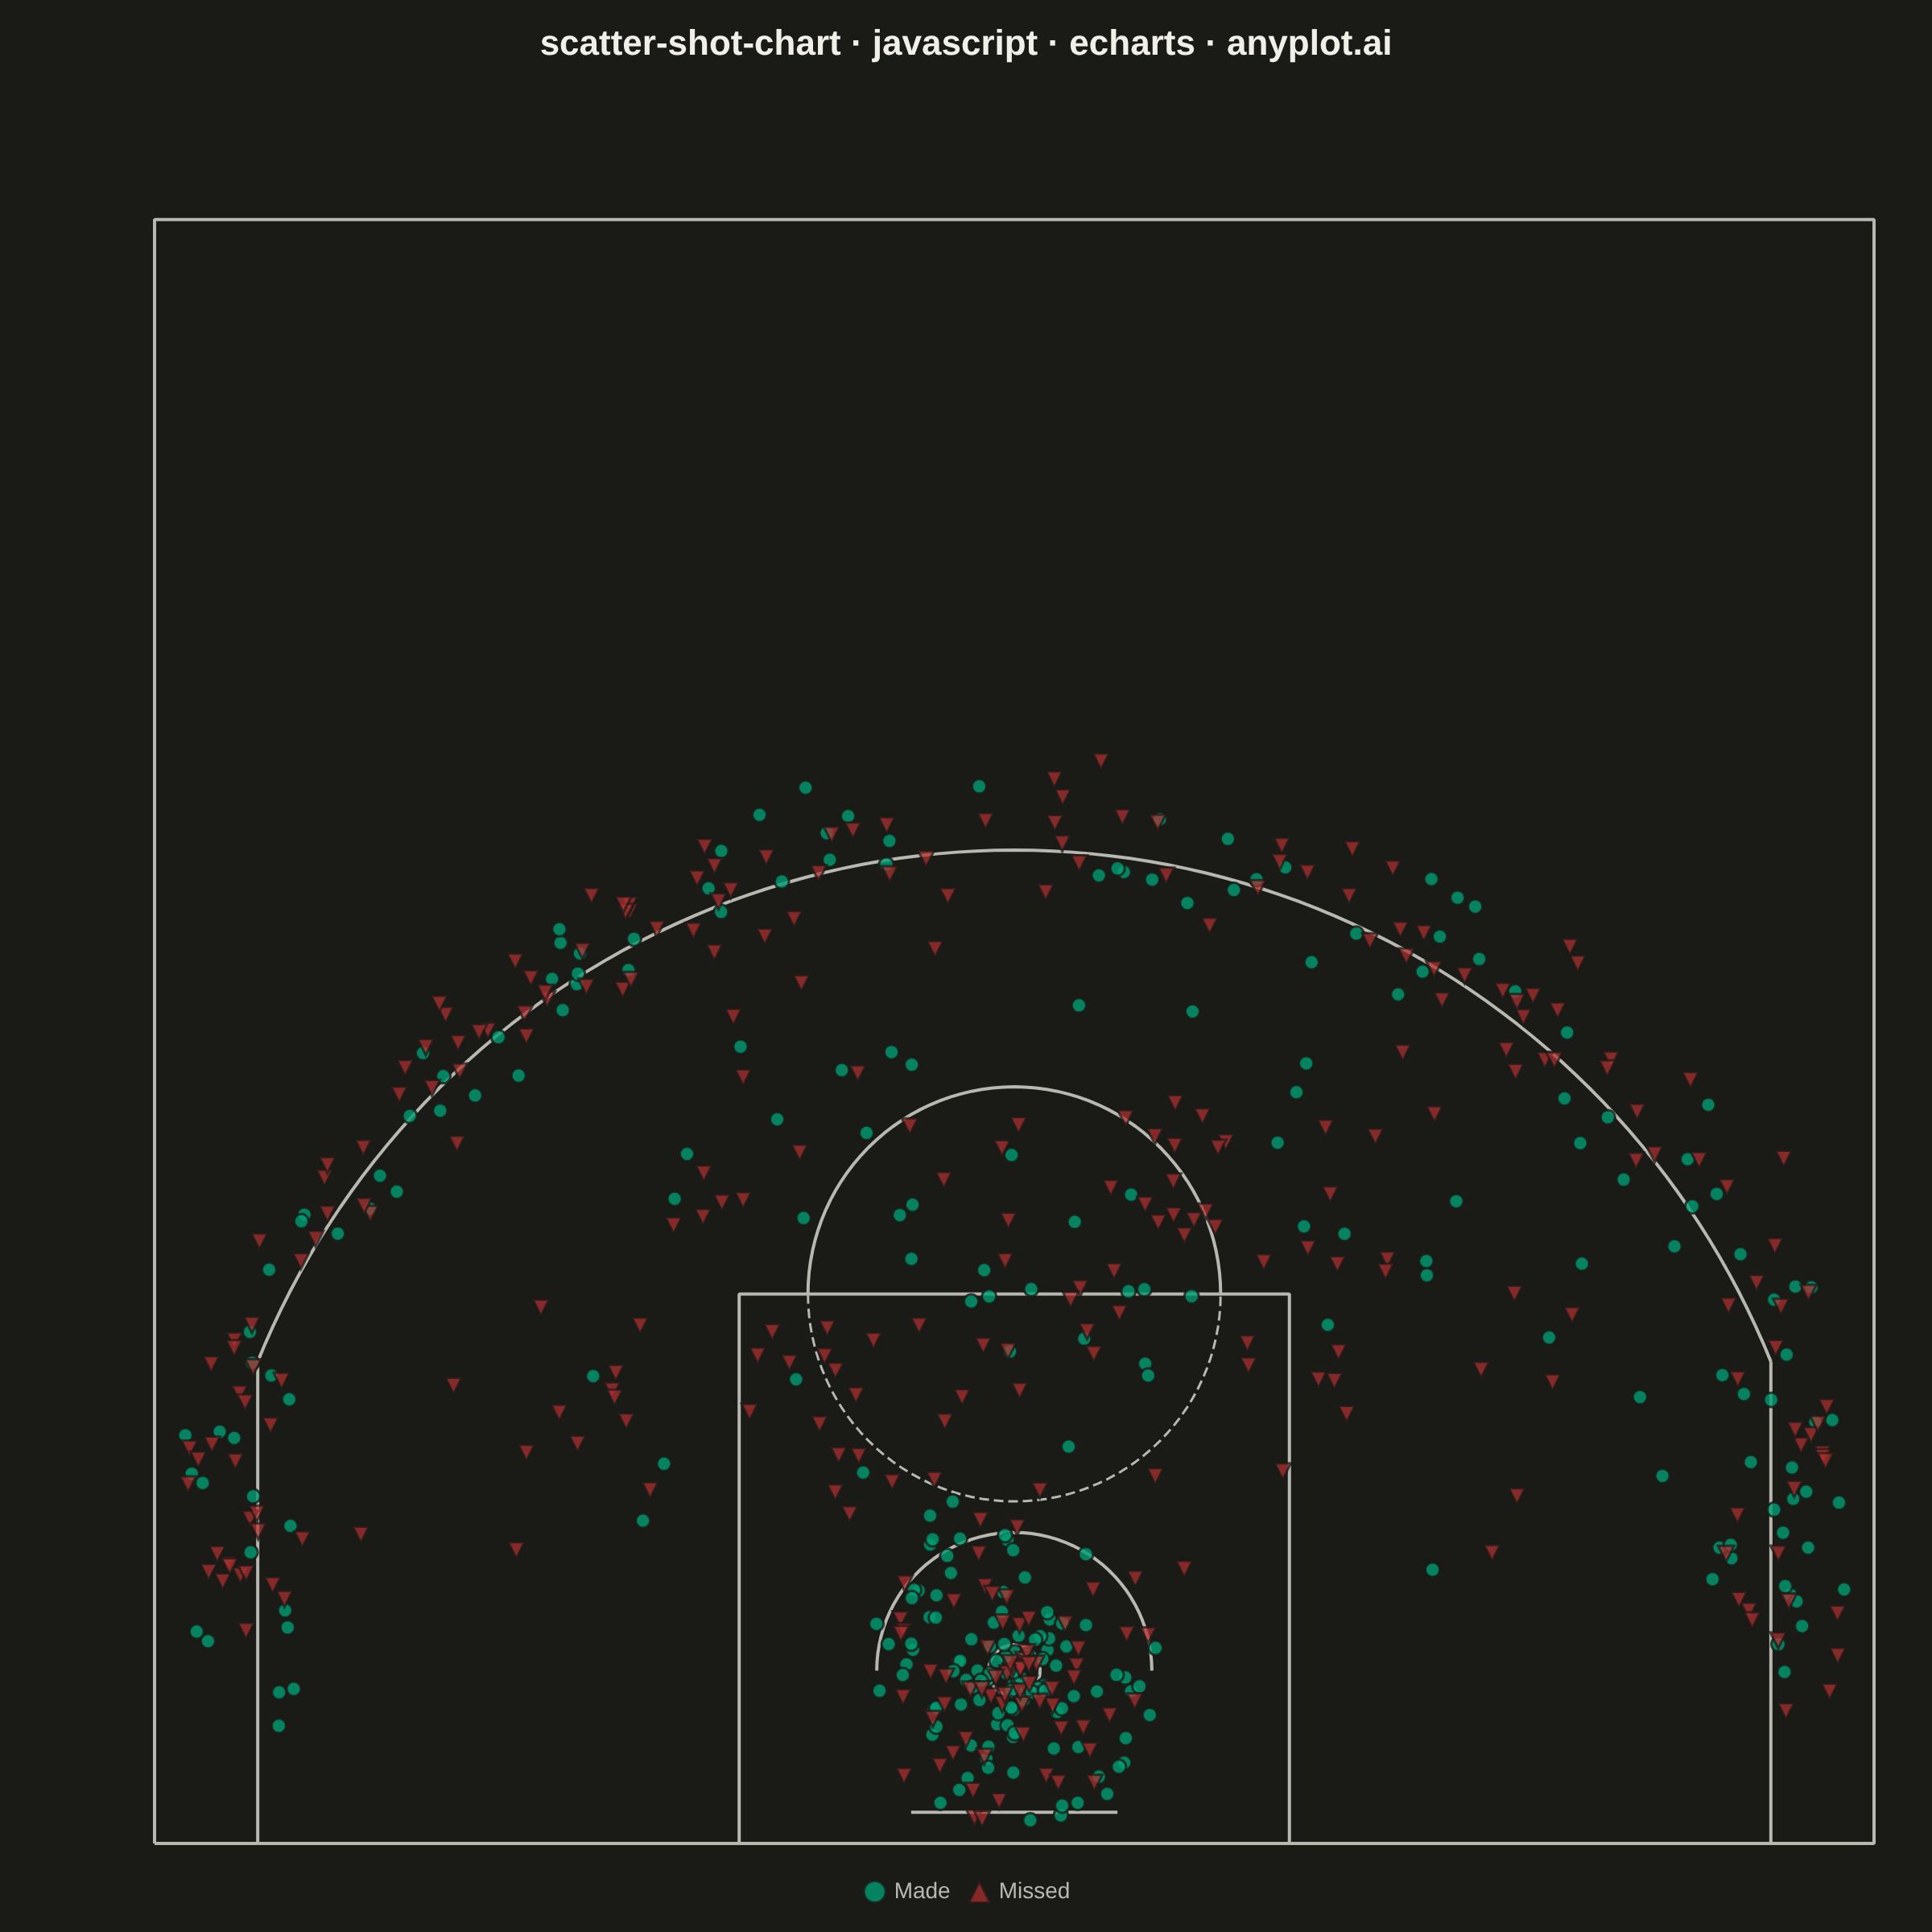
A basketball shot chart overlays shooting data on a half-court diagram, plotting each shot attempt as a point colored by outcome (made or missed). The court drawing includes the three-point arc, free-throw line, paint/key area, and basket, providing spatial context for analyzing shooting patterns and efficiency. Essential for basketball analytics and player evaluation.
// anyplot.ai
// scatter-shot-chart: Basketball Shot Chart
// Library: echarts 5.5.1 | JavaScript 22.22.3
// Quality: 93/100 | Created: 2026-06-21
//# anyplot-orientation: square

// anyplot.ai
// scatter-shot-chart: Basketball Shot Chart
// Library: echarts 5.5.1 | JavaScript 22
// Quality: pending | Created: 2026-06-21

const t = window.ANYPLOT_TOKENS;

// --- Deterministic RNG (seeded LCG) ---
let _s = 42;
function rnd() {
  _s = (Math.imul(_s, 1664525) + 1013904223) >>> 0;
  return _s / 4294967296;
}
function randn(mean, std) {
  const u = Math.max(rnd(), 1e-10);
  return mean + std * Math.sqrt(-2 * Math.log(u)) * Math.cos(2 * Math.PI * rnd());
}

// --- Shot data generation (realistic NBA half-court distribution) ---
// Made = #009E73 (green, semantic "good"), Missed = #AE3030 (red, semantic "miss")
const shots = []; // each: [x, y, made:bool]

// Zone 1: Paint / close range (< 5 ft), high FG%
for (let i = 0; i < 180; i++) {
  const r = rnd() * 4.5;
  const th = rnd() * 2 * Math.PI;
  const x = r * Math.cos(th);
  const y = r * Math.sin(th);
  if (y > -4.5 && y < 10 && Math.abs(x) < 24) {
    shots.push([x, y, rnd() < 0.62]);
  }
}

// Zone 2: Mid-range (5–22 ft), moderate FG%
for (let i = 0; i < 180; i++) {
  const x = randn(0, 11);
  const y = randn(12, 5);
  const d = Math.sqrt(x * x + y * y);
  if (d > 5 && d < 22.5 && y > -4.5 && Math.abs(x) < 24) {
    shots.push([x, y, rnd() < 0.40]);
  }
}

// Zone 3: Three-point arc, lower FG%
for (let i = 0; i < 220; i++) {
  const deg = 12 + rnd() * 156;
  const r = randn(24.1, 1.0);
  const a = deg * Math.PI / 180;
  const x = r * Math.cos(a);
  const y = r * Math.sin(a);
  if (r > 22 && y > -4.5 && Math.abs(x) < 24.5) {
    shots.push([x, y, rnd() < 0.36]);
  }
}

// Zone 4: Corner threes (straight segments of 3pt line)
for (let i = 0; i < 60; i++) {
  const side = i < 30 ? 1 : -1;
  const x = randn(side * 22, 1.2);
  const y = randn(3, 2.5);
  if (y > -4.5 && y < 9.5 && Math.abs(x) > 20.5 && Math.abs(x) < 24.5) {
    shots.push([x, y, rnd() < 0.38]);
  }
}

const madeData   = shots.filter(s => s[2]).map(s => [s[0], s[1]]);
const missedData = shots.filter(s => !s[2]).map(s => [s[0], s[1]]);

// --- Court geometry helpers (coordinates in feet, basket at origin) ---
function arc(cx, cy, r, a0Deg, a1Deg, n) {
  const pts = [];
  for (let i = 0; i <= n; i++) {
    const a = (a0Deg + (a1Deg - a0Deg) * i / n) * Math.PI / 180;
    pts.push([cx + r * Math.cos(a), cy + r * Math.sin(a)]);
  }
  return pts;
}

// Key NBA half-court constants
const BL   = -5;      // baseline y (basket is 5 ft from baseline)
const CT   = 42;      // midcourt y
const FT_Y = 10.9;    // free-throw line (15 ft from backboard at y=-4.1)
const TP_R = 23.75;   // three-point arc radius
const TP_X = 22;      // corner three-point x distance
const TP_JY = Math.sqrt(TP_R * TP_R - TP_X * TP_X); // junction y ≈ 8.95
const TP_A0 = Math.atan2(TP_JY, TP_X) * 180 / Math.PI;   // ≈ 22.1°
const TP_A1 = 180 - TP_A0;                                 // ≈ 157.9°

const cw = { color: t.inkSoft, width: 2, type: "solid" };
const cd = { color: t.inkSoft, width: 1.5, type: "dashed" };

function cline(data, ls) {
  return { type: "line", data, symbol: "none", silent: true, animation: false,
           lineStyle: ls || cw, z: 1, tooltip: { show: false } };
}

const courtSeries = [
  // Court boundary
  cline([[-25, BL], [25, BL], [25, CT], [-25, CT], [-25, BL]]),
  // Backboard
  cline([[-3, -4.1], [3, -4.1]]),
  // Paint / key box (16 ft wide, from baseline to free-throw line)
  cline([[-8, BL], [-8, FT_Y], [8, FT_Y], [8, BL]]),
  // Free-throw circle — upper (solid, toward midcourt)
  cline(arc(0, FT_Y, 6, 0, 180, 60)),
  // Free-throw circle — lower (dashed, toward basket)
  cline(arc(0, FT_Y, 6, 180, 360, 60), cd),
  // Restricted area arc (4 ft radius, semi-circle toward midcourt)
  cline(arc(0, 0, 4, 0, 180, 50)),
  // Three-point corner segments
  cline([[TP_X, BL], [TP_X, TP_JY]]),
  cline([[-TP_X, BL], [-TP_X, TP_JY]]),
  // Three-point arc (from right junction to left junction, over the top)
  cline(arc(0, 0, TP_R, TP_A0, TP_A1, 100)),
  // Basket / hoop (0.75 ft radius circle)
  cline(arc(0, 0, 0.75, 0, 360, 48)),
];

// --- Chart ---
const chart = echarts.init(document.getElementById("container"));

// Title length: 54 chars < 67 baseline, no scaling needed
const titleText = "scatter-shot-chart · javascript · echarts · anyplot.ai";

chart.setOption({
  animation: false,
  color: t.palette,
  backgroundColor: "transparent",

  tooltip: {
    trigger: "item",
    backgroundColor: t.elevatedBg,
    textStyle: { color: t.ink, fontSize: 13 },
    formatter: function (params) {
      if (params.seriesType !== "scatter") return null;
      return (
        "<b>" + params.seriesName + "</b><br/>" +
        "x: " + params.data[0].toFixed(1) + " ft<br/>" +
        "y: " + params.data[1].toFixed(1) + " ft"
      );
    },
  },

  title: {
    text: titleText,
    left: "center",
    top: 12,
    textStyle: { color: t.ink, fontSize: 22, fontWeight: "bold" },
  },

  legend: {
    data: [
      { name: "Made",   icon: "circle" },
      { name: "Missed", icon: "triangle" },
    ],
    bottom: 12,
    left: "center",
    textStyle: { color: t.inkSoft, fontSize: 14 },
    itemWidth: 14,
    itemHeight: 14,
  },

  // Equal data ranges (50 ft × 50 ft) over an approximately square grid
  // → preserves the 1:1 court aspect ratio
  grid: { left: "8%", right: "3%", top: 72, bottom: 55 },

  xAxis: {
    type: "value",
    min: -25, max: 25,
    axisLabel: { show: false },
    axisLine: { show: false },
    axisTick: { show: false },
    splitLine: { show: false },
  },
  yAxis: {
    type: "value",
    min: -5, max: 45,
    axisLabel: { show: false },
    axisLine: { show: false },
    axisTick: { show: false },
    splitLine: { show: false },
  },

  series: [
    ...courtSeries,
    // Made shots — brand green (semantic: good/success)
    {
      name: "Made",
      type: "scatter",
      data: madeData,
      z: 10,
      symbol: "circle",
      symbolSize: 9,
      itemStyle: {
        color: t.palette[0],   // #009E73 — brand green
        opacity: 0.80,
        borderColor: t.pageBg,
        borderWidth: 1.5,
      },
    },
    // Missed shots — matte red (semantic: bad/fail), triangle for redundant encoding
    {
      name: "Missed",
      type: "scatter",
      data: missedData,
      z: 10,
      symbol: "triangle",
      symbolSize: 10,
      symbolRotate: 180,
      itemStyle: {
        color: t.palette[4],   // #AE3030 — matte red
        opacity: 0.72,
        borderColor: t.pageBg,
        borderWidth: 1.5,
      },
    },
  ],
});
Runnable source as JSON, for any HTTP client: https://api.anyplot.ai/specs/scatter-shot-chart/echarts/code. Any spec id and library id listed in llms-full.txt fit the same URL shape; every URL below is complete and callable.
{
  "spec_id": "scatter-shot-chart",
  "language": "javascript",
  "library": "echarts",
  "page": "https://anyplot.ai/scatter-shot-chart/javascript/echarts",
  "hub": "https://anyplot.ai/scatter-shot-chart",
  "code_json": "https://api.anyplot.ai/specs/scatter-shot-chart/echarts/code",
  "spec_json": "https://api.anyplot.ai/specs/scatter-shot-chart",
  "render_light_png": "https://storage.googleapis.com/anyplot-images/plots/scatter-shot-chart/javascript/echarts/plot-light.png",
  "render_dark_png": "https://storage.googleapis.com/anyplot-images/plots/scatter-shot-chart/javascript/echarts/plot-dark.png",
  "interactive_light_html": "https://storage.googleapis.com/anyplot-images/plots/scatter-shot-chart/javascript/echarts/plot-light.html",
  "interactive_dark_html": "https://storage.googleapis.com/anyplot-images/plots/scatter-shot-chart/javascript/echarts/plot-dark.html",
  "quality_score": 93.0,
  "license": "MIT",
  "guide": "https://anyplot.ai/llms.txt"
}
Part of Basketball Shot Chart on anyplot.ai.