The same plot in 14 other libraries — Python: Altair, Bokeh, lets-plot, Matplotlib, Plotly, plotnine, Pygal, Seaborn; R: ggplot2; JavaScript: Chart.js, D3.js, Apache ECharts, Highcharts, MUI X Charts. Compare all 15 side by side: Basketball Shot Chart in Python, R, Julia and JavaScript.
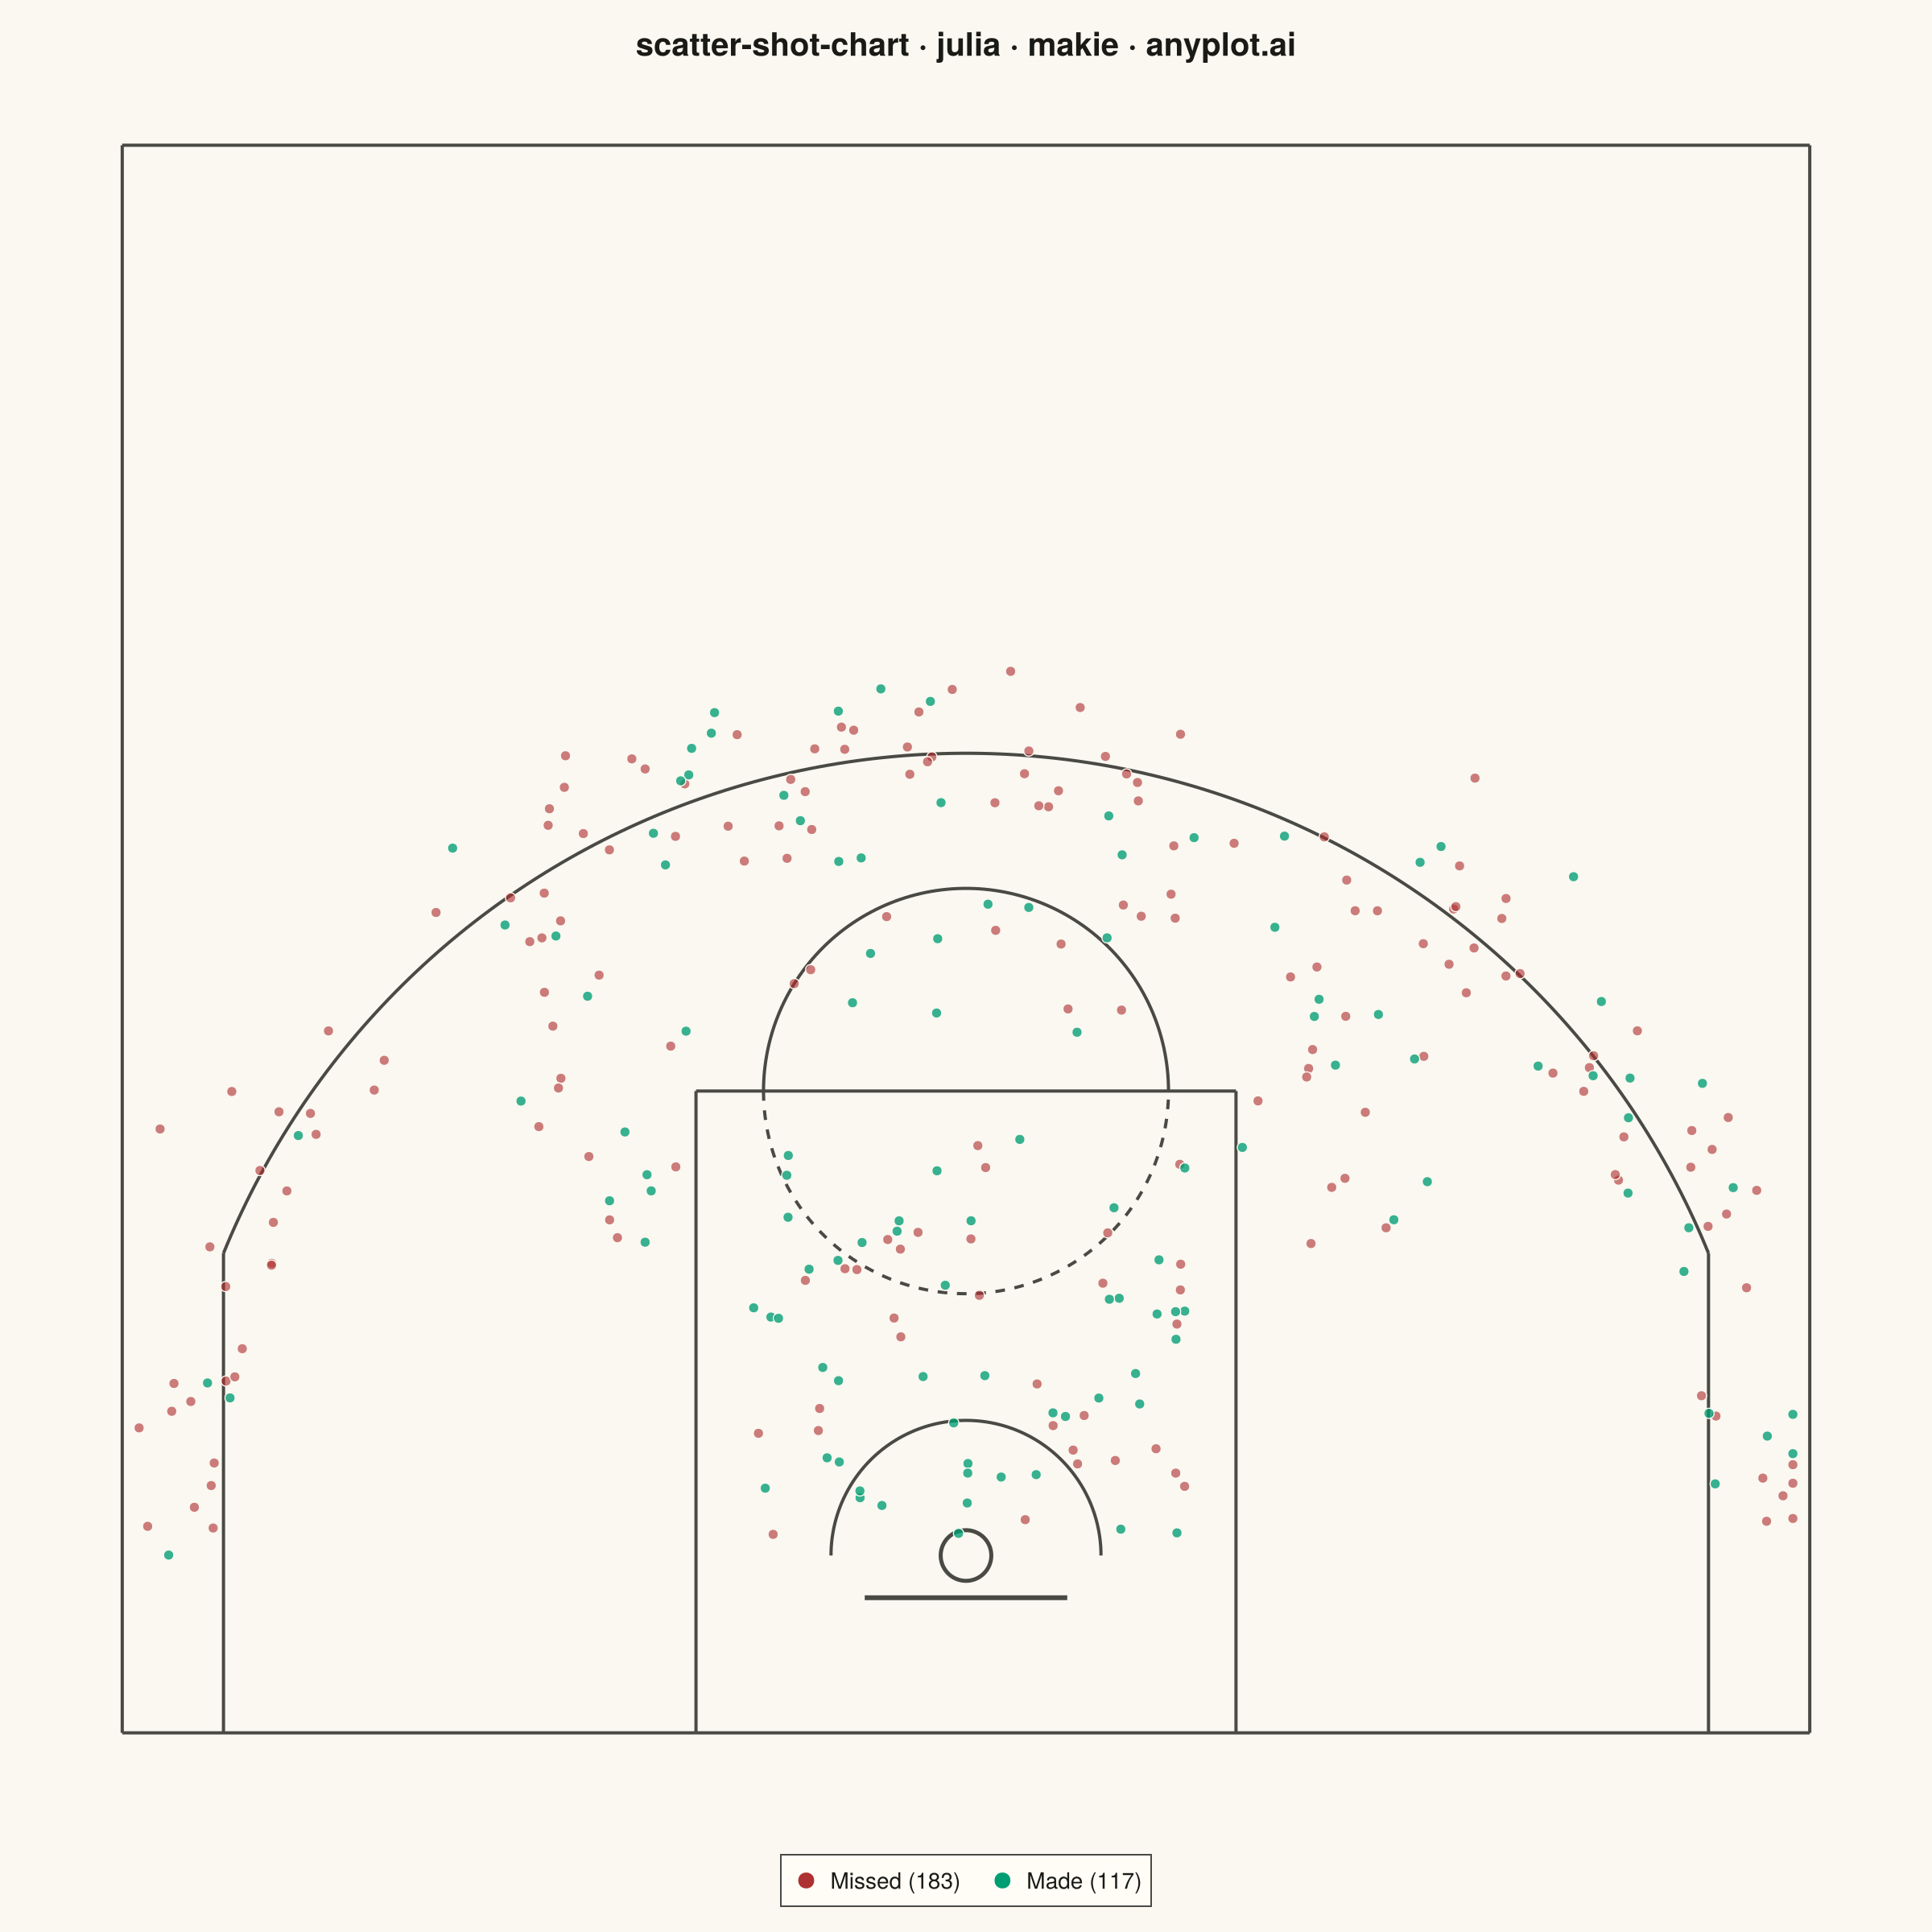
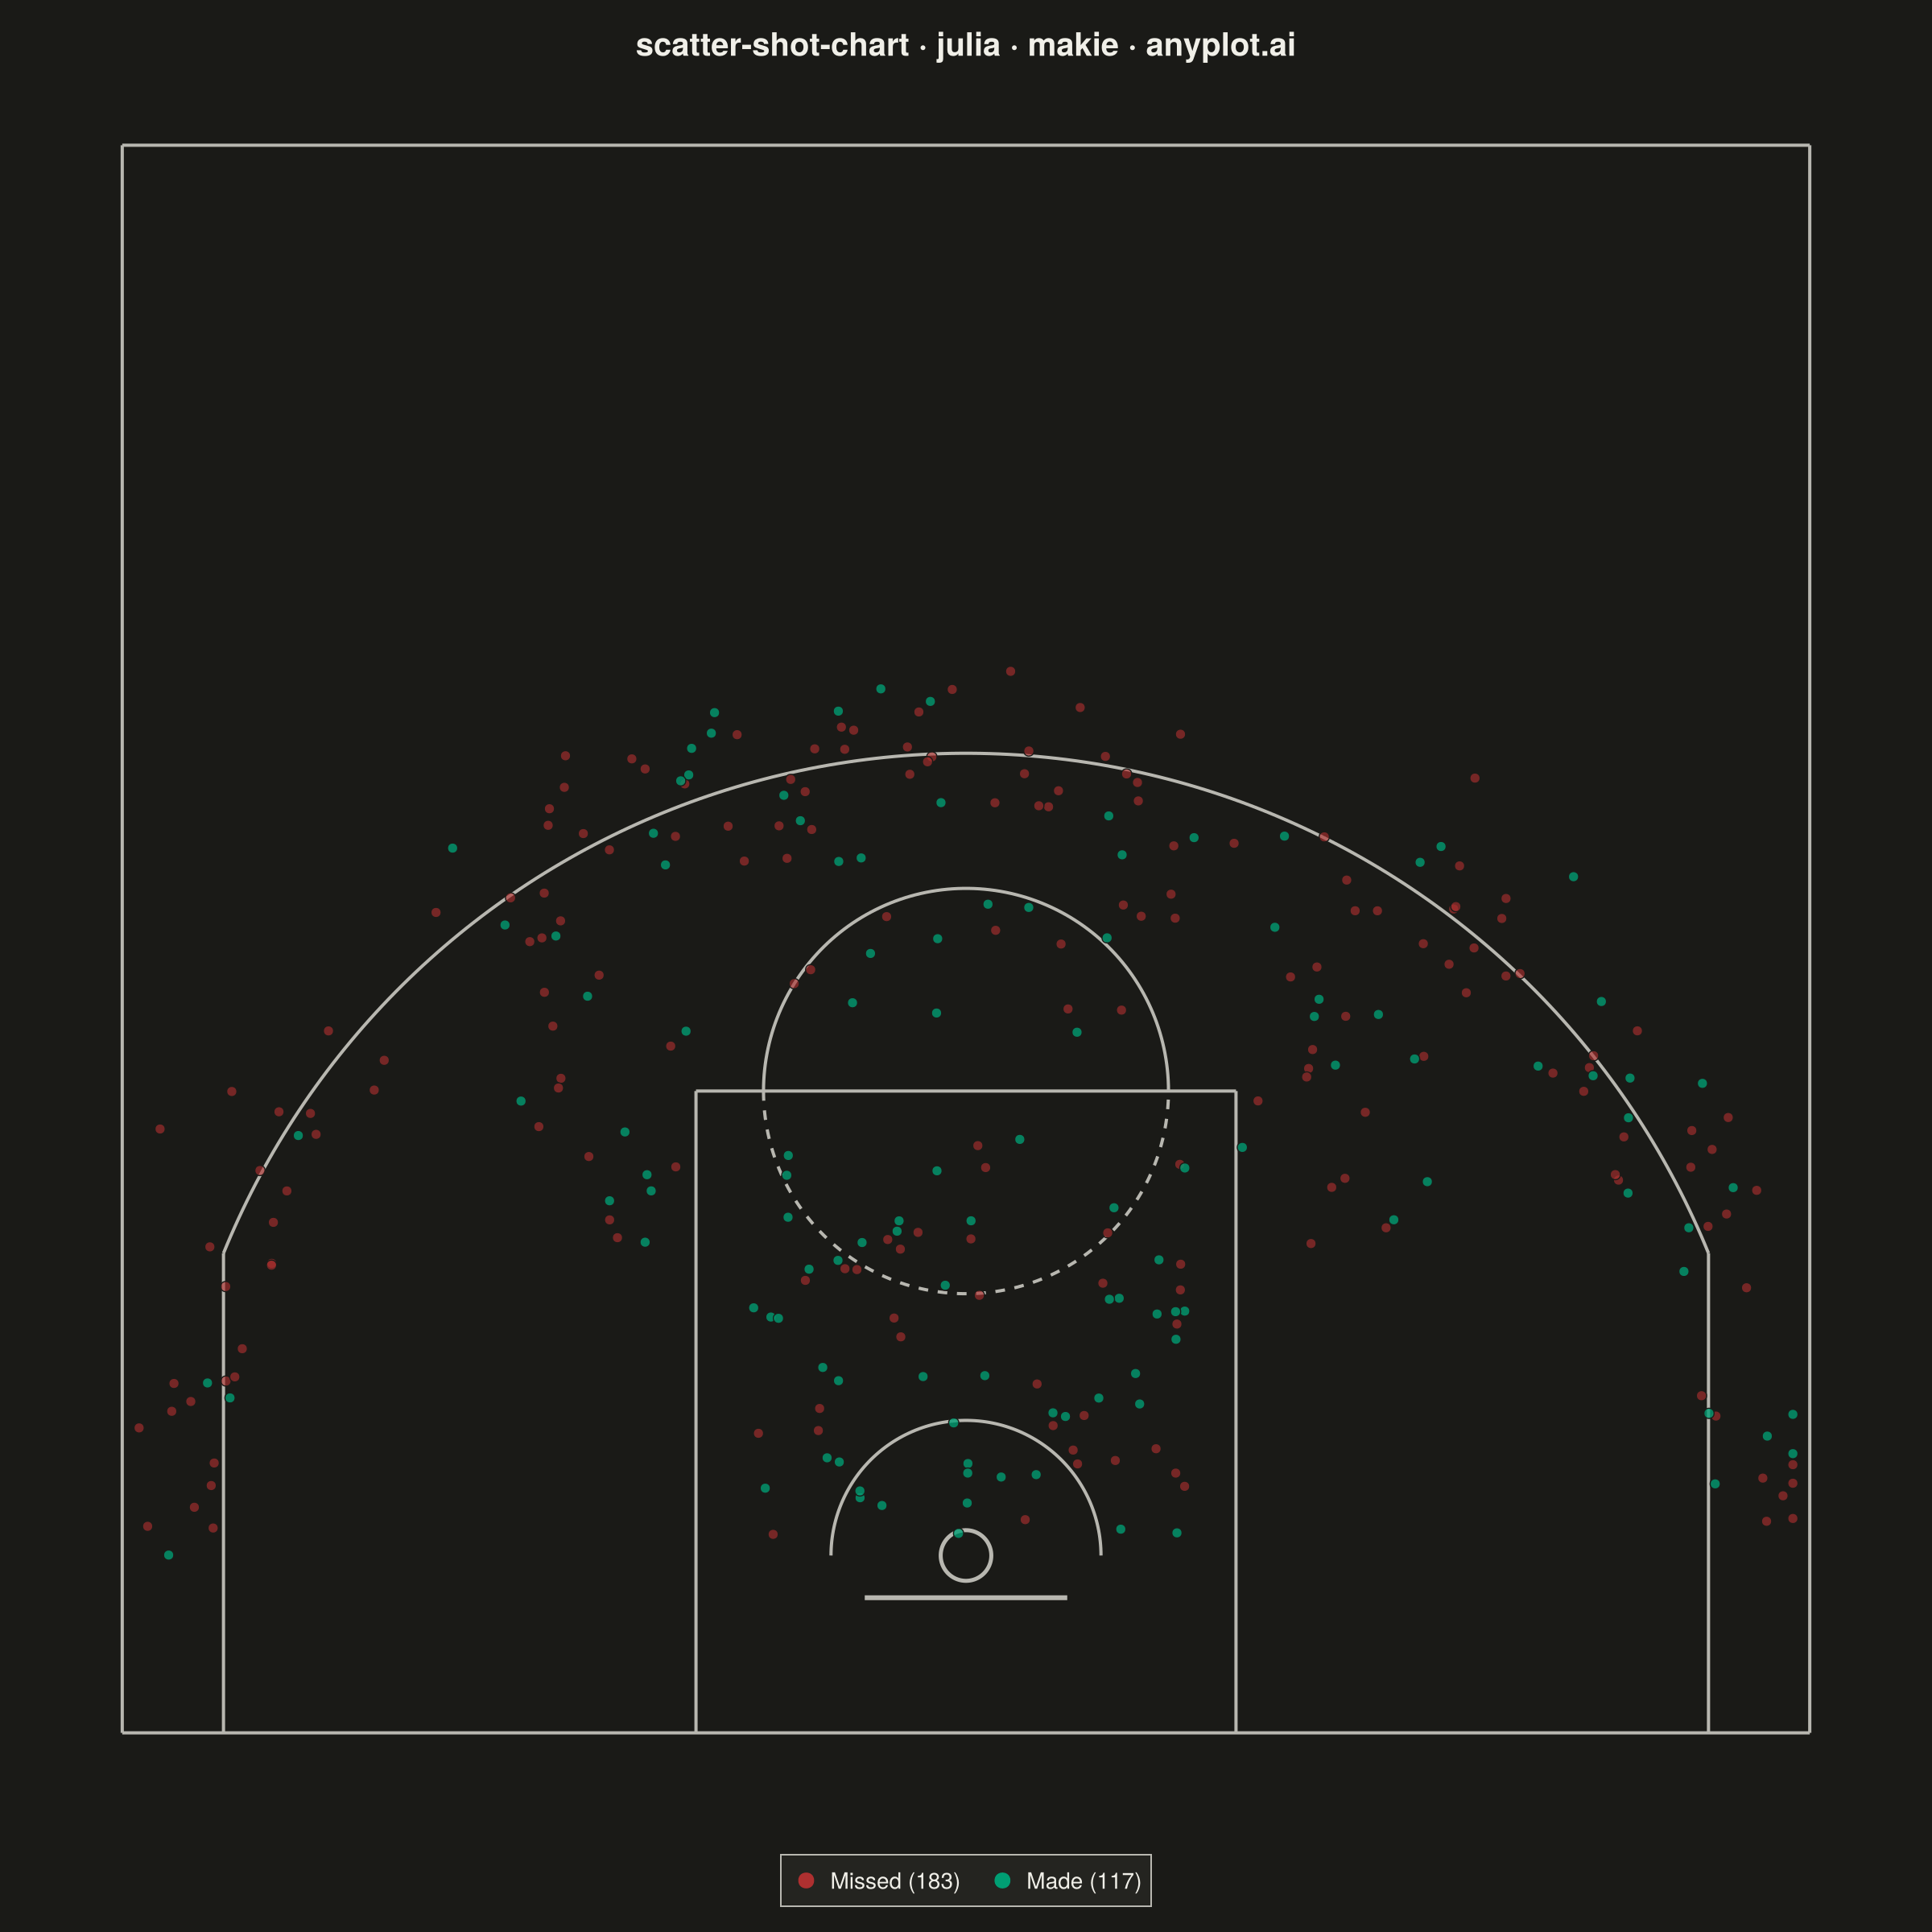
A basketball shot chart overlays shooting data on a half-court diagram, plotting each shot attempt as a point colored by outcome (made or missed). The court drawing includes the three-point arc, free-throw line, paint/key area, and basket, providing spatial context for analyzing shooting patterns and efficiency. Essential for basketball analytics and player evaluation.
# anyplot.ai
# scatter-shot-chart: Basketball Shot Chart
# Library: makie 0.22.10 | Julia 1.11.9
# Quality: 87/100 | Created: 2026-06-21

using CairoMakie
using Colors
using Random

Random.seed!(42)

# --- Theme tokens -----------------------------------------------------------
const THEME       = get(ENV, "ANYPLOT_THEME", "light")
const PAGE_BG     = THEME == "light" ? colorant"#FAF8F1" : colorant"#1A1A17"
const ELEVATED_BG = THEME == "light" ? colorant"#FFFDF6" : colorant"#242420"
const INK         = THEME == "light" ? colorant"#1A1A17" : colorant"#F0EFE8"
const INK_SOFT    = THEME == "light" ? colorant"#4A4A44" : colorant"#B8B7B0"

# Semantic exception: made = success (green), missed = loss (red)
const COLOR_MADE   = colorant"#009E73"  # Imprint palette pos 1
const COLOR_MISSED = colorant"#AE3030"  # Imprint palette pos 5 (semantic bad/loss)

# --- Data: 300 shot attempts (basket at origin) -----------------------------
# NBA half-court: 50 ft wide (x ∈ [-25, 25]), baseline at y = -5.25,
# half-court at y = 41.75, key x ∈ [-8, 8] y ∈ [-5.25, 13.75]

# Paint shots — high percentage (~56% FG)
n_paint = 80
x_paint = (rand(n_paint) .- 0.5) .* 13
y_paint = rand(n_paint) .* 12 .+ 0.5
made_paint = rand(n_paint) .< 0.56

# Mid-range shots — lower percentage (~40% FG)
x_mid_le = -8.0 .- rand(22) .* 6
y_mid_le = 9.0 .+ rand(22) .* 10
x_mid_ri = 8.0 .+ rand(22) .* 6
y_mid_ri = 9.0 .+ rand(22) .* 10
x_mid_to = (rand(26) .- 0.5) .* 14
y_mid_to = 15.0 .+ rand(26) .* 7
x_mid  = vcat(x_mid_le, x_mid_ri, x_mid_to)
y_mid  = vcat(y_mid_le, y_mid_ri, y_mid_to)
made_mid = rand(70) .< 0.40

# Three-point shots — longest range (~34% FG)
n_three = 150
θ_three = π .* rand(n_three)
r_three = max.(23.75 .+ randn(n_three) .* 1.5, 22.3)
x_three = clamp.(r_three .* cos.(θ_three), -24.5, 24.5)
y_three = max.(r_three .* sin.(θ_three), -4.5)
made_three = rand(n_three) .< 0.34

# Merge all shot data
x_shots  = vcat(x_paint, x_mid, x_three)
y_shots  = vcat(y_paint, y_mid, y_three)
made_all = vcat(made_paint, made_mid, made_three)
made_idx   = findall(made_all)
missed_idx = findall(.!made_all)
n_made   = length(made_idx)
n_missed = length(missed_idx)

# --- Figure -----------------------------------------------------------------
fig = Figure(size = (1200, 1200), fontsize = 14, backgroundcolor = PAGE_BG)

ax = Axis(
    fig[1, 1];
    title               = "scatter-shot-chart · julia · makie · anyplot.ai",
    titlesize           = 20,
    titlecolor          = INK,
    aspect              = DataAspect(),
    backgroundcolor     = PAGE_BG,
    topspinevisible     = false,
    rightspinevisible   = false,
    leftspinevisible    = false,
    bottomspinevisible  = false,
    xticksvisible       = false,
    yticksvisible       = false,
    xticklabelsvisible  = false,
    yticklabelsvisible  = false,
    xgridvisible        = false,
    ygridvisible        = false,
)

# --- Court lines (basket at origin, dims in feet) ---------------------------
lc = INK_SOFT
lw = 2.0

# Half-court boundary
lines!(ax, [-25, 25], [-5.25, -5.25]; color = lc, linewidth = lw)   # baseline
lines!(ax, [-25, 25], [41.75, 41.75]; color = lc, linewidth = lw)   # half-court
lines!(ax, [-25, -25], [-5.25, 41.75]; color = lc, linewidth = lw)  # left sideline
lines!(ax, [25, 25], [-5.25, 41.75]; color = lc, linewidth = lw)    # right sideline

# Paint (key): 16 ft wide, baseline to free-throw line (13.75 ft from basket)
lines!(ax, [-8, -8], [-5.25, 13.75]; color = lc, linewidth = lw)
lines!(ax, [8, 8], [-5.25, 13.75]; color = lc, linewidth = lw)
lines!(ax, [-8, 8], [13.75, 13.75]; color = lc, linewidth = lw)

# Free-throw circle (center (0, 13.75), radius 6 ft) — top half solid, bottom dashed
θ_ft_top = range(0.0, π, length = 120)
θ_ft_bot = range(π, 2π, length = 120)
lines!(ax, 6 .* cos.(θ_ft_top), 13.75 .+ 6 .* sin.(θ_ft_top); color = lc, linewidth = lw)
lines!(ax, 6 .* cos.(θ_ft_bot), 13.75 .+ 6 .* sin.(θ_ft_bot); color = lc, linewidth = lw, linestyle = :dash)

# Restricted-area arc (radius 4 ft, upper semicircle)
θ_rest = range(0.0, π, length = 120)
lines!(ax, 4 .* cos.(θ_rest), 4 .* sin.(θ_rest); color = lc, linewidth = lw)

# Three-point line: arc (radius 23.75 ft) + corner straight lines (x = ±22)
y_corner  = sqrt(23.75^2 - 22.0^2)             # ≈ 8.95 ft from basket
θ_3start  = atan(y_corner, 22.0)
θ_3arc    = range(θ_3start, π - θ_3start, length = 200)
lines!(ax, 23.75 .* cos.(θ_3arc), 23.75 .* sin.(θ_3arc); color = lc, linewidth = lw)
lines!(ax, [22.0, 22.0], [-5.25, y_corner]; color = lc, linewidth = lw)
lines!(ax, [-22.0, -22.0], [-5.25, y_corner]; color = lc, linewidth = lw)

# Basket rim (radius 0.75 ft) and backboard
θ_rim = range(0.0, 2π, length = 80)
lines!(ax, 0.75 .* cos.(θ_rim), 0.75 .* sin.(θ_rim); color = lc, linewidth = lw + 0.5)
lines!(ax, [-3.0, 3.0], [-1.25, -1.25]; color = lc, linewidth = lw + 1.0)

# --- Shot markers -----------------------------------------------------------
# Shape encoding adds a second channel for CVD accessibility (xcross = missed, circle = made)
scatter!(ax, x_shots[missed_idx], y_shots[missed_idx];
    color = (COLOR_MISSED, 0.65), markersize = 12,
    marker = :xcross,
    strokewidth = 0.5, strokecolor = PAGE_BG)

scatter!(ax, x_shots[made_idx], y_shots[made_idx];
    color = (COLOR_MADE, 0.80), markersize = 12,
    marker = :circle,
    strokewidth = 0.7, strokecolor = PAGE_BG)

# --- Legend -----------------------------------------------------------------
elem_missed = MarkerElement(; color = COLOR_MISSED, marker = :xcross, markersize = 14)
elem_made   = MarkerElement(; color = COLOR_MADE,   marker = :circle, markersize = 14)

Legend(
    fig[2, 1],
    [elem_missed, elem_made],
    ["Missed ($n_missed)", "Made ($n_made)"];
    orientation     = :horizontal,
    tellwidth       = false,
    tellheight      = true,
    labelsize       = 14,
    labelcolor      = INK,
    framecolor      = INK_SOFT,
    backgroundcolor = ELEVATED_BG,
)

xlims!(ax, -27, 27)
ylims!(ax, -8, 44)

# --- Save -------------------------------------------------------------------
save("plot-$(THEME).png", fig; px_per_unit = 2)
Runnable source as JSON, for any HTTP client: https://api.anyplot.ai/specs/scatter-shot-chart/makie/code. Any spec id and library id listed in llms-full.txt fit the same URL shape; every URL below is complete and callable.
{
  "spec_id": "scatter-shot-chart",
  "language": "julia",
  "library": "makie",
  "page": "https://anyplot.ai/scatter-shot-chart/julia/makie",
  "hub": "https://anyplot.ai/scatter-shot-chart",
  "code_json": "https://api.anyplot.ai/specs/scatter-shot-chart/makie/code",
  "spec_json": "https://api.anyplot.ai/specs/scatter-shot-chart",
  "render_light_png": "https://storage.googleapis.com/anyplot-images/plots/scatter-shot-chart/julia/makie/plot-light.png",
  "render_dark_png": "https://storage.googleapis.com/anyplot-images/plots/scatter-shot-chart/julia/makie/plot-dark.png",
  "quality_score": 87.0,
  "license": "MIT",
  "guide": "https://anyplot.ai/llms.txt"
}
Part of Basketball Shot Chart on anyplot.ai.