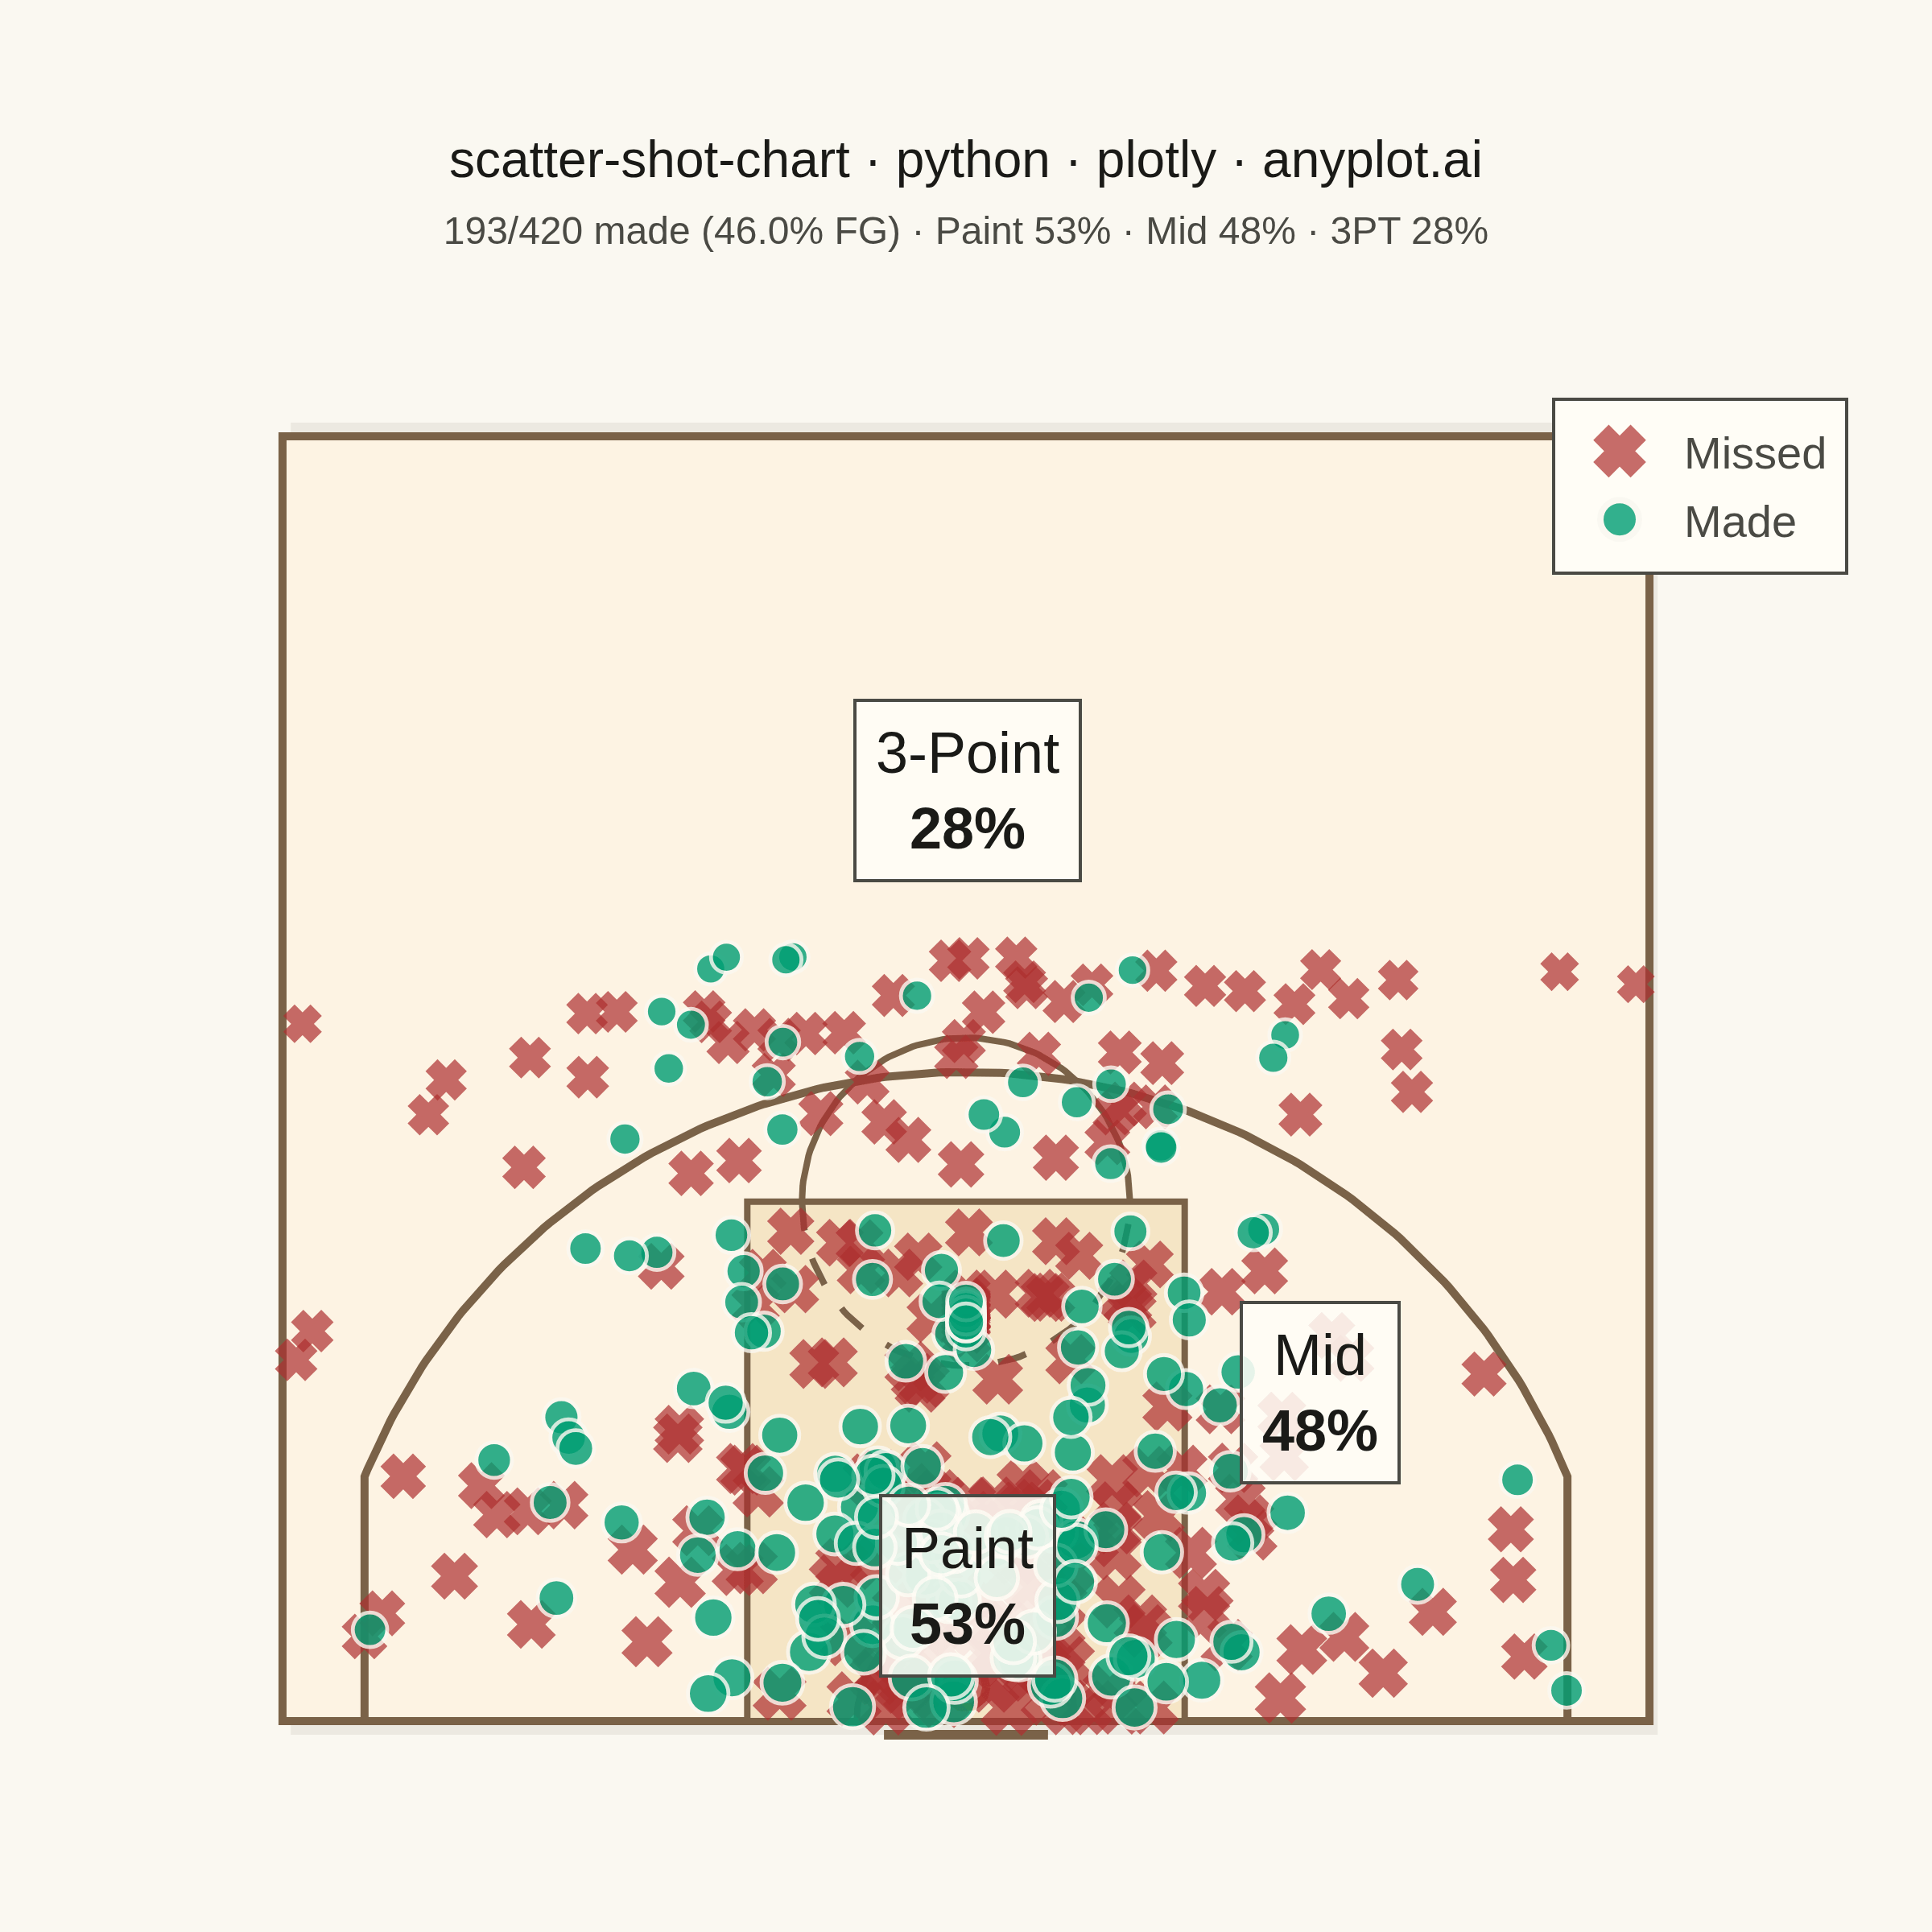
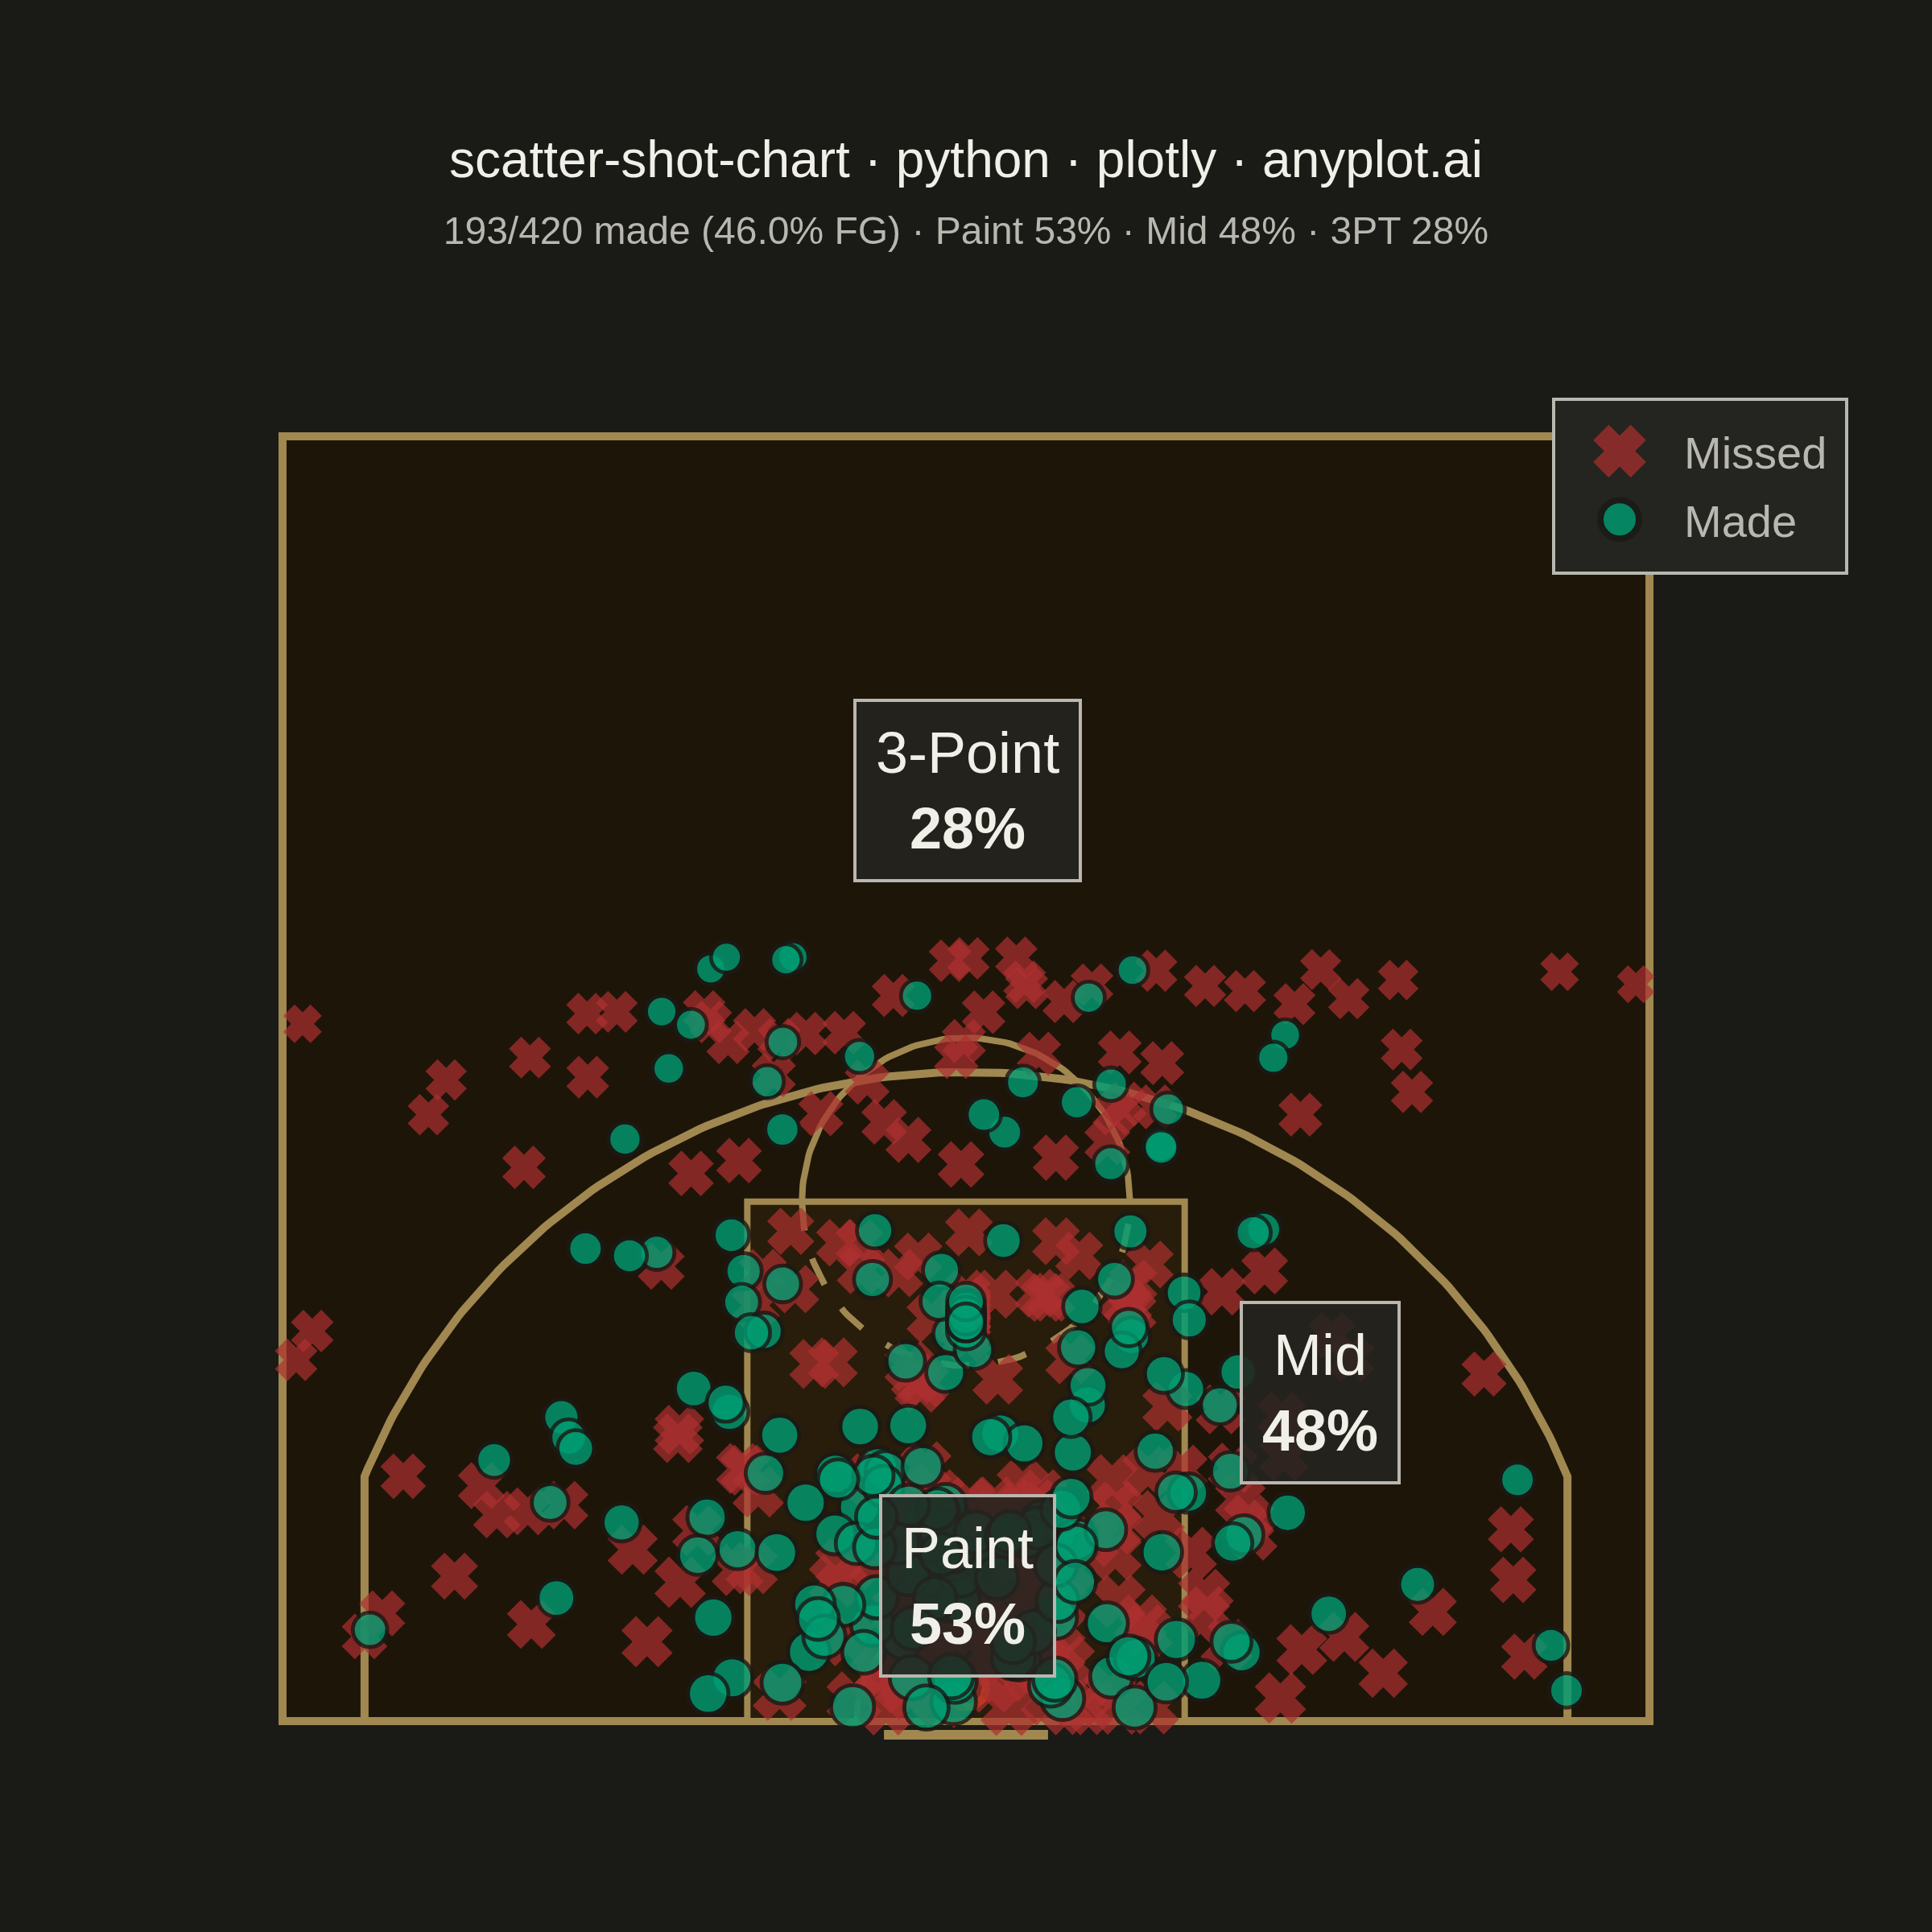
A basketball shot chart overlays shooting data on a half-court diagram, plotting each shot attempt as a point colored by outcome (made or missed). The court drawing includes the three-point arc, free-throw line, paint/key area, and basket, providing spatial context for analyzing shooting patterns and efficiency. Essential for basketball analytics and player evaluation.
""" anyplot.ai
scatter-shot-chart: Basketball Shot Chart
Library: plotly 6.8.0 | Python 3.13.14
Quality: 91/100 | Updated: 2026-06-21
"""

import os
import sys


_here = os.path.dirname(os.path.abspath(__file__))
sys.path = [p for p in sys.path if os.path.abspath(p) != _here]

import numpy as np
import plotly.graph_objects as go


# Theme tokens
THEME = os.getenv("ANYPLOT_THEME", "light")
PAGE_BG = "#FAF8F1" if THEME == "light" else "#1A1A17"
ELEVATED_BG = "#FFFDF6" if THEME == "light" else "#242420"
INK = "#1A1A17" if THEME == "light" else "#F0EFE8"
INK_SOFT = "#4A4A44" if THEME == "light" else "#B8B7B0"

# Court aesthetics — warm hardwood (light) / dark parquet (dark)
COURT_FLOOR = "#FDF3E3" if THEME == "light" else "#1E1509"
PAINT_FILL = "#F5E5C5" if THEME == "light" else "#281C0A"
COURT_LINE = "#7A6248" if THEME == "light" else "#A08850"
SHADOW_CLR = "rgba(80,60,40,0.08)" if THEME == "light" else "rgba(0,0,0,0)"

# Annotation background — theme-adaptive elevated surface with alpha
ANN_BG = "rgba(255,253,246,0.88)" if THEME == "light" else "rgba(36,36,32,0.88)"

# Imprint palette: green = made (success), red = missed (error) — spec + semantic roles
BRAND = "#009E73"  # Imprint pos 1 — made shots
MISS_CLR = "#AE3030"  # Imprint pos 5 — missed shots

# Data
np.random.seed(99)

x = np.concatenate(
    [
        np.random.normal(0, 4, 110),  # Paint area
        np.random.normal(0, 8, 130),  # Mid-range
        np.random.uniform(-22, 22, 70),  # Corner threes and wings
        np.random.normal(0, 10, 80),  # Top of key / three-point
        np.zeros(30),  # Free throws
    ]
)
y = np.concatenate(
    [
        np.random.uniform(0, 8, 110),
        np.random.uniform(6, 18, 130),
        np.random.uniform(0, 10, 70),
        np.random.uniform(20, 28, 80),
        np.full(30, 15.0) + np.random.normal(0, 0.3, 30),
    ]
)
x = np.clip(x, -24.5, 24.5)
y = np.clip(y, 0.5, 46)

distance = np.sqrt(x**2 + y**2)
make_prob = np.clip(0.65 - distance * 0.012, 0.25, 0.70)
made = np.random.random(len(x)) < make_prob

three_pt_threshold = np.where(np.abs(x) >= 22, 22.0, 23.75)
ft_mask = (np.abs(x) < 1) & (y > 14) & (y < 16)
paint_mask = (np.abs(x) < 8) & (y < 10)
mid_mask = ~paint_mask & (distance <= three_pt_threshold) & ~ft_mask
three_mask = distance > three_pt_threshold

paint_pct = np.mean(made[paint_mask]) * 100
mid_pct = np.mean(made[mid_mask]) * 100
three_pct = np.mean(made[three_mask]) * 100
overall_pct = np.mean(made) * 100

# Court shapes
court_shapes = [
    # Shadow for depth (light only)
    {
        "type": "rect",
        "x0": -24.7,
        "y0": -0.5,
        "x1": 25.3,
        "y1": 47.5,
        "line": {"width": 0},
        "fillcolor": SHADOW_CLR,
        "layer": "below",
    },
    # Court floor (warm hardwood tone)
    {
        "type": "rect",
        "x0": -25,
        "y0": 0,
        "x1": 25,
        "y1": 47,
        "line": {"color": COURT_LINE, "width": 2.5},
        "fillcolor": COURT_FLOOR,
        "layer": "below",
    },
    # Paint / key area (slightly highlighted)
    {
        "type": "rect",
        "x0": -8,
        "y0": 0,
        "x1": 8,
        "y1": 19,
        "line": {"color": COURT_LINE, "width": 2},
        "fillcolor": PAINT_FILL,
        "layer": "below",
    },
    # Backboard
    {
        "type": "line",
        "x0": -3,
        "y0": -0.5,
        "x1": 3,
        "y1": -0.5,
        "line": {"color": COURT_LINE, "width": 3},
        "layer": "below",
    },
]

# Curved court geometry
angle_3pt = np.arccos(22 / 23.75)
theta_3pt = np.linspace(angle_3pt, np.pi - angle_3pt, 200)
arc_x = 23.75 * np.cos(theta_3pt)
arc_y = 23.75 * np.sin(theta_3pt)
corner_y = 23.75 * np.sin(angle_3pt)

theta_ft_top = np.linspace(0, np.pi, 100)
ft_top_x = 6 * np.cos(theta_ft_top)
ft_top_y = 19 + 6 * np.sin(theta_ft_top)

theta_ft_bot = np.linspace(np.pi, 2 * np.pi, 100)
ft_bot_x = 6 * np.cos(theta_ft_bot)
ft_bot_y = 19 + 6 * np.sin(theta_ft_bot)

theta_ra = np.linspace(0, np.pi, 100)
ra_x = 4 * np.cos(theta_ra)
ra_y = 4 * np.sin(theta_ra)

theta_rim = np.linspace(0, 2 * np.pi, 50)
rim_x = 0.75 * np.cos(theta_rim)
rim_y = 1.25 + 0.75 * np.sin(theta_rim)

# Plot
fig = go.Figure()
cline = {"color": COURT_LINE, "width": 2}

# Three-point arc connected to corner three lines
fig.add_trace(
    go.Scatter(
        x=np.concatenate([[-22], arc_x[::-1], [22]]),
        y=np.concatenate([[0], arc_y[::-1], [0]]),
        mode="lines",
        line={"color": COURT_LINE, "width": 2.5},
        showlegend=False,
        hoverinfo="skip",
    )
)
fig.add_trace(go.Scatter(x=[-22, -22], y=[0, corner_y], mode="lines", line=cline, showlegend=False, hoverinfo="skip"))
fig.add_trace(go.Scatter(x=[22, 22], y=[0, corner_y], mode="lines", line=cline, showlegend=False, hoverinfo="skip"))

# Free-throw circle (top solid, bottom dashed)
fig.add_trace(go.Scatter(x=ft_top_x, y=ft_top_y, mode="lines", line=cline, showlegend=False, hoverinfo="skip"))
fig.add_trace(
    go.Scatter(
        x=ft_bot_x,
        y=ft_bot_y,
        mode="lines",
        line={"color": COURT_LINE, "width": 2, "dash": "dash"},
        showlegend=False,
        hoverinfo="skip",
    )
)

# Restricted area arc
fig.add_trace(go.Scatter(x=ra_x, y=ra_y, mode="lines", line=cline, showlegend=False, hoverinfo="skip"))

# Basket rim (orange — domain-appropriate structural element)
fig.add_trace(
    go.Scatter(
        x=rim_x, y=rim_y, mode="lines", line={"color": "#CC5500", "width": 2.5}, showlegend=False, hoverinfo="skip"
    )
)

# Marker sizes — slightly larger near basket for visual depth
marker_sizes = np.clip(14 - distance * 0.15, 8, 14)

# Missed shots (x markers, matte red)
missed_mask = ~made
fig.add_trace(
    go.Scatter(
        x=x[missed_mask],
        y=y[missed_mask],
        mode="markers",
        marker={
            "size": marker_sizes[missed_mask],
            "color": MISS_CLR,
            "symbol": "x",
            "line": {"width": 1.5, "color": MISS_CLR},
            "opacity": 0.7,
        },
        name="Missed",
        hovertemplate="x: %{x:.1f} ft<br>y: %{y:.1f} ft<br>Missed<extra></extra>",
    )
)

# Made shots (circle markers, brand green)
fig.add_trace(
    go.Scatter(
        x=x[made],
        y=y[made],
        mode="markers",
        marker={
            "size": marker_sizes[made],
            "color": BRAND,
            "symbol": "circle",
            "line": {"width": 1.2, "color": PAGE_BG},
            "opacity": 0.8,
        },
        name="Made",
        hovertemplate="x: %{x:.1f} ft<br>y: %{y:.1f} ft<br>Made<extra></extra>",
    )
)

# Zone shooting percentage annotations (data storytelling)
ann_font = {"size": 18, "color": INK, "family": "Arial, sans-serif"}
for xp, yp, txt in [
    (0, 5, f"Paint<br><b>{paint_pct:.0f}%</b>"),
    (13, 12, f"Mid<br><b>{mid_pct:.0f}%</b>"),
    (0, 34, f"3-Point<br><b>{three_pct:.0f}%</b>"),
]:
    fig.add_annotation(
        x=xp,
        y=yp,
        text=txt,
        showarrow=False,
        font=ann_font,
        bgcolor=ANN_BG,
        borderpad=6,
        bordercolor=INK_SOFT,
        borderwidth=1,
    )

# Style
title_text = "scatter-shot-chart · python · plotly · anyplot.ai"  # 49 chars < 67 baseline
subtitle = (
    f"{int(np.sum(made))}/{len(made)} made ({overall_pct:.1f}% FG)"
    f" · Paint {paint_pct:.0f}% · Mid {mid_pct:.0f}% · 3PT {three_pct:.0f}%"
)

fig.update_layout(
    autosize=False,
    width=600,
    height=600,
    margin={"l": 40, "r": 40, "t": 110, "b": 40},
    paper_bgcolor=PAGE_BG,
    plot_bgcolor=PAGE_BG,
    title={
        "text": f"{title_text}<br><span style='font-size:12px;color:{INK_SOFT}'>{subtitle}</span>",
        "font": {"size": 16, "color": INK, "family": "Arial, sans-serif"},
        "x": 0.5,
        "xanchor": "center",
    },
    xaxis={
        "range": [-28, 28],
        "showgrid": False,
        "zeroline": False,
        "showticklabels": False,
        "showline": False,
        "scaleanchor": "y",
        "scaleratio": 1,
    },
    yaxis={"range": [-3, 50], "showgrid": False, "zeroline": False, "showticklabels": False, "showline": False},
    shapes=court_shapes,
    legend={
        "font": {"size": 14, "color": INK_SOFT, "family": "Arial, sans-serif"},
        "x": 0.85,
        "y": 0.97,
        "bgcolor": ELEVATED_BG,
        "bordercolor": INK_SOFT,
        "borderwidth": 1,
        "itemsizing": "constant",
    },
)

# Save
fig.write_image(f"plot-{THEME}.png", width=600, height=600, scale=4)
fig.write_html(f"plot-{THEME}.html", include_plotlyjs="cdn")
Runnable source as JSON, for any HTTP client: https://api.anyplot.ai/specs/scatter-shot-chart/plotly/code. Any spec id and library id listed in llms-full.txt fit the same URL shape; every URL below is complete and callable.
{
  "spec_id": "scatter-shot-chart",
  "language": "python",
  "library": "plotly",
  "page": "https://anyplot.ai/scatter-shot-chart/python/plotly",
  "hub": "https://anyplot.ai/scatter-shot-chart",
  "code_json": "https://api.anyplot.ai/specs/scatter-shot-chart/plotly/code",
  "spec_json": "https://api.anyplot.ai/specs/scatter-shot-chart",
  "render_light_png": "https://storage.googleapis.com/anyplot-images/plots/scatter-shot-chart/python/plotly/plot-light.png",
  "render_dark_png": "https://storage.googleapis.com/anyplot-images/plots/scatter-shot-chart/python/plotly/plot-dark.png",
  "interactive_light_html": "https://storage.googleapis.com/anyplot-images/plots/scatter-shot-chart/python/plotly/plot-light.html",
  "interactive_dark_html": "https://storage.googleapis.com/anyplot-images/plots/scatter-shot-chart/python/plotly/plot-dark.html",
  "quality_score": 91.0,
  "license": "MIT",
  "guide": "https://anyplot.ai/llms.txt"
}
Part of Basketball Shot Chart on anyplot.ai.