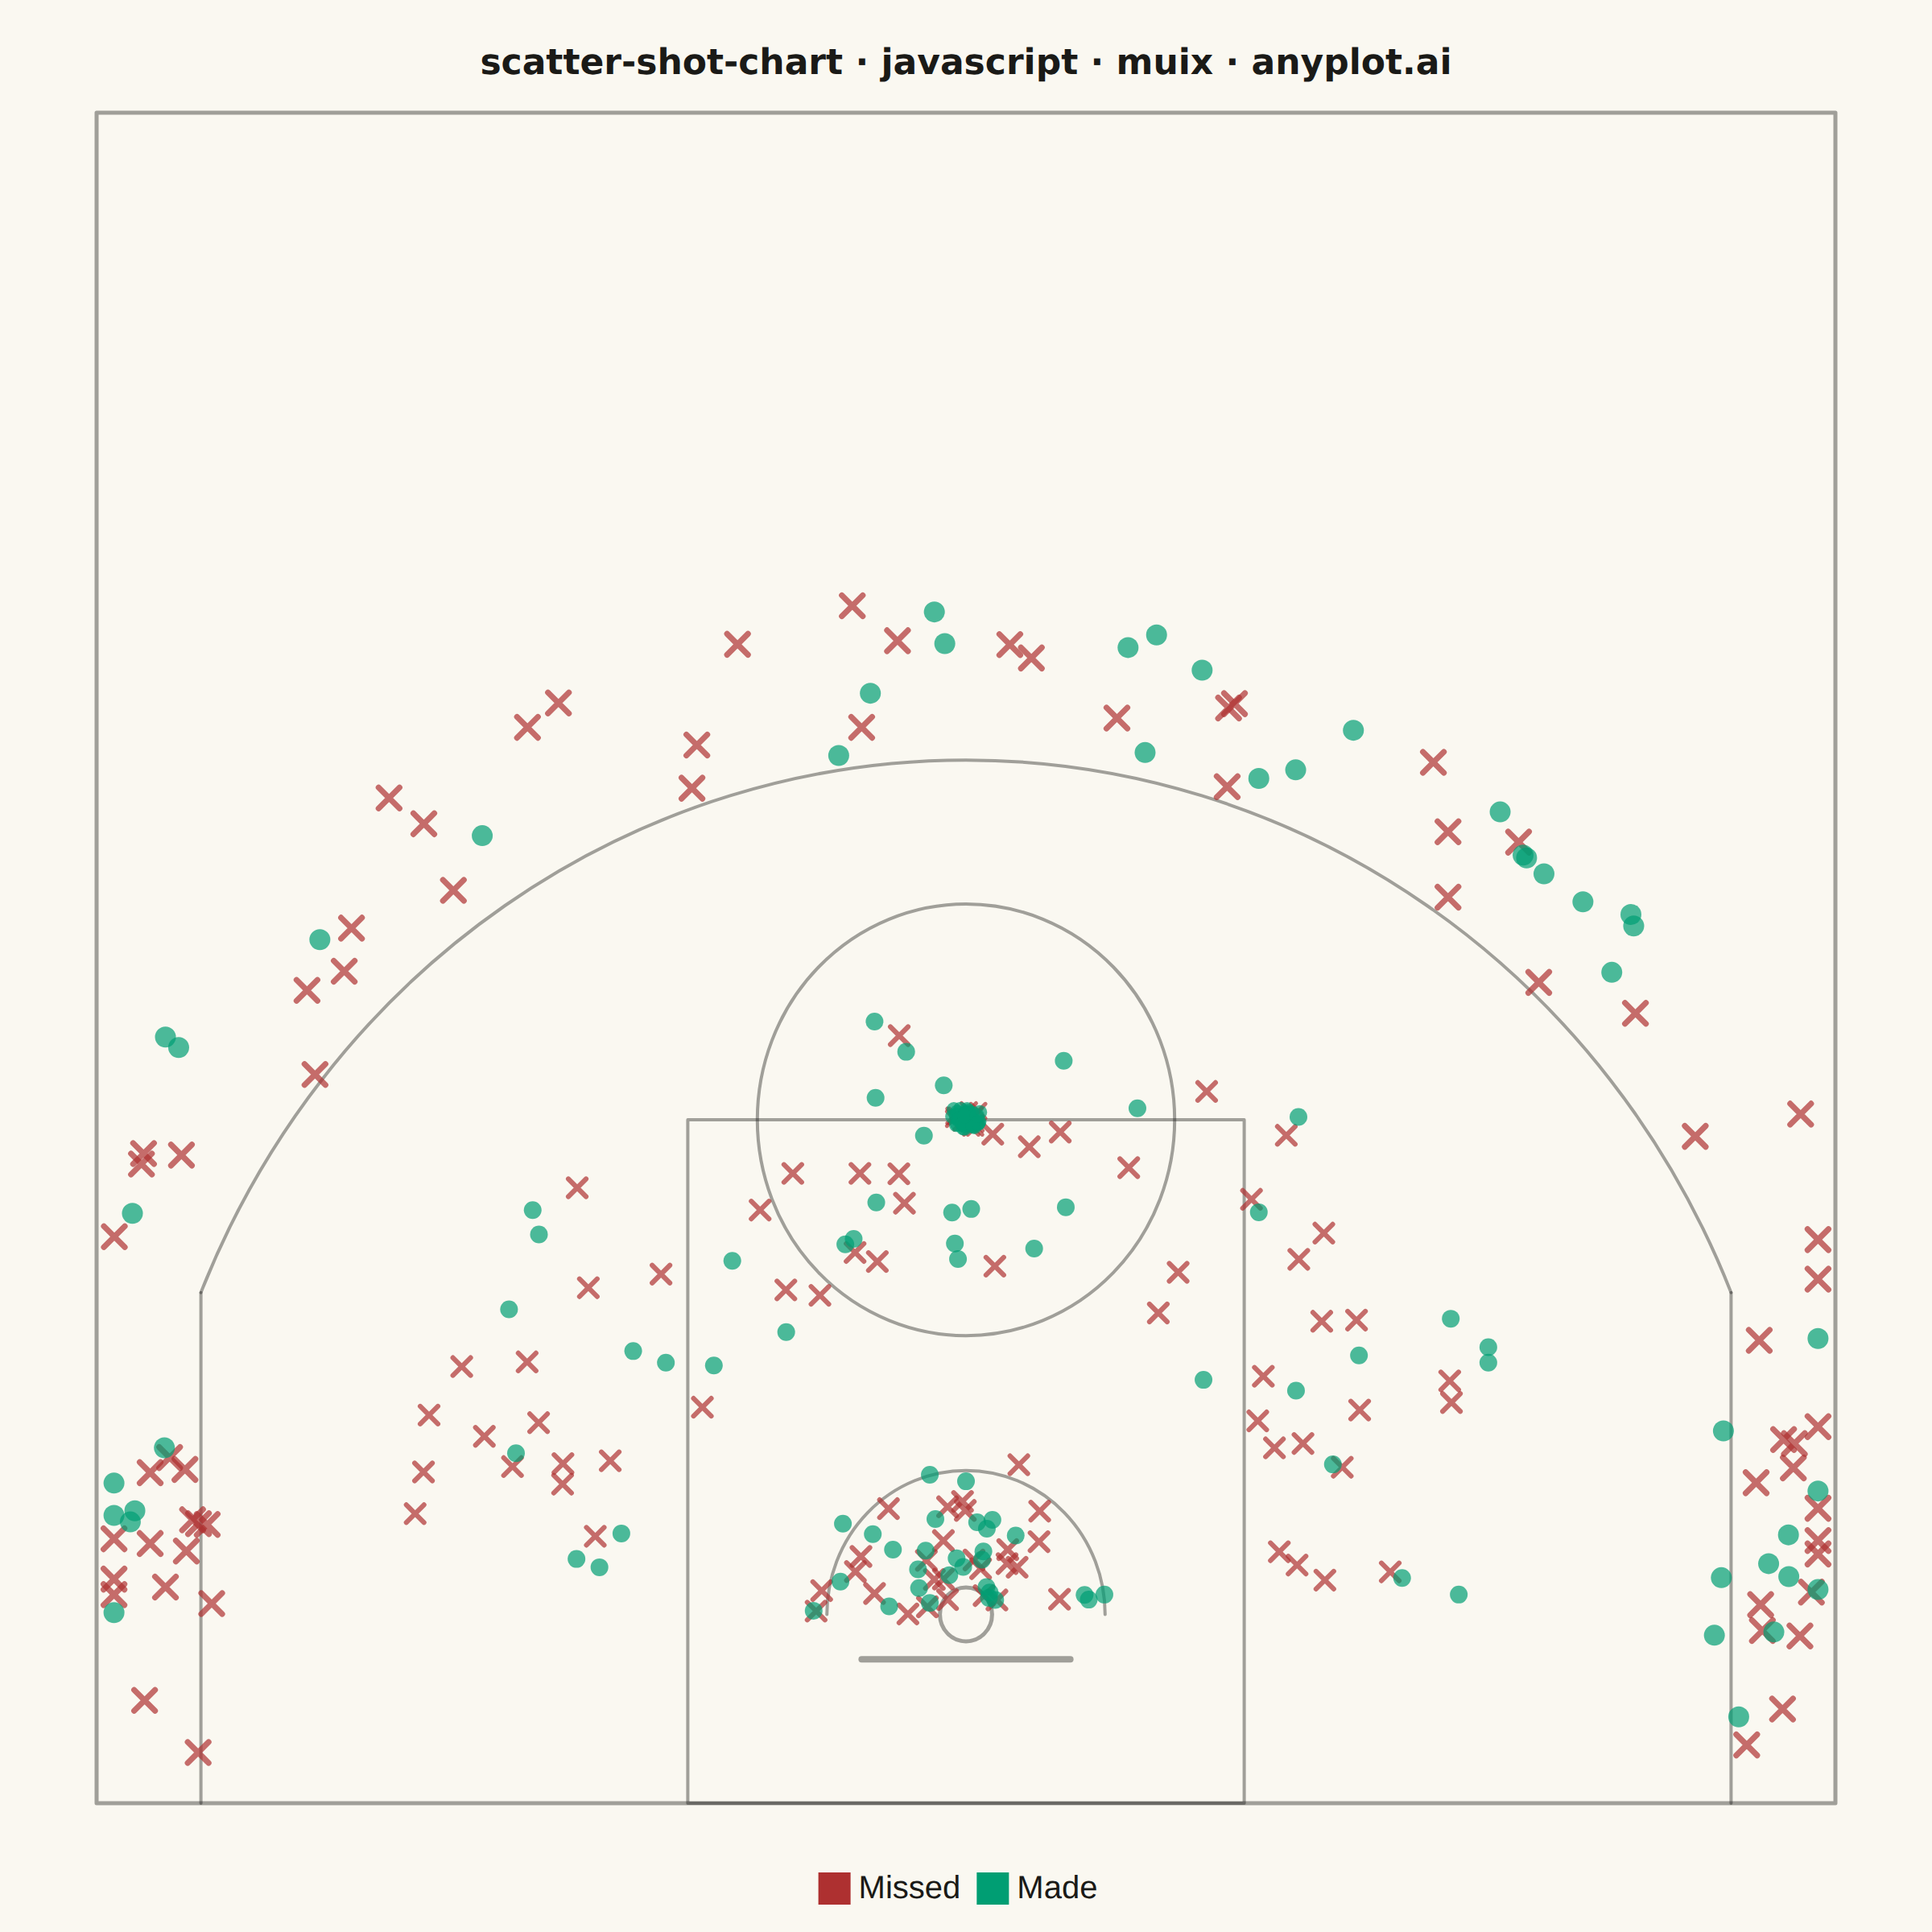
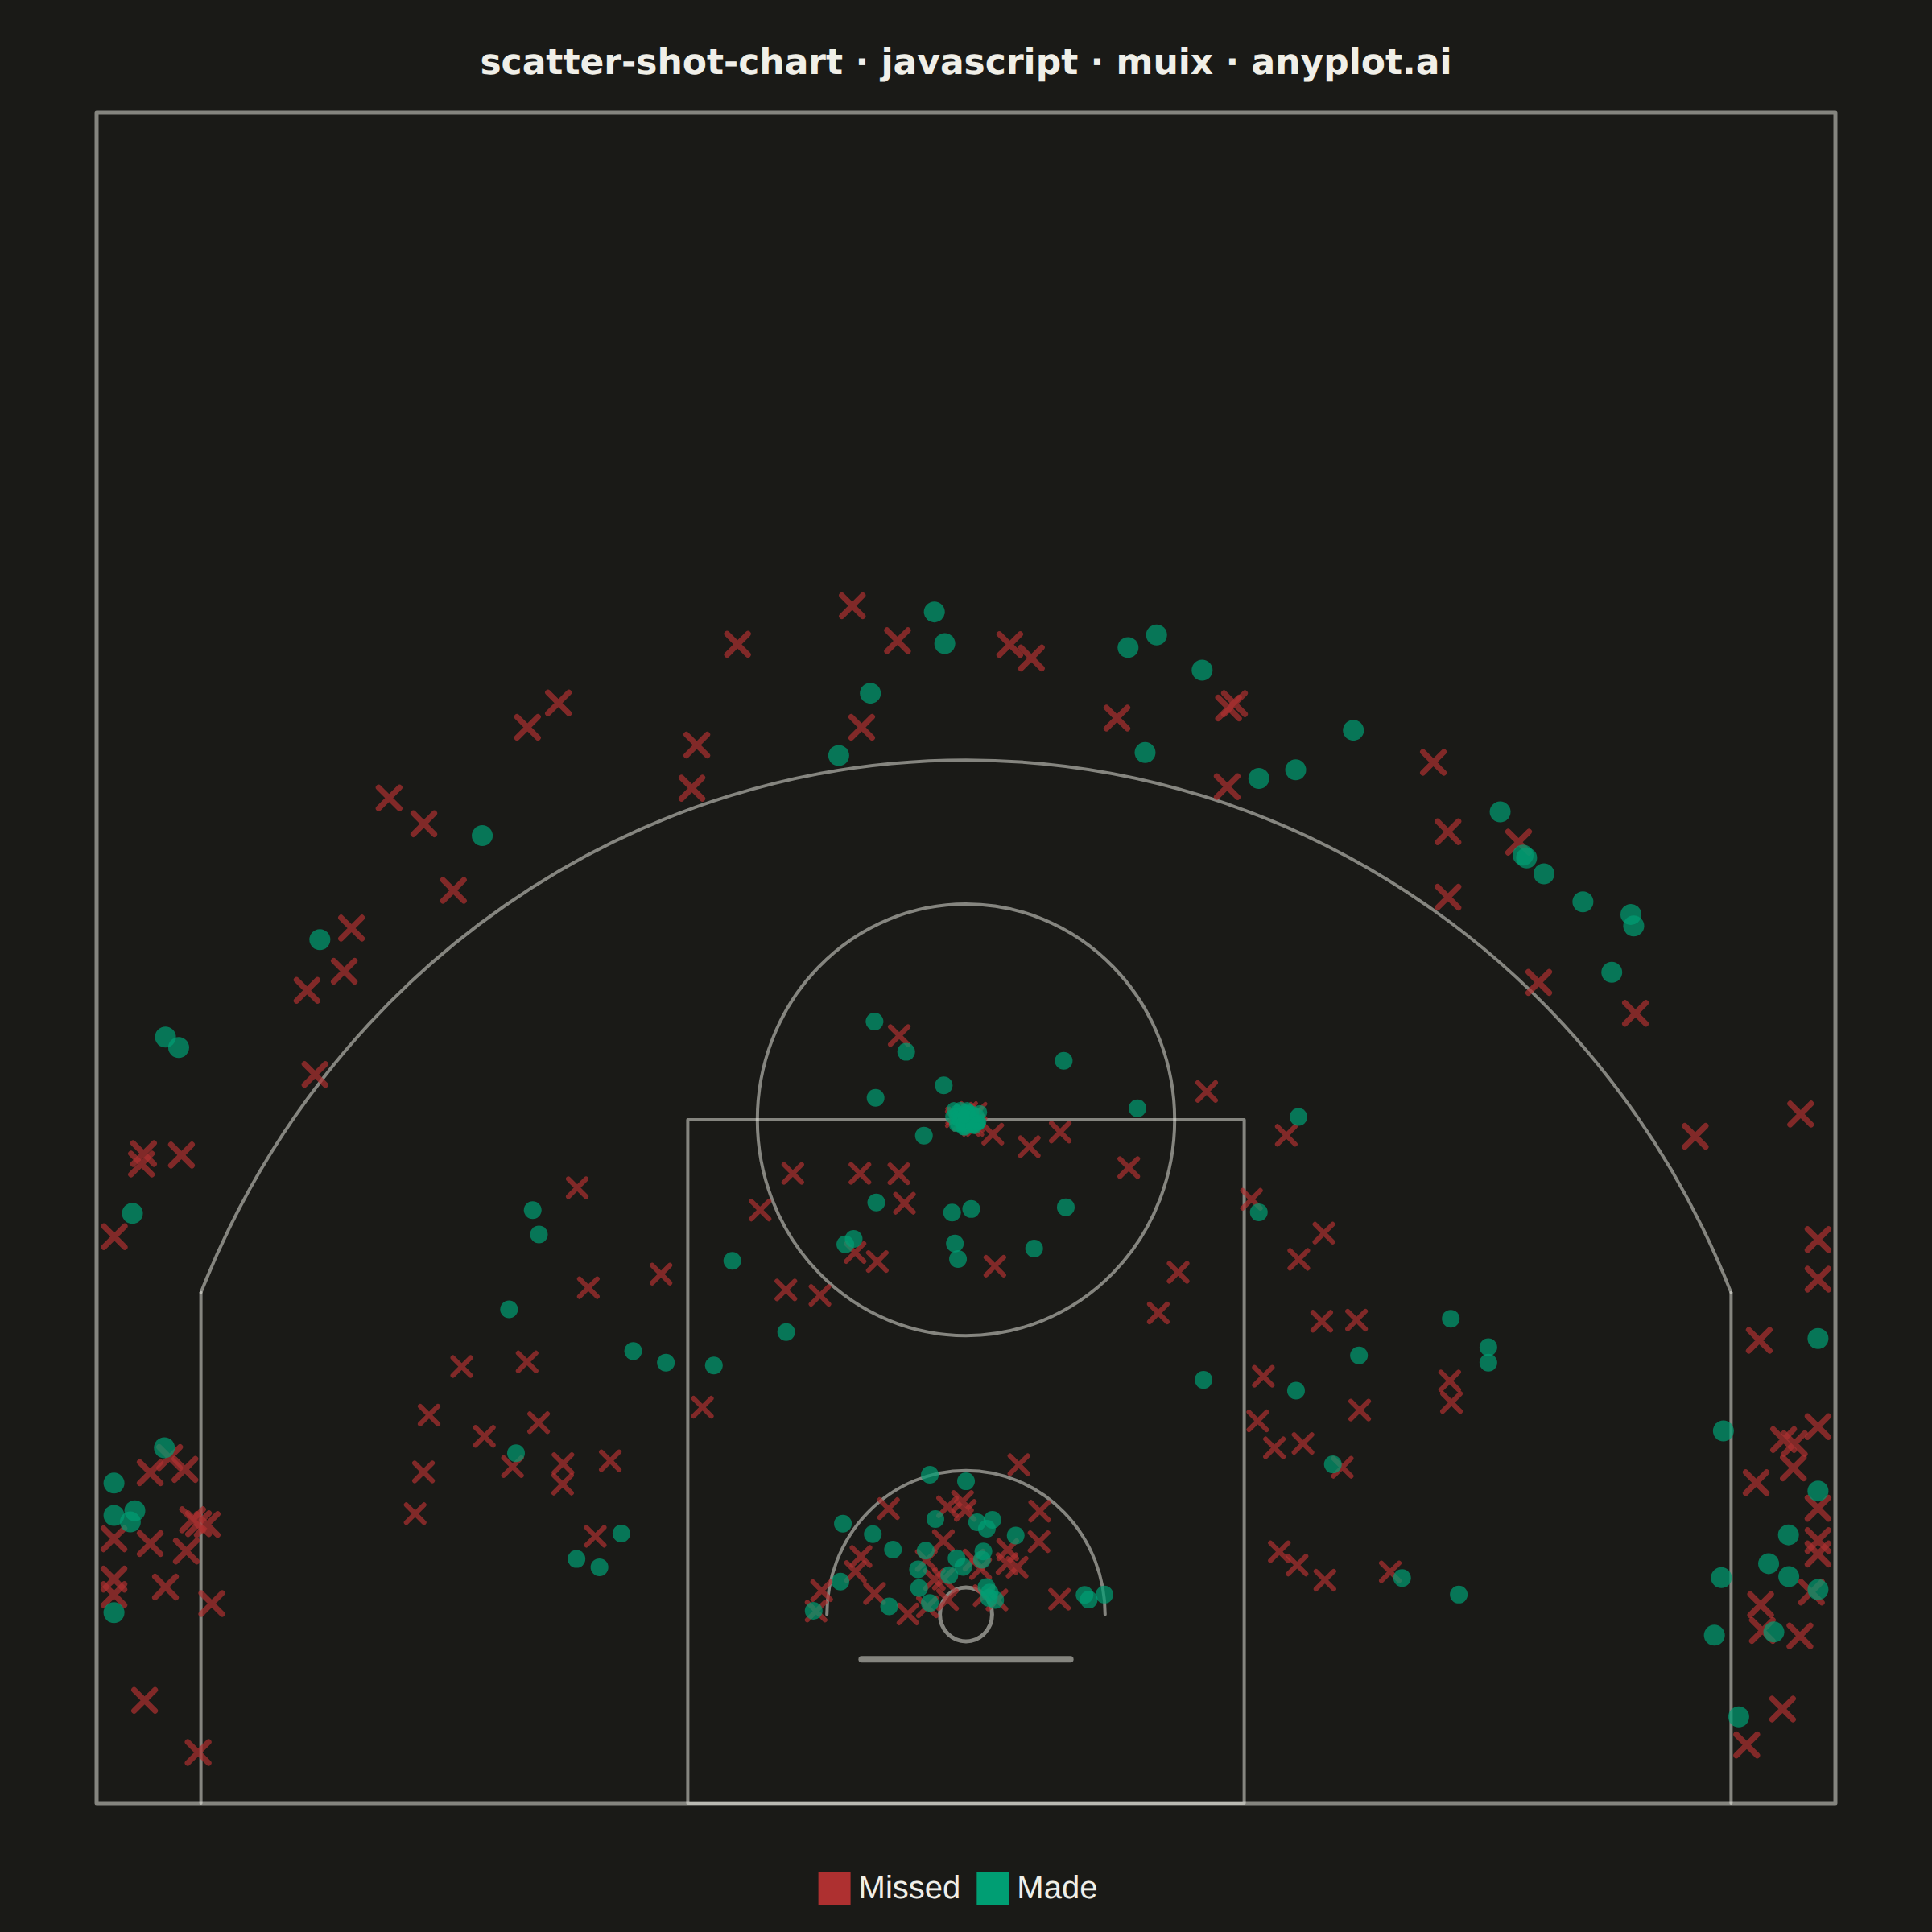
The same plot in 14 other libraries — JavaScript: Chart.js, D3.js, Apache ECharts, Highcharts; Python: Altair, Bokeh, lets-plot, Matplotlib, Plotly, plotnine, Pygal, Seaborn; R: ggplot2; Julia: Makie.jl. Compare all 15 side by side: Basketball Shot Chart in Python, R, Julia and JavaScript.
A basketball shot chart overlays shooting data on a half-court diagram, plotting each shot attempt as a point colored by outcome (made or missed). The court drawing includes the three-point arc, free-throw line, paint/key area, and basket, providing spatial context for analyzing shooting patterns and efficiency. Essential for basketball analytics and player evaluation.
// anyplot.ai
// scatter-shot-chart: Basketball Shot Chart
// Library: muix 7.29.1 | JavaScript 22.22.3
// Quality: 89/100 | Created: 2026-06-21
//# anyplot-orientation: square
// anyplot.ai
// scatter-shot-chart: Basketball Shot Chart
// Library: MUI X Charts | React | Node 22
// License: @mui/x-charts — MIT (community). Pro/Premium are out of scope.
// Quality: pending | Created: 2026-06-21

import * as React from "react";
import { ChartContainer } from "@mui/x-charts/ChartContainer";
import { ChartsLegend } from "@mui/x-charts/ChartsLegend";
import { useDrawingArea } from "@mui/x-charts/hooks";

const t = window.ANYPLOT_TOKENS;
const THEME = window.ANYPLOT_THEME;
const COURT_STROKE =
  THEME === "light" ? "rgba(26,26,23,0.40)" : "rgba(240,239,232,0.50)";

// --- Deterministic shot data (LCG seed=42) ------------------------------------
function makeLCG(seed) {
  let s = seed >>> 0;
  return function () {
    s = (Math.imul(1664525, s) + 1013904223) >>> 0;
    return s / 4294967296;
  };
}

// NBA half-court: x ∈ [-25, 25] ft, y ∈ [0, 47] ft (y=0 baseline)
const BASKET_Y = 5.25;
const THREE_PT_R = 23.75;
const CORNER_X = 22;
const CORNER_TOP_Y = BASKET_Y + Math.sqrt(THREE_PT_R ** 2 - CORNER_X ** 2);

function generateShots() {
  const rng = makeLCG(42);
  const shots = [];

  for (let i = 0; i < 300; i++) {
    const zone = rng();
    let x, y, shot_type;

    if (zone < 0.20) {
      // At the rim / paint close range
      const angle = rng() * Math.PI;
      const dist = rng() * 4 + 0.5;
      x = Math.cos(angle) * dist;
      y = BASKET_Y + Math.abs(Math.sin(angle)) * dist;
      shot_type = "2-pointer";
    } else if (zone < 0.25) {
      // Left corner three
      x = -(rng() * 2.5 + 21.5);
      y = rng() * 10 + 0.5;
      shot_type = "3-pointer";
    } else if (zone < 0.30) {
      // Right corner three
      x = rng() * 2.5 + 21.5;
      y = rng() * 10 + 0.5;
      shot_type = "3-pointer";
    } else if (zone < 0.58) {
      // Mid-range (inside three-point line)
      const angle = rng() * Math.PI;
      const dist = rng() * 8 + 9;
      x = Math.cos(angle) * dist;
      y = BASKET_Y + Math.sin(angle) * dist;
      if (y < 0.5) y = 0.5 + rng() * 2;
      const d = Math.sqrt(x ** 2 + (y - BASKET_Y) ** 2);
      if (d > 22) {
        x = (x / d) * 21.5;
        y = BASKET_Y + ((y - BASKET_Y) / d) * 21.5;
      }
      shot_type = "2-pointer";
    } else if (zone < 0.85) {
      // Arc three-pointers
      const angle = rng() * Math.PI;
      const dist = rng() * 4.5 + THREE_PT_R;
      x = Math.cos(angle) * dist;
      y = BASKET_Y + Math.sin(angle) * dist;
      if (y < 0.5) y = 0.5 + rng() * 2;
      if (y > 44) y = 44;
      x = Math.max(-24.5, Math.min(24.5, x));
      shot_type = "3-pointer";
    } else {
      // Free throw (~15% of attempts, at the free-throw line ~19 ft from baseline)
      x = rng() * 0.8 - 0.4;
      y = 19 + rng() * 0.6 - 0.3;
      shot_type = "free-throw";
    }

    const d = Math.sqrt(x ** 2 + (y - BASKET_Y) ** 2);
    const makePct =
      shot_type === "free-throw"
        ? 0.78
        : shot_type === "3-pointer"
        ? 0.37
        : d < 7
        ? 0.60
        : 0.41;
    const made = rng() < makePct;

    shots.push({
      id: i,
      x: parseFloat(x.toFixed(2)),
      y: parseFloat(y.toFixed(2)),
      made,
      shot_type,
    });
  }
  return shots;
}

const allShots = generateShots();
const madeShots = allShots.filter((s) => s.made).map((s) => ({ id: s.id, x: s.x, y: s.y }));
const missedShots = allShots.filter((s) => !s.made).map((s) => ({ id: s.id, x: s.x, y: s.y }));

const X_MIN = -25, X_MAX = 25, Y_MIN = 0, Y_MAX = 47;

// Marker radius varies by shot type to encode the third data dimension
function markerRadius(shot_type) {
  if (shot_type === "free-throw") return 4.5;
  if (shot_type === "3-pointer") return 6.5;
  return 5.5; // 2-pointer
}

// --- Custom shot markers: ○ circles for made, × marks for missed -------------
// Shape encoding provides color-blind-safe redundancy for made/missed outcome
function ShotMarkers() {
  const { left, top, width, height } = useDrawingArea();
  const scX = (ft) => left + ((ft - X_MIN) / (X_MAX - X_MIN)) * width;
  const scY = (ft) => top + ((Y_MAX - ft) / (Y_MAX - Y_MIN)) * height;

  return (
    <g>
      {/* Missed shots: × marks in red (rendered first, under made shots) */}
      {allShots
        .filter((s) => !s.made)
        .map((shot) => {
          const sx = scX(shot.x);
          const sy = scY(shot.y);
          const r = markerRadius(shot.shot_type);
          return (
            <path
              key={shot.id}
              d={`M ${sx - r} ${sy - r} L ${sx + r} ${sy + r} M ${sx + r} ${sy - r} L ${sx - r} ${sy + r}`}
              stroke="#AE3030"
              strokeWidth={r * 0.55}
              strokeOpacity={0.7}
              strokeLinecap="round"
            />
          );
        })}
      {/* Made shots: filled circles in green */}
      {allShots
        .filter((s) => s.made)
        .map((shot) => {
          const sx = scX(shot.x);
          const sy = scY(shot.y);
          const r = markerRadius(shot.shot_type);
          return (
            <circle
              key={shot.id}
              cx={sx}
              cy={sy}
              r={r}
              fill="#009E73"
              fillOpacity={0.7}
            />
          );
        })}
    </g>
  );
}

// --- Basketball court SVG overlay (accurate NBA half-court dimensions) --------
function BasketballCourt() {
  const { left, top, width, height } = useDrawingArea();
  const cx = (ft) => left + ((ft - X_MIN) / (X_MAX - X_MIN)) * width;
  const cy = (ft) => top + ((Y_MAX - ft) / (Y_MAX - Y_MIN)) * height;

  const threeR_x = (THREE_PT_R / (X_MAX - X_MIN)) * width;
  const threeR_y = (THREE_PT_R / (Y_MAX - Y_MIN)) * height;
  const ftCircR = (6 / (X_MAX - X_MIN)) * width;
  const raR_x = (4 / (X_MAX - X_MIN)) * width;
  const raR_y = (4 / (Y_MAX - Y_MIN)) * height;
  const basketR = (0.75 / (X_MAX - X_MIN)) * width;

  const ls = {
    fill: "none",
    stroke: COURT_STROKE,
    strokeWidth: 2,
    strokeLinecap: "round" as const,
    strokeLinejoin: "round" as const,
  };

  return (
    <g>
      {/* Court boundary (baseline + sidelines + half-court line) */}
      <rect
        x={cx(-25)}
        y={cy(47)}
        width={cx(25) - cx(-25)}
        height={cy(0) - cy(47)}
        style={{ ...ls, strokeWidth: 2.5 }}
      />
      {/* Paint / key area */}
      <rect
        x={cx(-8)}
        y={cy(19)}
        width={cx(8) - cx(-8)}
        height={cy(0) - cy(19)}
        style={ls}
      />
      {/* Free throw circle */}
      <ellipse
        cx={cx(0)}
        cy={cy(19)}
        rx={ftCircR}
        ry={(6 / (Y_MAX - Y_MIN)) * height}
        style={ls}
      />
      {/* Restricted area arc (semicircle above baseline) */}
      <path
        d={`M ${cx(-4)} ${cy(BASKET_Y)} A ${raR_x} ${raR_y} 0 0 1 ${cx(4)} ${cy(BASKET_Y)}`}
        style={ls}
      />
      {/* Corner three-point straight lines */}
      <line
        x1={cx(-CORNER_X)}
        y1={cy(0)}
        x2={cx(-CORNER_X)}
        y2={cy(CORNER_TOP_Y)}
        style={ls}
      />
      <line
        x1={cx(CORNER_X)}
        y1={cy(0)}
        x2={cx(CORNER_X)}
        y2={cy(CORNER_TOP_Y)}
        style={ls}
      />
      {/* Three-point arc (large-arc=0, sweep=1 → curves toward half-court) */}
      <path
        d={`M ${cx(-CORNER_X)} ${cy(CORNER_TOP_Y)} A ${threeR_x} ${threeR_y} 0 0 1 ${cx(CORNER_X)} ${cy(CORNER_TOP_Y)}`}
        style={ls}
      />
      {/* Backboard */}
      <line
        x1={cx(-3)}
        y1={cy(4)}
        x2={cx(3)}
        y2={cy(4)}
        style={{ ...ls, strokeWidth: 4 }}
      />
      {/* Basket rim */}
      <ellipse
        cx={cx(0)}
        cy={cy(BASKET_Y)}
        rx={basketR}
        ry={(0.75 / (Y_MAX - Y_MIN)) * height}
        style={{ ...ls, strokeWidth: 2.5 }}
      />
    </g>
  );
}

// --- Chart title as SVG text above the drawing area --------------------------
function ChartTitle() {
  const { left, top, width } = useDrawingArea();
  return (
    <text
      x={left + width / 2}
      y={top - 24}
      textAnchor="middle"
      style={{
        fontSize: 22,
        fontWeight: 600,
        fontFamily: "Inter, system-ui, -apple-system, sans-serif",
        fill: t.ink,
      }}
    >
      scatter-shot-chart · javascript · muix · anyplot.ai
    </text>
  );
}

// --- Main chart component ----------------------------------------------------
export default function Chart() {
  const W = window.ANYPLOT_SIZE.width;
  const H = window.ANYPLOT_SIZE.height;

  return (
    <ChartContainer
      width={W}
      height={H}
      skipAnimation
      series={[
        {
          type: "scatter",
          id: "missed",
          label: "Missed",
          data: missedShots,
          color: "#AE3030",
        },
        {
          type: "scatter",
          id: "made",
          label: "Made",
          data: madeShots,
          color: "#009E73",
        },
      ]}
      xAxis={[{ min: X_MIN, max: X_MAX }]}
      yAxis={[{ min: Y_MIN, max: Y_MAX }]}
      margin={{ top: 70, bottom: 80, left: 60, right: 60 }}
    >
      <BasketballCourt />
      <ShotMarkers />
      <ChartsLegend
        position={{ vertical: "bottom", horizontal: "middle" }}
        slotProps={{
          legend: {
            direction: "row",
            itemMarkWidth: 20,
            itemMarkHeight: 20,
            padding: 12,
            labelStyle: {
              fontSize: 20,
              fill: t.ink,
            },
          },
        }}
      />
      <ChartTitle />
    </ChartContainer>
  );
}
Runnable source as JSON, for any HTTP client: https://api.anyplot.ai/specs/scatter-shot-chart/muix/code. Any spec id and library id listed in llms-full.txt fit the same URL shape; every URL below is complete and callable.
{
  "spec_id": "scatter-shot-chart",
  "language": "javascript",
  "library": "muix",
  "page": "https://anyplot.ai/scatter-shot-chart/javascript/muix",
  "hub": "https://anyplot.ai/scatter-shot-chart",
  "code_json": "https://api.anyplot.ai/specs/scatter-shot-chart/muix/code",
  "spec_json": "https://api.anyplot.ai/specs/scatter-shot-chart",
  "render_light_png": "https://storage.googleapis.com/anyplot-images/plots/scatter-shot-chart/javascript/muix/plot-light.png",
  "render_dark_png": "https://storage.googleapis.com/anyplot-images/plots/scatter-shot-chart/javascript/muix/plot-dark.png",
  "interactive_light_html": "https://storage.googleapis.com/anyplot-images/plots/scatter-shot-chart/javascript/muix/plot-light.html",
  "interactive_dark_html": "https://storage.googleapis.com/anyplot-images/plots/scatter-shot-chart/javascript/muix/plot-dark.html",
  "quality_score": 89.0,
  "license": "MIT",
  "guide": "https://anyplot.ai/llms.txt"
}
Part of Basketball Shot Chart on anyplot.ai.