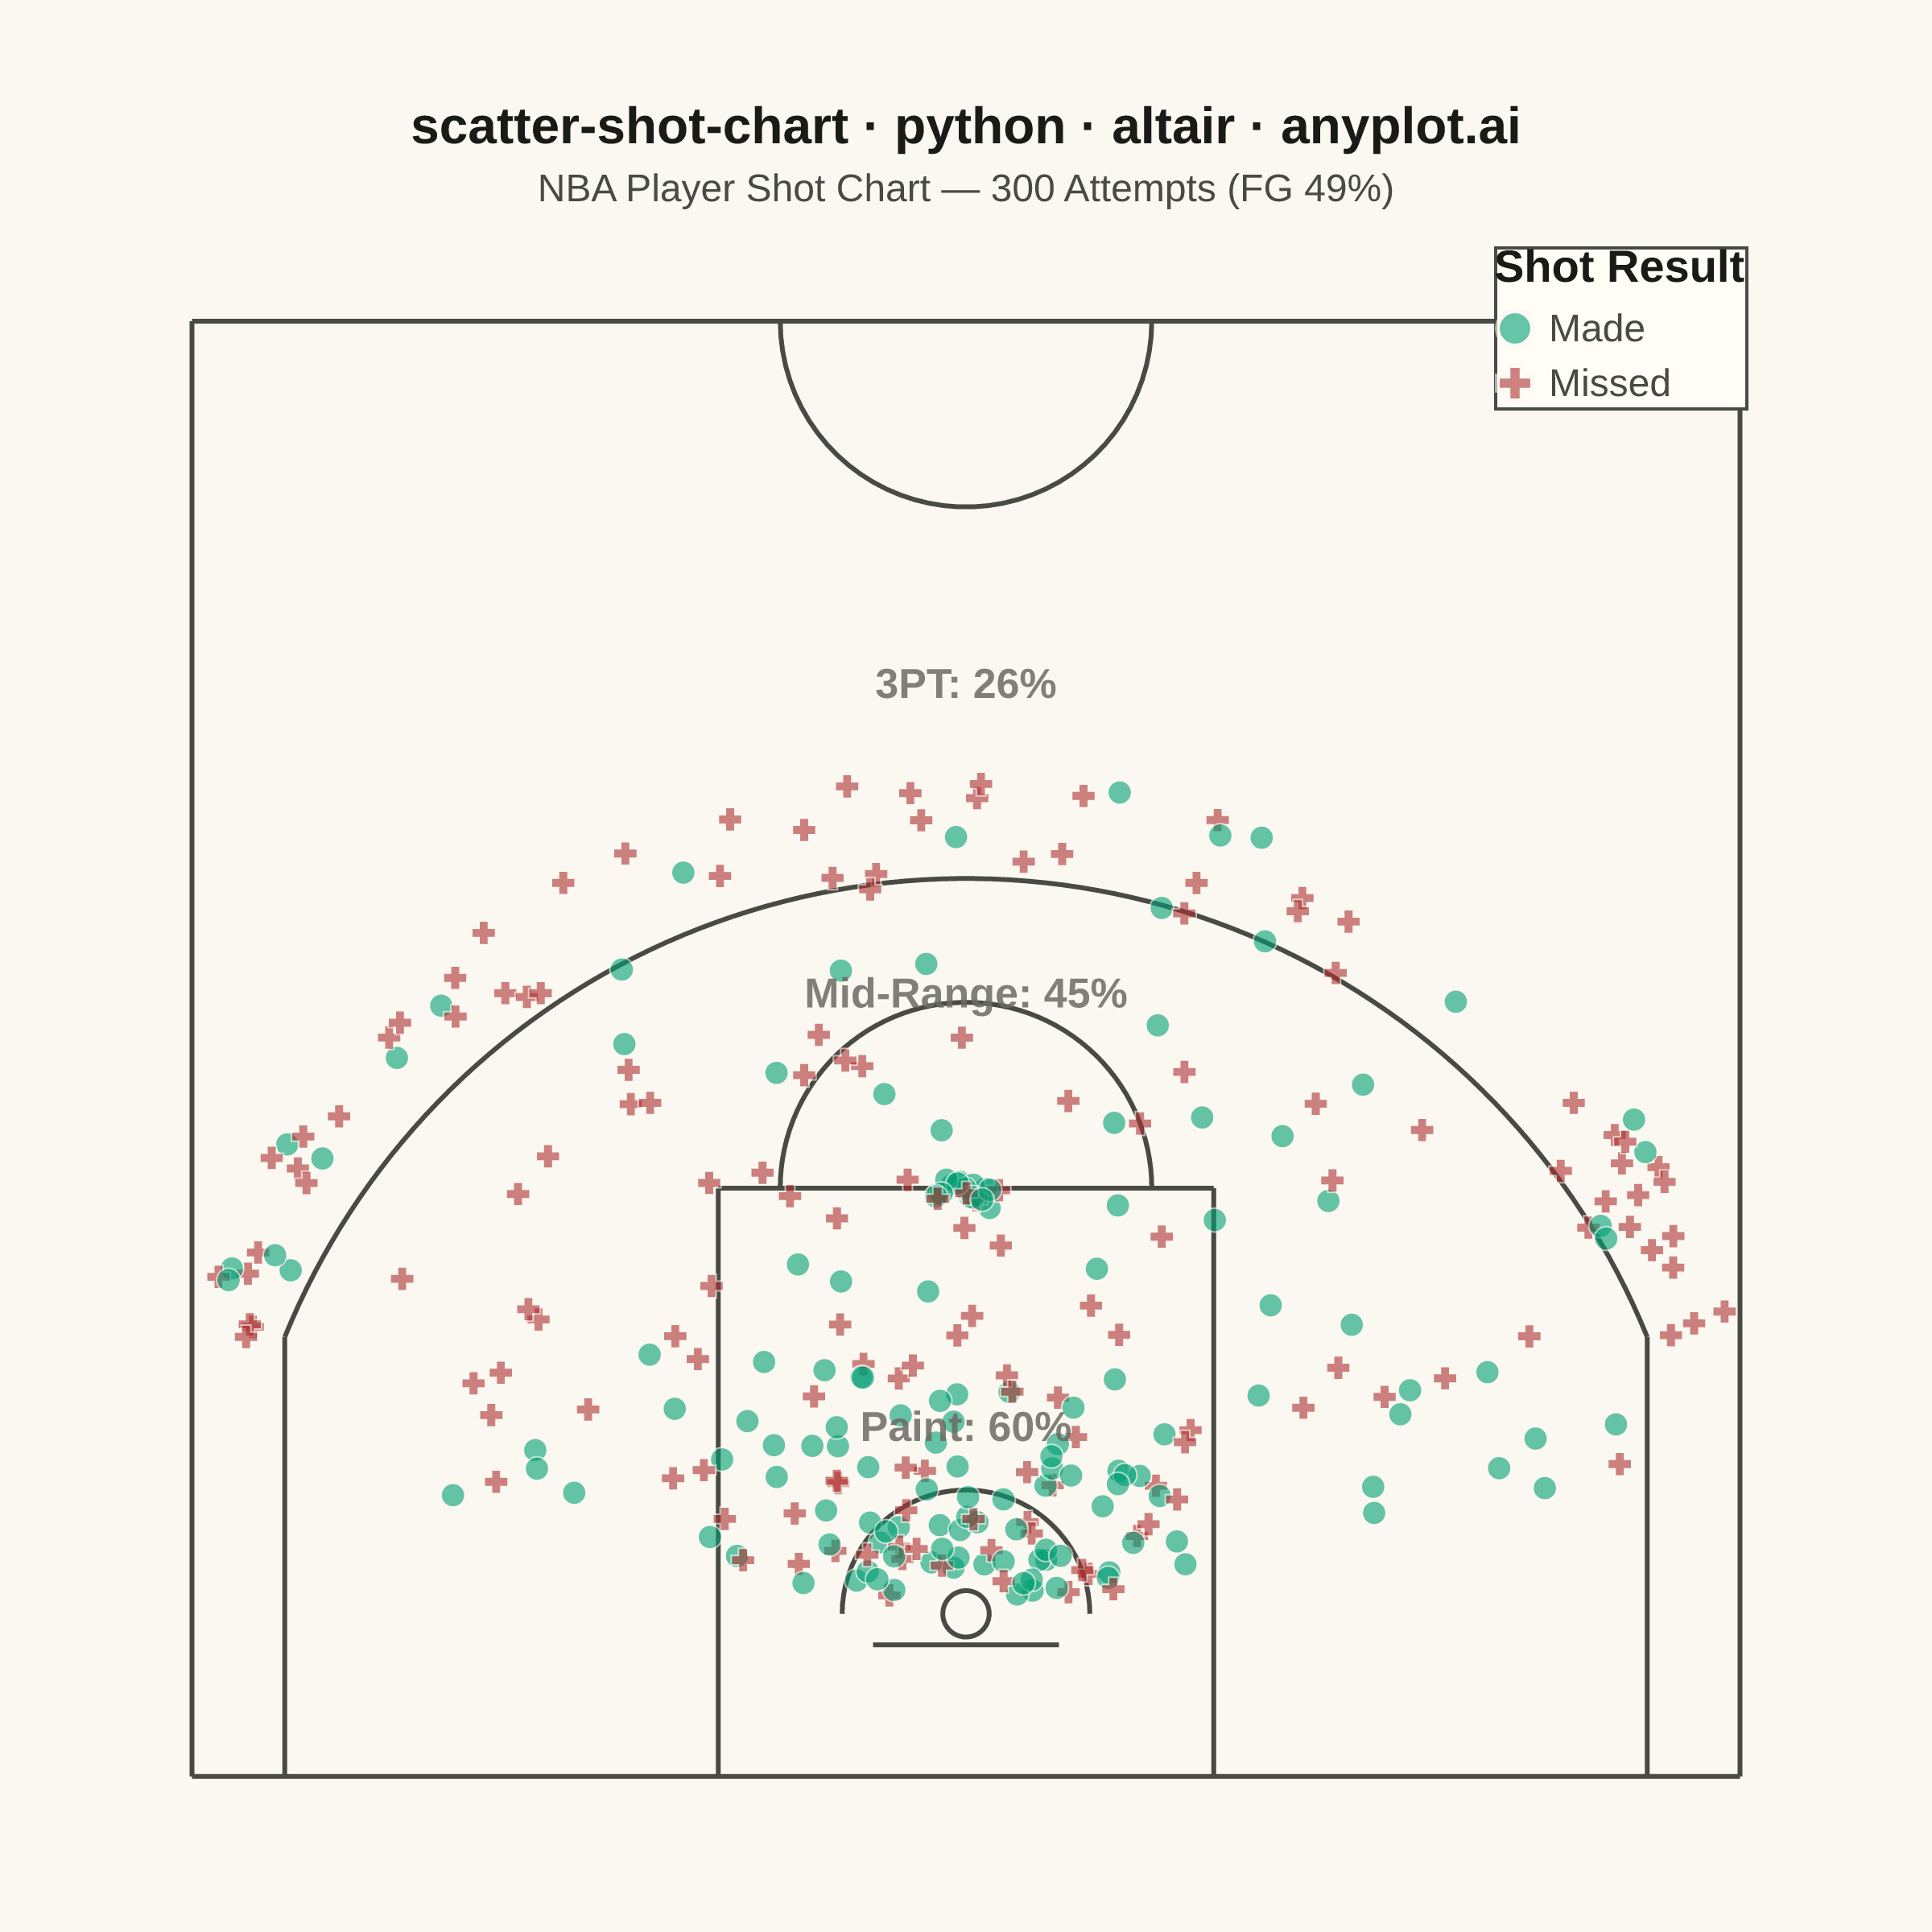
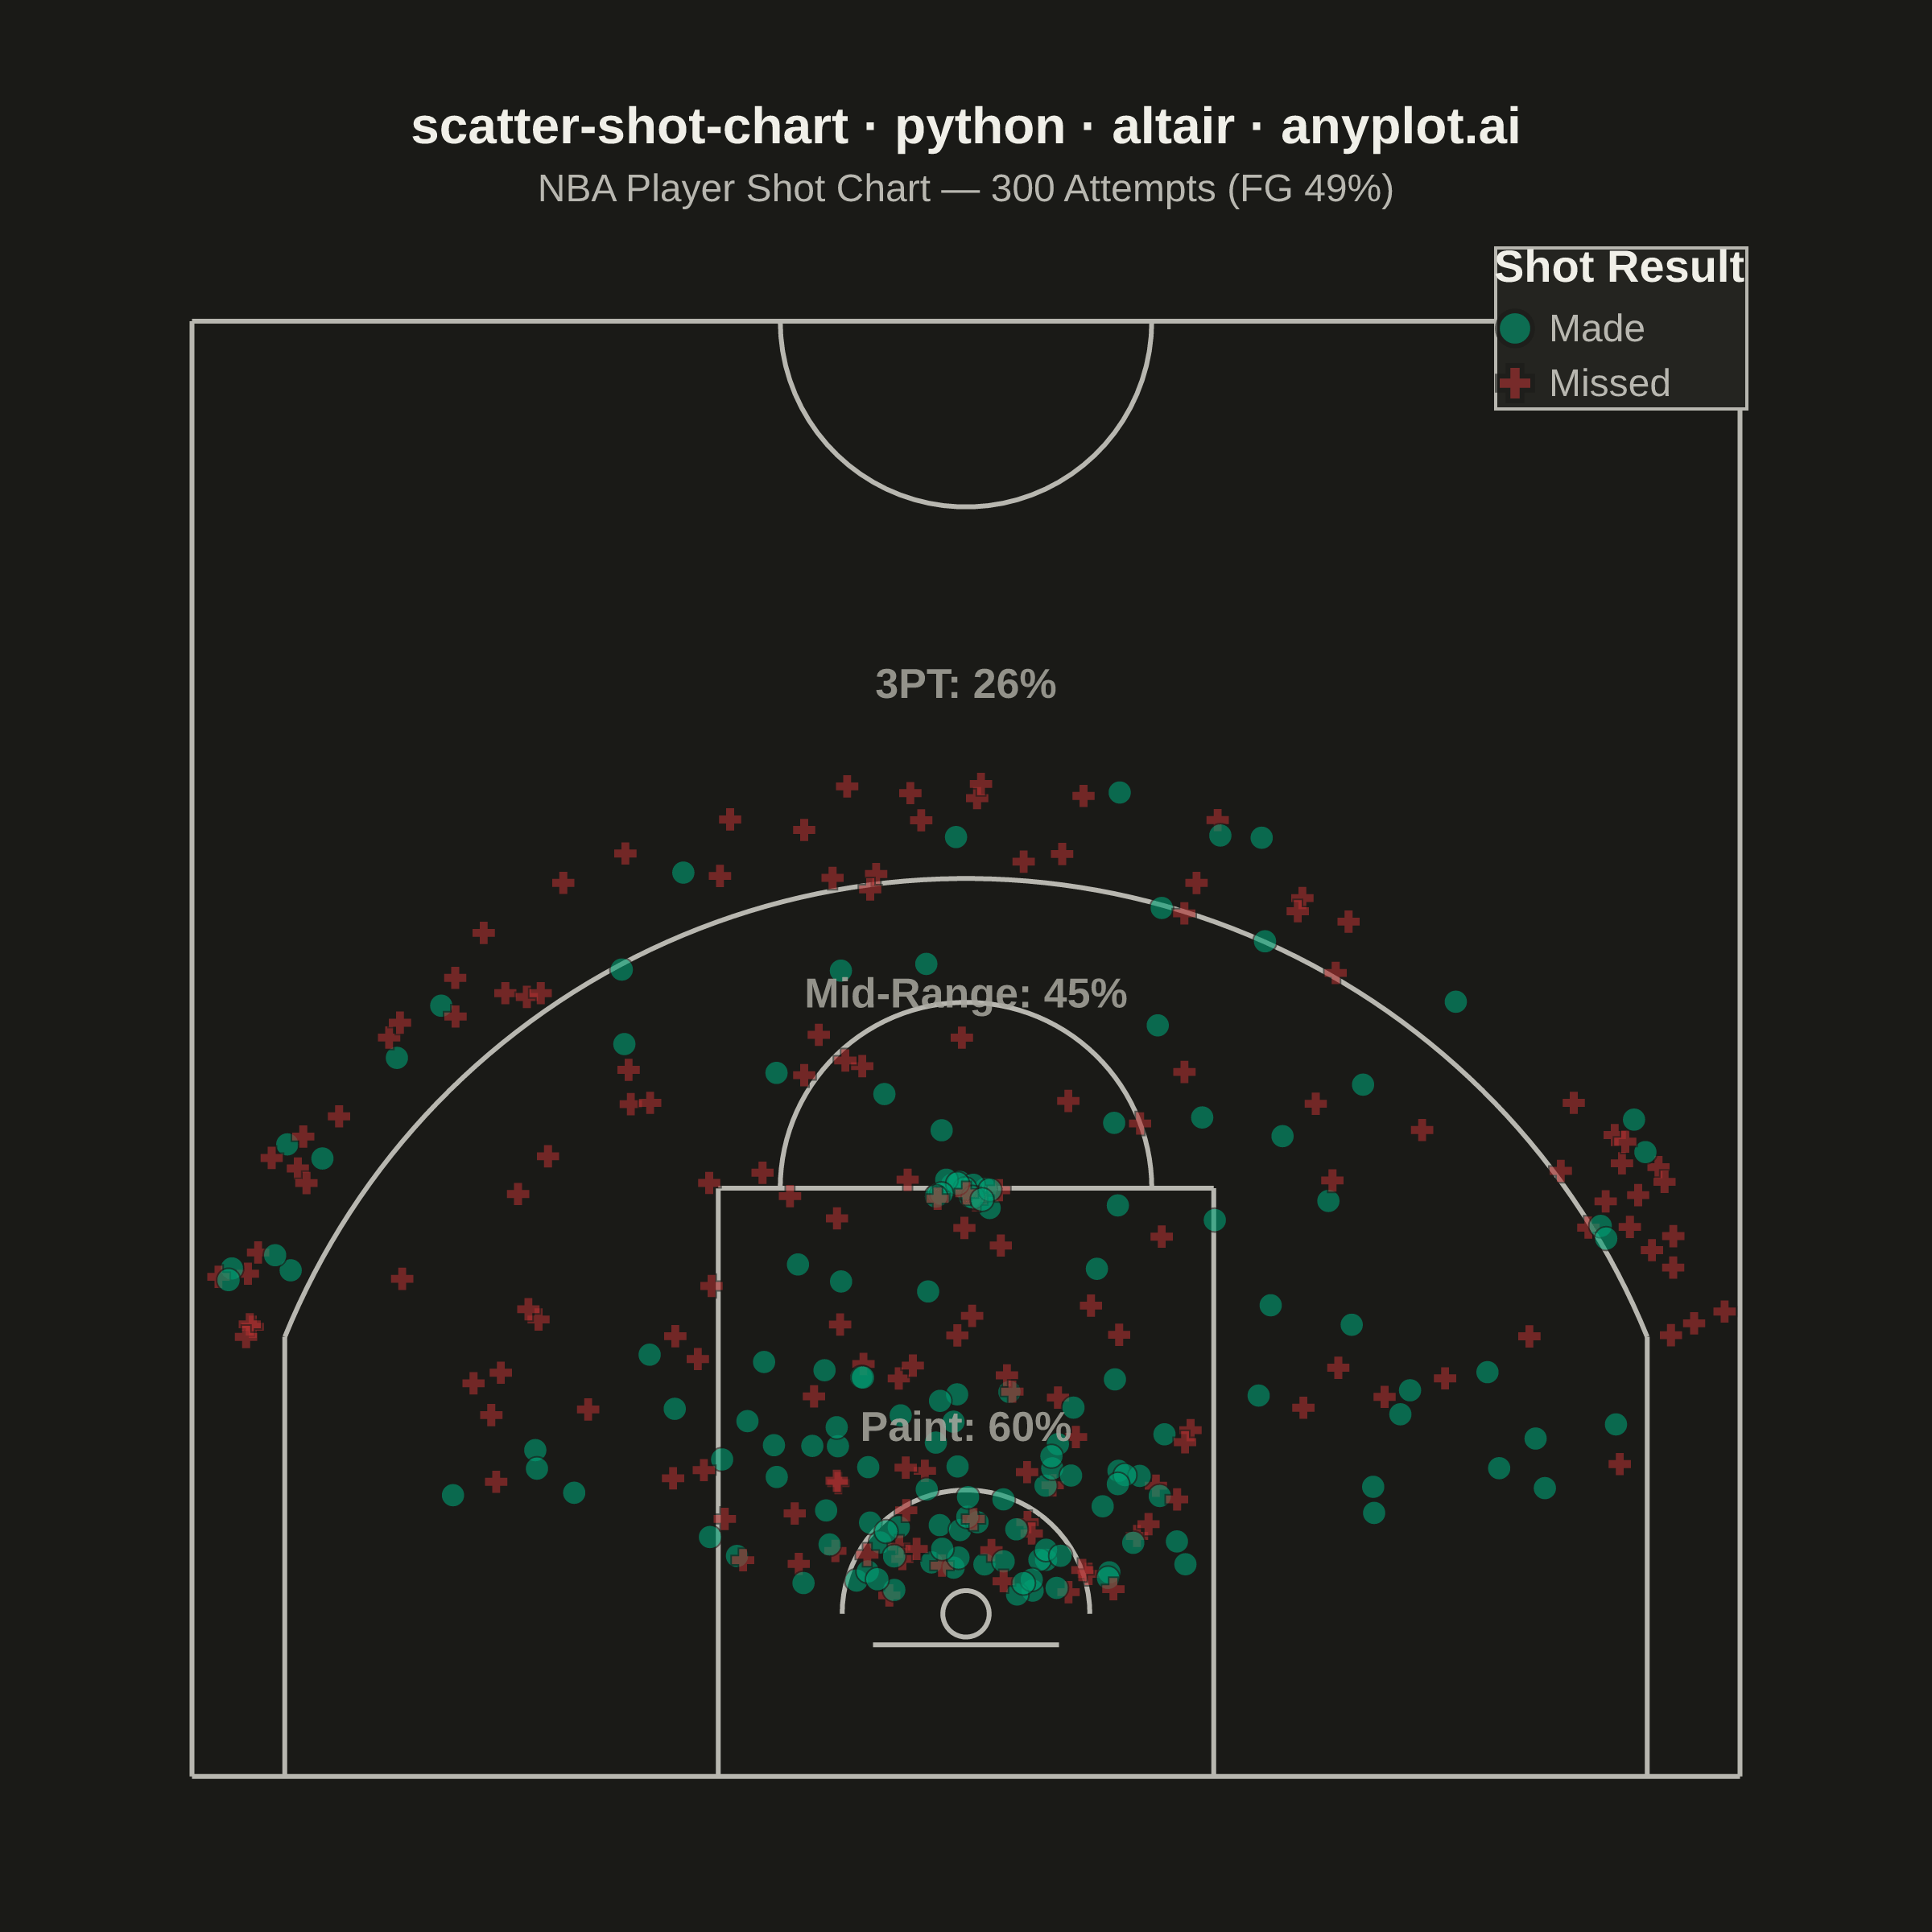
A basketball shot chart overlays shooting data on a half-court diagram, plotting each shot attempt as a point colored by outcome (made or missed). The court drawing includes the three-point arc, free-throw line, paint/key area, and basket, providing spatial context for analyzing shooting patterns and efficiency. Essential for basketball analytics and player evaluation.
""" anyplot.ai
scatter-shot-chart: Basketball Shot Chart
Library: altair 6.2.1 | Python 3.13.14
Quality: 90/100 | Updated: 2026-06-21
"""

import os

import altair as alt
import numpy as np
import pandas as pd
from PIL import Image


# Theme tokens
THEME = os.getenv("ANYPLOT_THEME", "light")
PAGE_BG = "#FAF8F1" if THEME == "light" else "#1A1A17"
ELEVATED_BG = "#FFFDF6" if THEME == "light" else "#242420"
INK = "#1A1A17" if THEME == "light" else "#F0EFE8"
INK_SOFT = "#4A4A44" if THEME == "light" else "#B8B7B0"
INK_MUTED = "#6B6A63" if THEME == "light" else "#A8A79F"

# Imprint palette — semantic exception: Made=green (#009E73), Missed=matte-red (#AE3030)
MADE_COLOR = "#009E73"
MISSED_COLOR = "#AE3030"

# Data — realistic NBA half-court shot attempts
np.random.seed(42)

close_angles = np.random.uniform(0.15, np.pi - 0.15, 100)
close_dist = np.random.uniform(1.5, 8, 100)
mid_angles = np.random.uniform(0.2, np.pi - 0.2, 100)
mid_dist = np.random.uniform(8, 22, 100)
three_angles = np.random.uniform(0.35, np.pi - 0.35, 80)
three_dist = np.random.uniform(23.5, 27, 80)
ft_angles = np.random.uniform(np.pi / 2 - 0.08, np.pi / 2 + 0.08, 20)
ft_dist = np.full(20, 13.75) + np.random.normal(0, 0.3, 20)

shot_x = np.concatenate(
    [
        close_dist * np.cos(close_angles),
        mid_dist * np.cos(mid_angles),
        three_dist * np.cos(three_angles),
        ft_dist * np.cos(ft_angles),
    ]
)
shot_y = np.concatenate(
    [
        close_dist * np.sin(close_angles),
        mid_dist * np.sin(mid_angles),
        three_dist * np.sin(three_angles),
        ft_dist * np.sin(ft_angles),
    ]
)

shot_type = ["2-pointer"] * 200 + ["3-pointer"] * 80 + ["free-throw"] * 20
make_probs = np.concatenate([np.full(100, 0.55), np.full(100, 0.40), np.full(80, 0.35), np.full(20, 0.80)])
made = np.random.binomial(1, make_probs).astype(bool)

shots_df = pd.DataFrame(
    {
        "shot_x": np.clip(shot_x, -24.5, 24.5),
        "shot_y": np.clip(shot_y, -4, 40),
        "result": np.where(made, "Made", "Missed"),
        "shot_type": shot_type,
    }
)

# Court geometry (NBA half-court, basket at origin) — flat rows for Altair line mark
theta_ft = np.linspace(0, np.pi, 60)
theta_3 = np.linspace(np.arccos(22 / 23.75), np.pi - np.arccos(22 / 23.75), 100)
theta_ra = np.linspace(0, np.pi, 40)
theta_b = np.linspace(0, 2 * np.pi + 0.1, 40)
theta_cc = np.linspace(np.pi, 2 * np.pi, 40)
corner_y = np.sqrt(23.75**2 - 22**2)

segments = [
    ([-25, -25], [-5.25, 41.75], "sideline_l"),
    ([25, 25], [-5.25, 41.75], "sideline_r"),
    ([-25, 25], [-5.25, -5.25], "baseline"),
    ([-25, 25], [41.75, 41.75], "halfcourt"),
    ([-8, -8], [-5.25, 13.75], "paint_l"),
    ([8, 8], [-5.25, 13.75], "paint_r"),
    ([-8, 8], [13.75, 13.75], "ft_line"),
    (6 * np.cos(theta_ft), 13.75 + 6 * np.sin(theta_ft), "ft_circle"),
    ([-22, -22], [-5.25, corner_y], "corner3_l"),
    ([22, 22], [-5.25, corner_y], "corner3_r"),
    (23.75 * np.cos(theta_3), 23.75 * np.sin(theta_3), "three_arc"),
    (4 * np.cos(theta_ra), 4 * np.sin(theta_ra), "restricted"),
    (0.75 * np.cos(theta_b), 0.75 * np.sin(theta_b), "basket"),
    ([-3, 3], [-1.0, -1.0], "backboard"),
    (6 * np.cos(theta_cc), 41.75 + 6 * np.sin(theta_cc), "center_circle"),
]

court_rows = []
for xs, ys, seg_name in segments:
    for i, (xi, yi) in enumerate(zip(xs, ys, strict=True)):
        court_rows.append({"cx": float(xi), "cy": float(yi), "seg": seg_name, "ord": i})

court_df = pd.DataFrame(court_rows)

# Zone shooting percentages
paint_mask = (shots_df["shot_y"] < 13.75) & (shots_df["shot_x"].abs() < 8) & (shots_df["shot_type"] != "free-throw")
mid_mask = (shots_df["shot_type"] == "2-pointer") & ~((shots_df["shot_y"] < 13.75) & (shots_df["shot_x"].abs() < 8))
three_mask = shots_df["shot_type"] == "3-pointer"

paint_pct = int(100 * shots_df.loc[paint_mask, "result"].eq("Made").mean())
mid_pct = int(100 * shots_df.loc[mid_mask, "result"].eq("Made").mean())
three_pct = int(100 * shots_df.loc[three_mask, "result"].eq("Made").mean())
total_fg = int(100 * shots_df["result"].eq("Made").mean())

zone_df = pd.DataFrame(
    [
        {"label": f"Paint: {paint_pct}%", "zx": 0.0, "zy": 6.0},
        {"label": f"Mid-Range: {mid_pct}%", "zx": 0.0, "zy": 20.0},
        {"label": f"3PT: {three_pct}%", "zx": 0.0, "zy": 30.0},
    ]
)

# Shared scales — equal 52-unit domain on both axes for undistorted 1:1 court
x_scale = alt.Scale(domain=[-26, 26], nice=False)
y_scale = alt.Scale(domain=[-7, 45], nice=False)

TITLE = "scatter-shot-chart · python · altair · anyplot.ai"

# Court lines layer
court = (
    alt.Chart(court_df)
    .mark_line(strokeWidth=1.5, color=INK_SOFT)
    .encode(
        x=alt.X("cx:Q", scale=x_scale, axis=None),
        y=alt.Y("cy:Q", scale=y_scale, axis=None),
        detail="seg:N",
        order="ord:Q",
    )
)

# Shot markers layer
shots = (
    alt.Chart(shots_df)
    .mark_point(filled=True, size=55, opacity=0.6, strokeWidth=0.5, stroke=PAGE_BG)
    .encode(
        x=alt.X("shot_x:Q", scale=x_scale, axis=None),
        y=alt.Y("shot_y:Q", scale=y_scale, axis=None),
        color=alt.Color(
            "result:N",
            scale=alt.Scale(domain=["Made", "Missed"], range=[MADE_COLOR, MISSED_COLOR]),
            legend=alt.Legend(
                title="Shot Result", titleFontSize=14, labelFontSize=12, symbolSize=120, orient="top-right", offset=8
            ),
        ),
        shape=alt.Shape("result:N", scale=alt.Scale(domain=["Made", "Missed"], range=["circle", "cross"]), legend=None),
        tooltip=[
            alt.Tooltip("shot_type:N", title="Shot Type"),
            alt.Tooltip("result:N", title="Result"),
            alt.Tooltip("shot_x:Q", title="X (ft)", format=".1f"),
            alt.Tooltip("shot_y:Q", title="Y (ft)", format=".1f"),
        ],
    )
)

# Zone percentage labels
zones = (
    alt.Chart(zone_df)
    .mark_text(fontSize=13, fontWeight="bold", color=INK_MUTED, opacity=0.85)
    .encode(x=alt.X("zx:Q", scale=x_scale, axis=None), y=alt.Y("zy:Q", scale=y_scale, axis=None), text="label:N")
)

# Compose with theme-adaptive chrome
chart = (
    (court + shots + zones)
    .properties(
        width=500,
        height=500,
        background=PAGE_BG,
        title=alt.Title(
            TITLE,
            fontSize=16,
            color=INK,
            subtitle=f"NBA Player Shot Chart — 300 Attempts (FG {total_fg}%)",
            subtitleFontSize=12,
            subtitleColor=INK_SOFT,
            subtitlePadding=6,
        ),
    )
    .interactive()
    .configure_view(fill=PAGE_BG, strokeWidth=0)
    .configure_title(color=INK)
    .configure_legend(fillColor=ELEVATED_BG, strokeColor=INK_SOFT, labelColor=INK_SOFT, titleColor=INK)
)

# Save — pad to exact 2400×2400 (square, 1:1 court aspect ratio)
TW, TH = 2400, 2400
chart.save(f"plot-{THEME}.png", scale_factor=4.0)
_img = Image.open(f"plot-{THEME}.png").convert("RGB")
_w, _h = _img.size
if _w > TW or _h > TH:
    raise SystemExit(
        f"altair vl-convert produced {_w}×{_h}, exceeds target {TW}×{TH}. "
        f"Shrink chart .properties(width=, height=) values and re-render."
    )
if _w < TW or _h < TH:
    _canvas = Image.new("RGB", (TW, TH), PAGE_BG)
    _canvas.paste(_img, ((TW - _w) // 2, (TH - _h) // 2))
    _canvas.save(f"plot-{THEME}.png")

chart.save(f"plot-{THEME}.html")
Runnable source as JSON, for any HTTP client: https://api.anyplot.ai/specs/scatter-shot-chart/altair/code. Any spec id and library id listed in llms-full.txt fit the same URL shape; every URL below is complete and callable.
{
  "spec_id": "scatter-shot-chart",
  "language": "python",
  "library": "altair",
  "page": "https://anyplot.ai/scatter-shot-chart/python/altair",
  "hub": "https://anyplot.ai/scatter-shot-chart",
  "code_json": "https://api.anyplot.ai/specs/scatter-shot-chart/altair/code",
  "spec_json": "https://api.anyplot.ai/specs/scatter-shot-chart",
  "render_light_png": "https://storage.googleapis.com/anyplot-images/plots/scatter-shot-chart/python/altair/plot-light.png",
  "render_dark_png": "https://storage.googleapis.com/anyplot-images/plots/scatter-shot-chart/python/altair/plot-dark.png",
  "interactive_light_html": "https://storage.googleapis.com/anyplot-images/plots/scatter-shot-chart/python/altair/plot-light.html",
  "interactive_dark_html": "https://storage.googleapis.com/anyplot-images/plots/scatter-shot-chart/python/altair/plot-dark.html",
  "quality_score": 90.0,
  "license": "MIT",
  "guide": "https://anyplot.ai/llms.txt"
}
Part of Basketball Shot Chart on anyplot.ai.