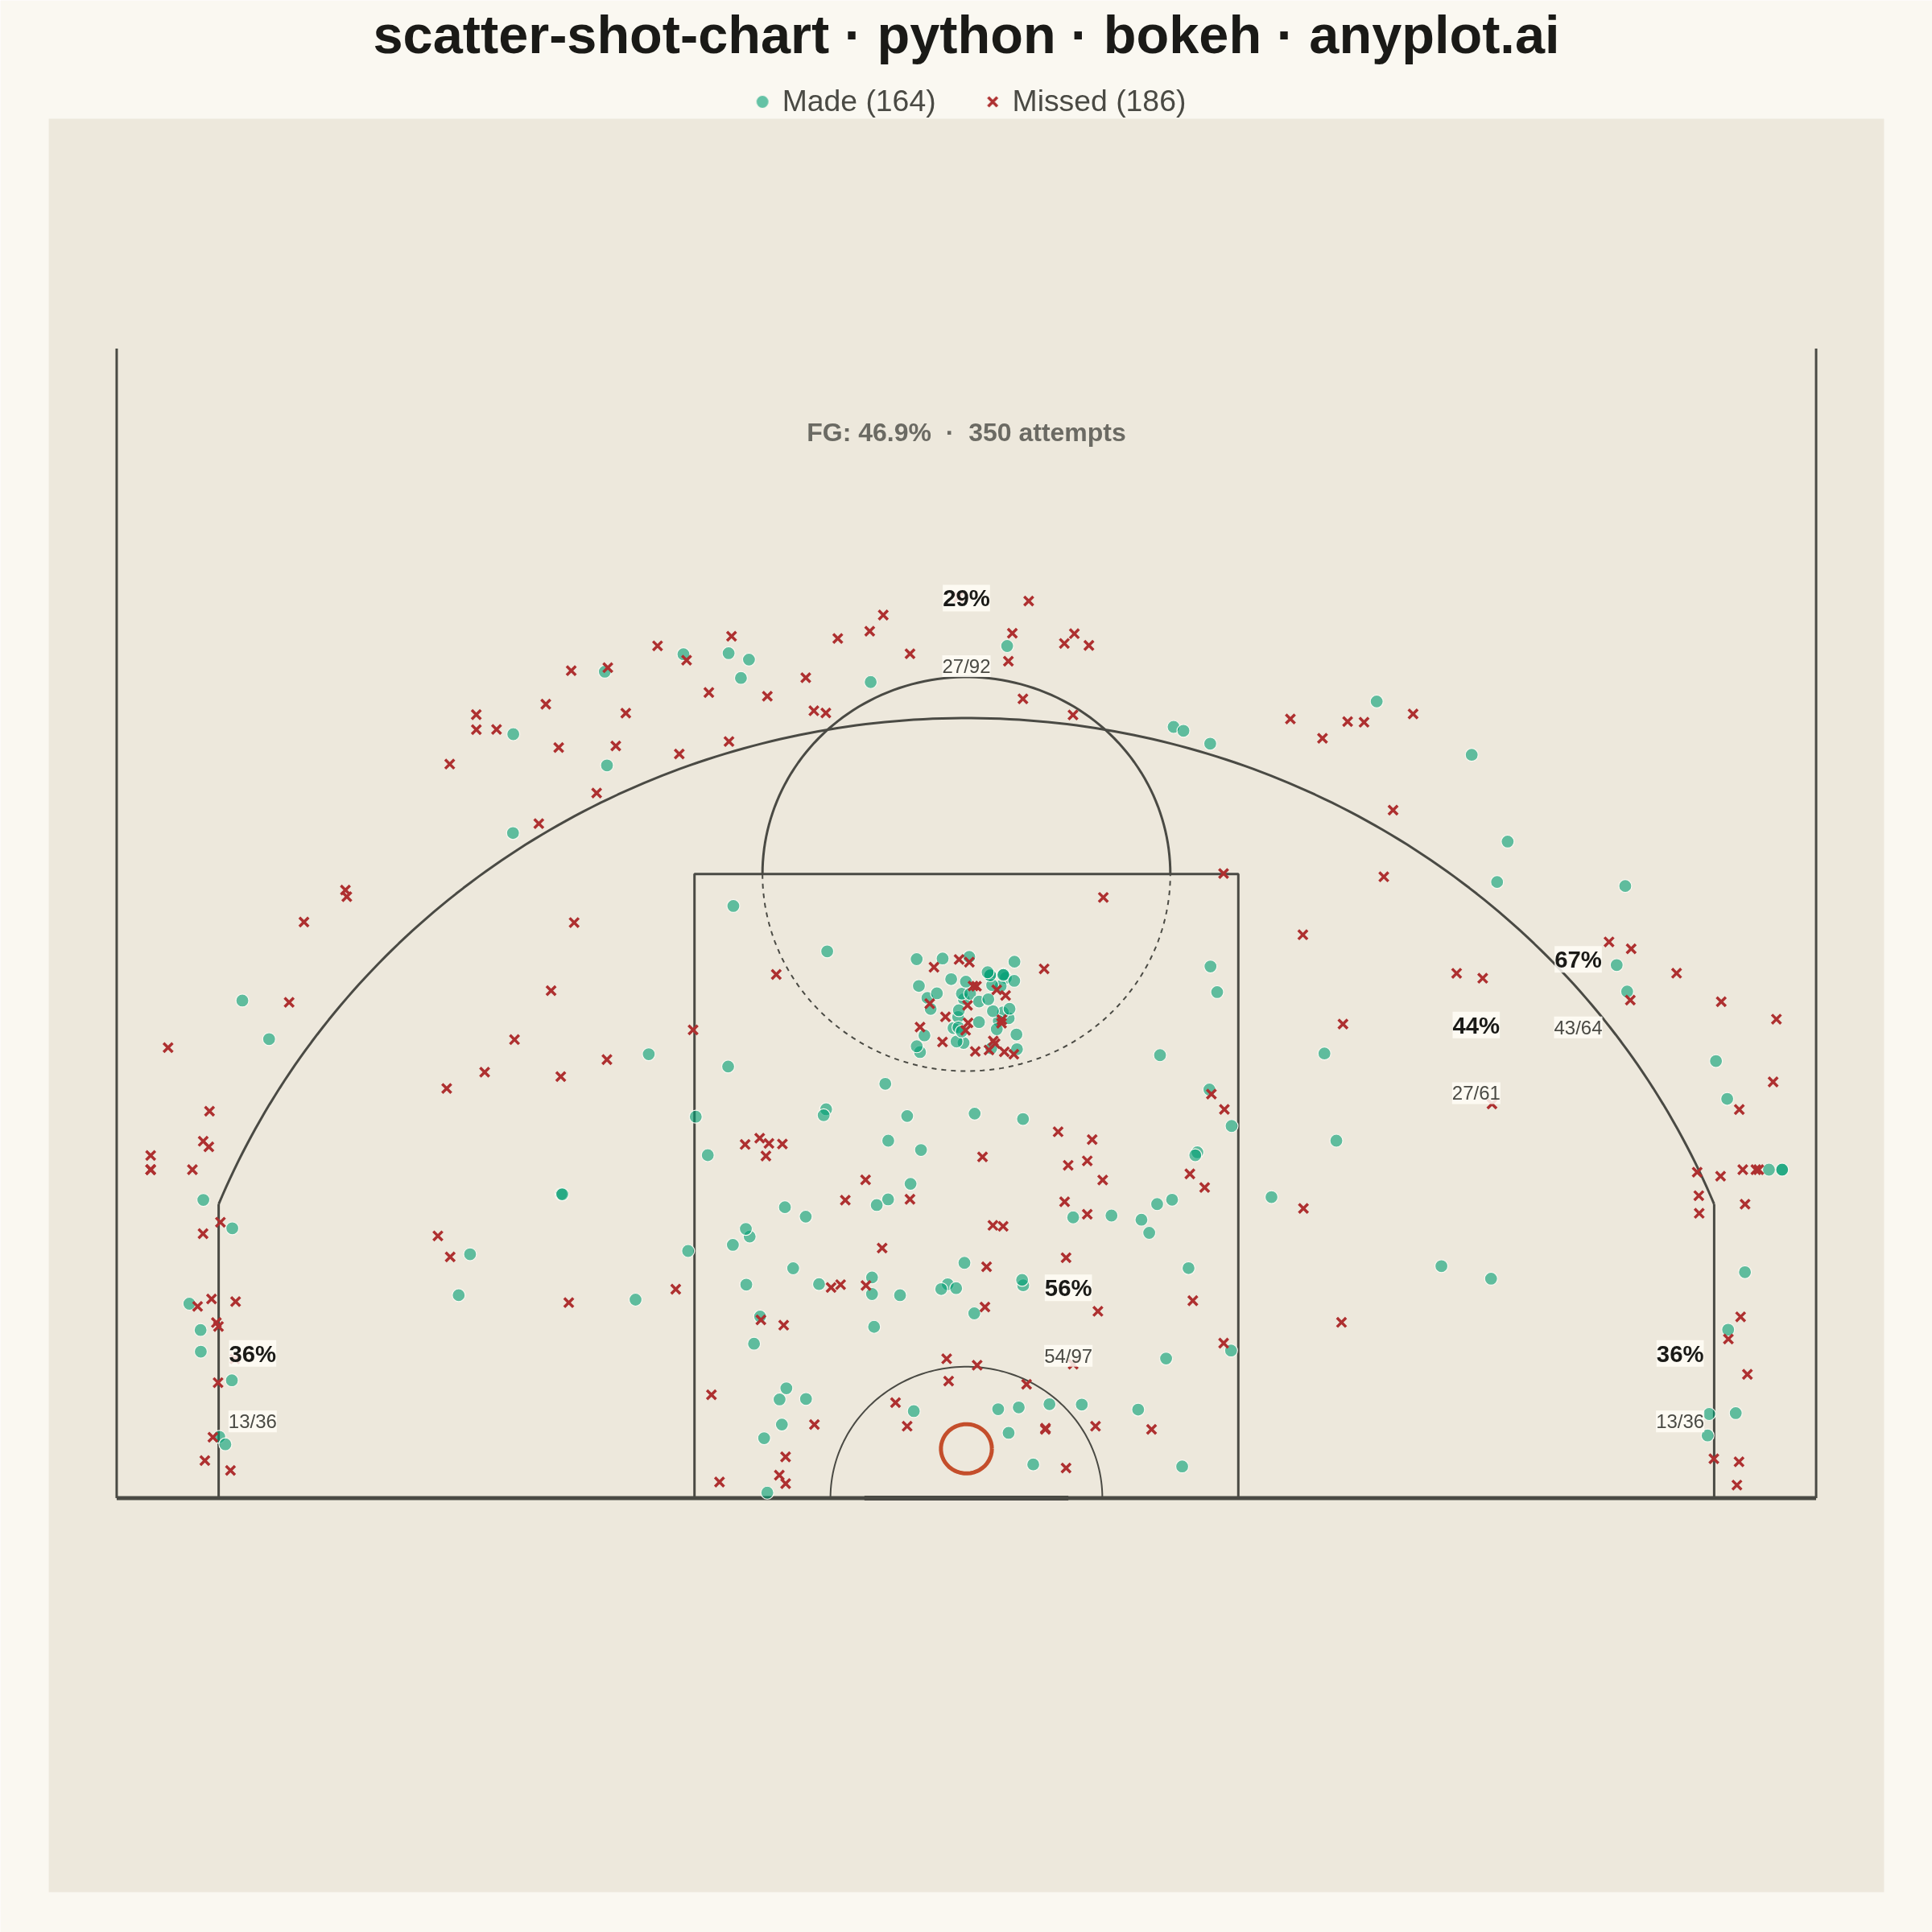
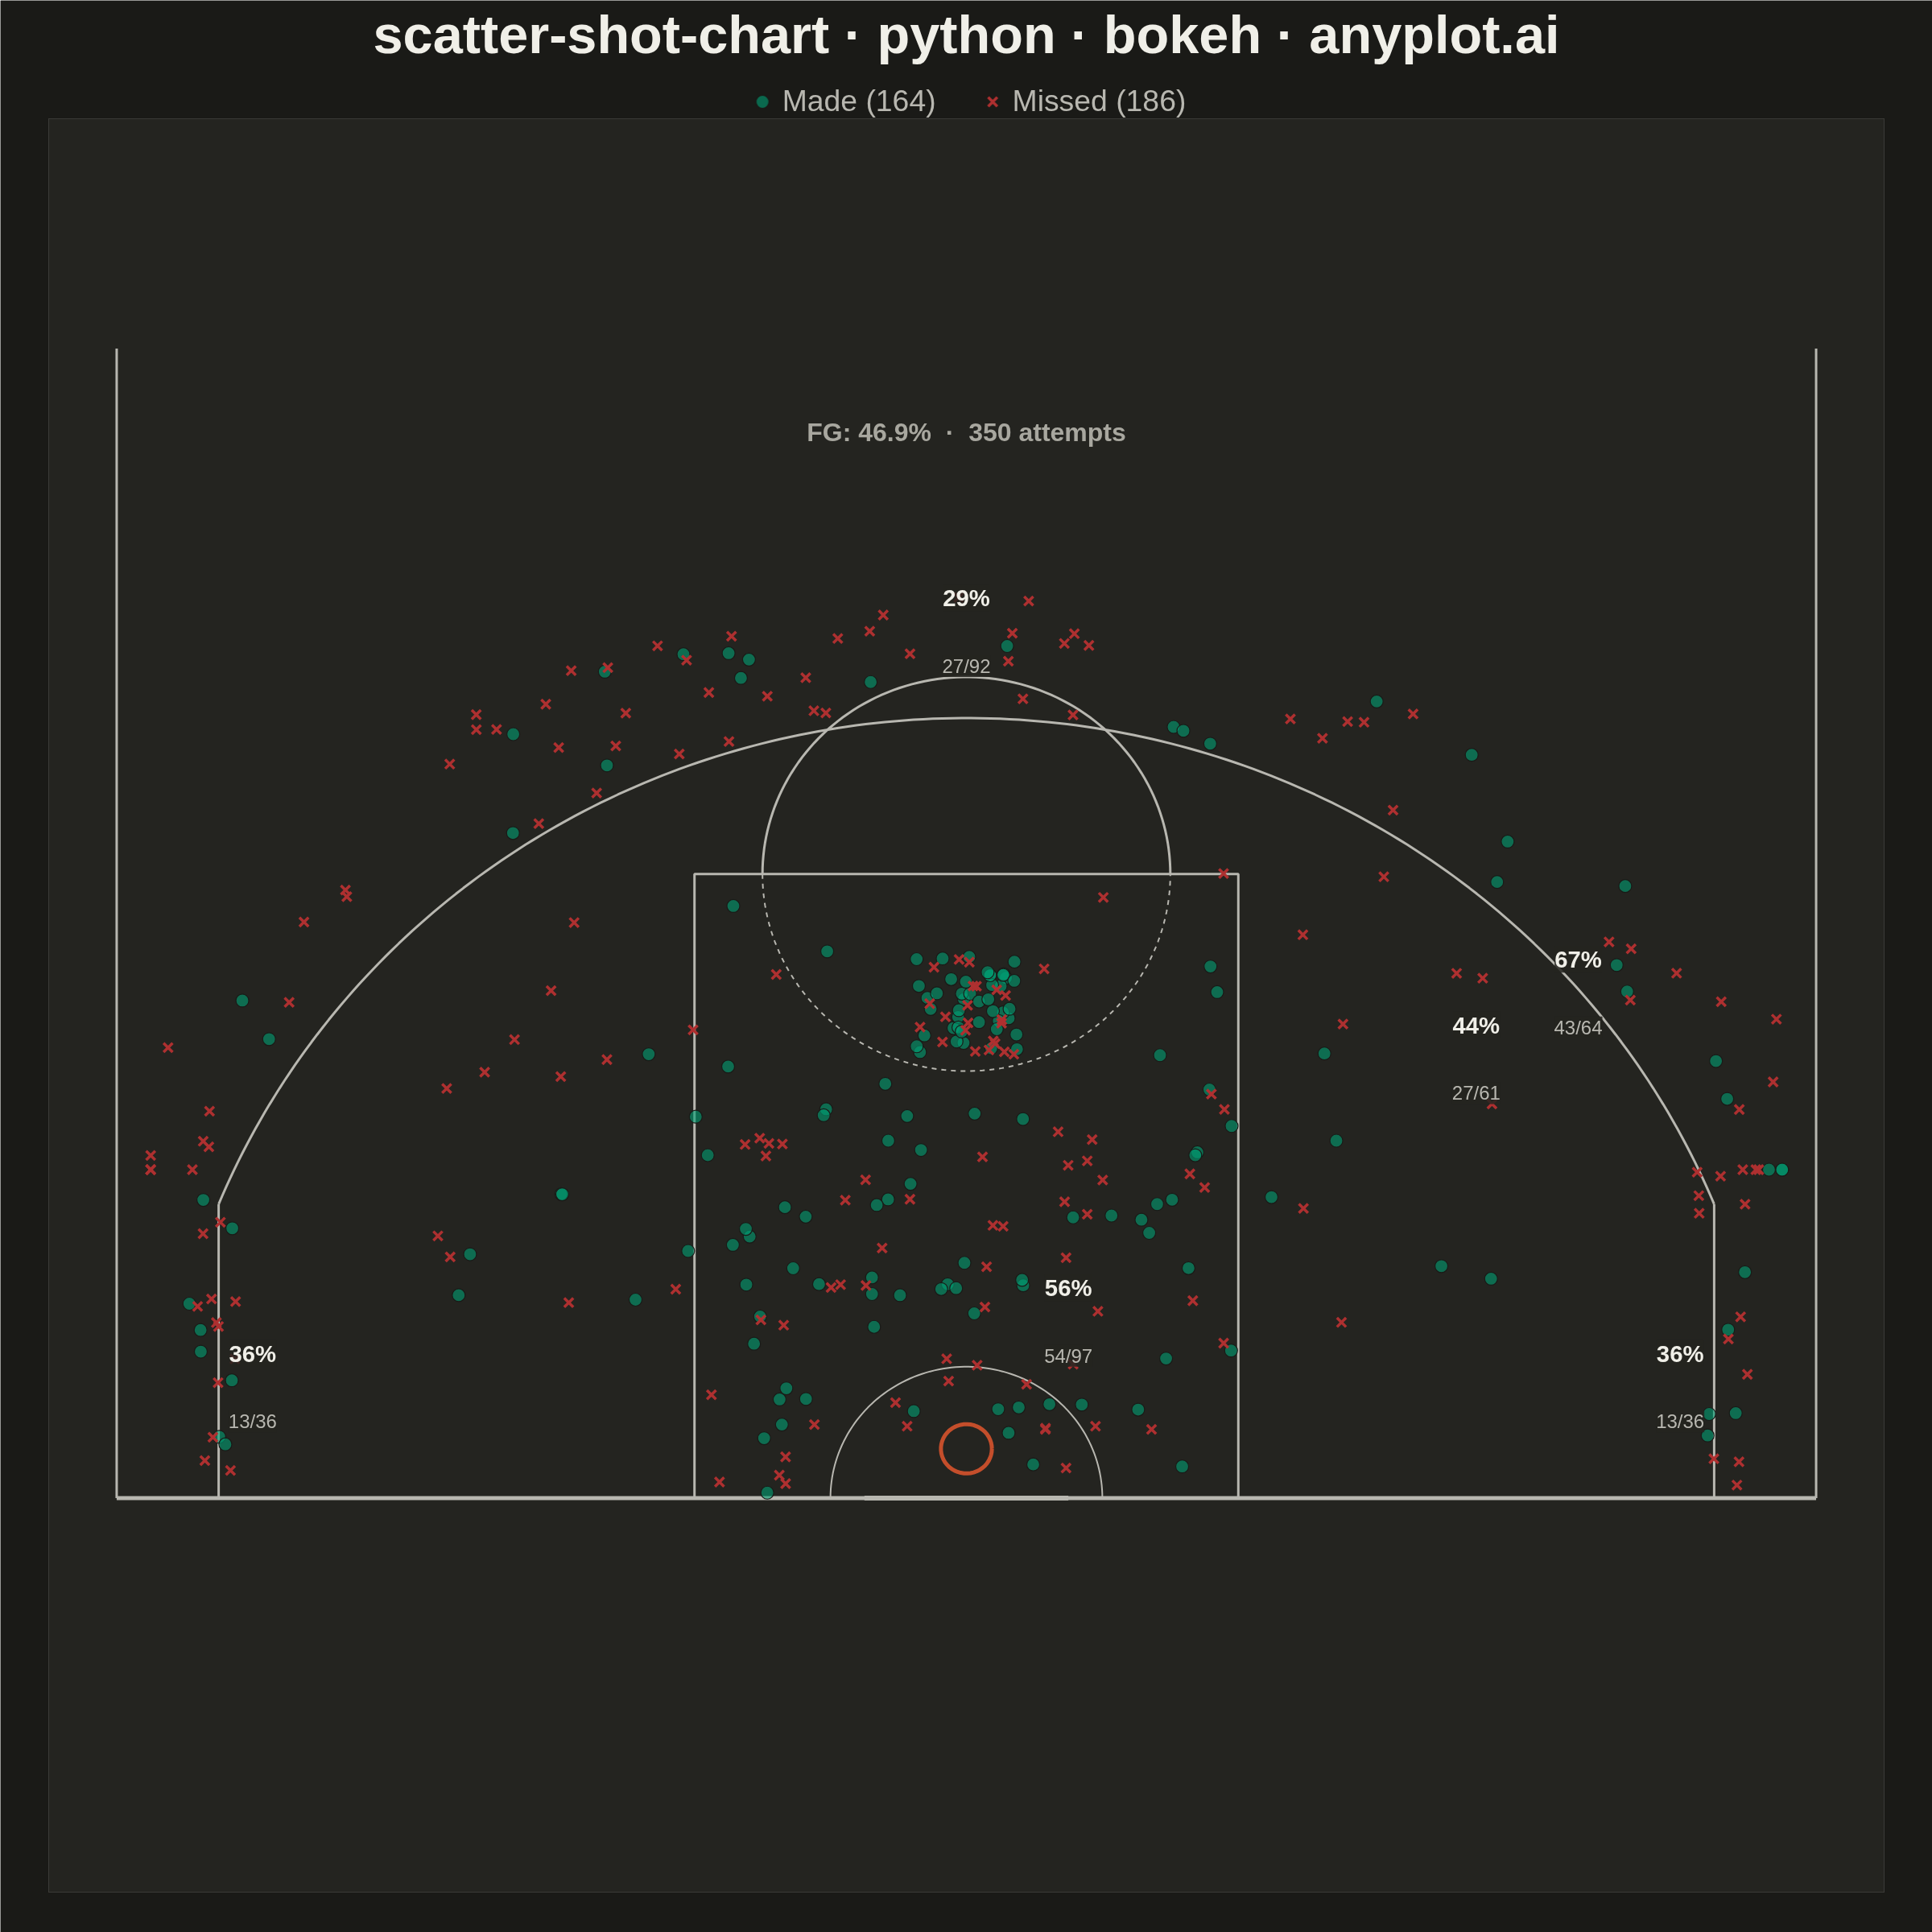
A basketball shot chart overlays shooting data on a half-court diagram, plotting each shot attempt as a point colored by outcome (made or missed). The court drawing includes the three-point arc, free-throw line, paint/key area, and basket, providing spatial context for analyzing shooting patterns and efficiency. Essential for basketball analytics and player evaluation.
""" anyplot.ai
scatter-shot-chart: Basketball Shot Chart
Library: bokeh 3.9.1 | Python 3.13.14
Quality: 86/100 | Updated: 2026-06-21
"""

import os
import sys


# Prevent self-import: this file is named bokeh.py, which shadows the installed
# bokeh package when its directory sits at the front of sys.path.
_this_dir = os.path.dirname(os.path.abspath(__file__))
sys.path = [p for p in sys.path if os.path.abspath(p or ".") != _this_dir]

import time
from pathlib import Path

import numpy as np
from bokeh.io import output_file, save
from bokeh.models import ColumnDataSource, HoverTool, Label, Legend, LegendItem, Range1d
from bokeh.plotting import figure
from bokeh.resources import CDN
from selenium import webdriver
from selenium.webdriver.chrome.options import Options


# Theme tokens — Imprint palette / anyplot style guide
THEME = os.getenv("ANYPLOT_THEME", "light")
PAGE_BG = "#FAF8F1" if THEME == "light" else "#1A1A17"
ELEVATED_BG = "#FFFDF6" if THEME == "light" else "#242420"
INK = "#1A1A17" if THEME == "light" else "#F0EFE8"
INK_SOFT = "#4A4A44" if THEME == "light" else "#B8B7B0"
INK_MUTED = "#6B6A63" if THEME == "light" else "#A8A79F"

# Imprint palette — semantic exception: made=good/pass→green, missed=bad/fail→red
MADE_COLOR = "#009E73"  # Imprint position 1 (brand green, semantic: good/pass)
MISSED_COLOR = "#AE3030"  # Imprint position 5 (matte red, semantic: bad/fail)

# Court surface — distinct from page background for both themes
COURT_FLOOR = "#EDE8DC" if THEME == "light" else "#242420"
COURT_LINE = INK_SOFT  # theme-adaptive court lines

# Data
np.random.seed(42)
n_shots = 350

x = np.zeros(n_shots)
y = np.zeros(n_shots)
made = np.zeros(n_shots, dtype=bool)
shot_type = []
zone_label = []

for i in range(n_shots):
    zone = np.random.choice(["paint", "midrange", "three", "corner3", "ft"], p=[0.25, 0.20, 0.30, 0.10, 0.15])
    if zone == "paint":
        x[i] = np.random.uniform(-8, 8)
        y[i] = np.random.uniform(0, 12)
        made[i] = np.random.random() < 0.55
        shot_type.append("2-pointer")
        zone_label.append("Paint")
    elif zone == "midrange":
        x[i] = np.random.uniform(-16, 16)
        y[i] = np.random.uniform(5, 20)
        dist = np.sqrt(x[i] ** 2 + y[i] ** 2)
        while dist > 23.0 or dist < 5:
            x[i] = np.random.uniform(-16, 16)
            y[i] = np.random.uniform(5, 20)
            dist = np.sqrt(x[i] ** 2 + y[i] ** 2)
        made[i] = np.random.random() < 0.42
        shot_type.append("2-pointer")
        zone_label.append("Mid-Range")
    elif zone == "three":
        angle = np.random.uniform(0.25, np.pi - 0.25)
        r = np.random.uniform(24, 28)
        x[i] = r * np.cos(angle)
        y[i] = r * np.sin(angle)
        x[i] = np.clip(x[i], -24, 24)
        y[i] = np.clip(y[i], 10, 33)
        made[i] = np.random.random() < 0.36
        shot_type.append("3-pointer")
        zone_label.append("Three-Point")
    elif zone == "corner3":
        side = np.random.choice([-1, 1])
        x[i] = side * np.random.uniform(21.5, 23)
        y[i] = np.random.uniform(0, 10)
        made[i] = np.random.random() < 0.39
        shot_type.append("3-pointer")
        zone_label.append("Corner 3")
    else:
        x[i] = np.random.uniform(-1.5, 1.5)
        y[i] = np.random.uniform(13.5, 16.5)
        made[i] = np.random.random() < 0.78
        shot_type.append("free-throw")
        zone_label.append("Free Throw")

shot_type = np.array(shot_type)
zone_label = np.array(zone_label)

# Zone efficiency stats for data storytelling
zones = ["Paint", "Mid-Range", "Three-Point", "Corner 3", "Free Throw"]
zone_stats = {}
for z in zones:
    mask = zone_label == z
    z_made = int(np.sum(made[mask]))
    z_total = int(np.sum(mask))
    z_pct = z_made / z_total * 100 if z_total > 0 else 0
    zone_stats[z] = (z_made, z_total, z_pct)

# Canvas — 2400×2400 (square, canonical for symmetric shot chart).
# y_range (-12, 42) = 54 units, matching x_range = 54 units so match_aspect=True
# fills the square canvas uniformly. min_border_top trimmed to reduce chrome overhead.
title = "scatter-shot-chart · python · bokeh · anyplot.ai"
p = figure(
    width=2400,
    height=2400,
    title=title,
    x_range=Range1d(-27, 27),
    y_range=Range1d(-12, 42),
    toolbar_location=None,
    match_aspect=True,
    min_border_bottom=50,
    min_border_left=60,
    min_border_top=100,
    min_border_right=60,
)

# Court floor — covers the full visible data range
p.rect(x=0, y=15, width=60, height=60, fill_color=COURT_FLOOR, line_color=None)

# Baseline and sidelines (half-court)
p.line([-25, 25], [0, 0], line_color=COURT_LINE, line_width=5)
p.line([-25, -25], [0, 35], line_color=COURT_LINE, line_width=3)
p.line([25, 25], [0, 35], line_color=COURT_LINE, line_width=3)

# Paint / key area (16 ft wide, 19 ft deep from baseline)
p.line([-8, -8, 8, 8], [0, 19, 19, 0], line_color=COURT_LINE, line_width=3)

# Free-throw circle (solid top half, dashed bottom half)
theta_top = np.linspace(0, np.pi, 100)
theta_bot = np.linspace(np.pi, 2 * np.pi, 100)
p.line(6 * np.cos(theta_top), 19 + 6 * np.sin(theta_top), line_color=COURT_LINE, line_width=3)
p.line(6 * np.cos(theta_bot), 19 + 6 * np.sin(theta_bot), line_color=COURT_LINE, line_width=2, line_dash="dashed")

# Restricted area arc (4 ft radius from basket)
theta_ra = np.linspace(0, np.pi, 100)
p.line(4 * np.cos(theta_ra), 4 * np.sin(theta_ra), line_color=COURT_LINE, line_width=2)

# Three-point arc (23.75 ft at top, 22 ft in corners)
theta_3pt = np.linspace(np.arccos(22.0 / 23.75), np.pi - np.arccos(22.0 / 23.75), 200)
p.line(23.75 * np.cos(theta_3pt), 23.75 * np.sin(theta_3pt), line_color=COURT_LINE, line_width=3)

# Corner three-point lines (22 ft from basket, straight to baseline)
corner_y = 23.75 * np.sin(np.arccos(22.0 / 23.75))
p.line([-22, -22], [0, corner_y], line_color=COURT_LINE, line_width=3)
p.line([22, 22], [0, corner_y], line_color=COURT_LINE, line_width=3)

# Basket (hoop at ~1.5 ft from backboard)
hoop_theta = np.linspace(0, 2 * np.pi, 50)
p.line(0.75 * np.cos(hoop_theta), 0.75 * np.sin(hoop_theta) + 1.5, line_color="#C44E2B", line_width=5)
p.line([-3, 3], [0, 0], line_color=INK_SOFT, line_width=6)

# Shot data sources
made_mask = made
missed_mask = ~made
result_label = np.where(made, "Made", "Missed")
distance = np.round(np.sqrt(x**2 + y**2), 1)

source_made = ColumnDataSource(
    data={
        "x": x[made_mask],
        "y": y[made_mask],
        "result": result_label[made_mask],
        "zone": zone_label[made_mask],
        "shot_type": shot_type[made_mask],
        "distance": distance[made_mask],
    }
)
source_missed = ColumnDataSource(
    data={
        "x": x[missed_mask],
        "y": y[missed_mask],
        "result": result_label[missed_mask],
        "zone": zone_label[missed_mask],
        "shot_type": shot_type[missed_mask],
        "distance": distance[missed_mask],
    }
)

r_made = p.scatter(
    x="x",
    y="y",
    source=source_made,
    size=16,
    fill_color=MADE_COLOR,
    fill_alpha=0.60,
    line_color=PAGE_BG,
    line_width=1.2,
    marker="circle",
)
r_missed = p.scatter(
    x="x",
    y="y",
    source=source_missed,
    size=16,
    fill_color=None,
    fill_alpha=0,
    line_color=MISSED_COLOR,
    line_width=3.5,
    marker="x",
)

# HoverTool — Bokeh's signature interactive feature
hover = HoverTool(
    renderers=[r_made, r_missed],
    tooltips=[("Result", "@result"), ("Zone", "@zone"), ("Shot Type", "@shot_type"), ("Distance", "@distance ft")],
    point_policy="snap_to_data",
)
p.add_tools(hover)

# Legend (horizontal, above the plot area)
n_made = int(np.sum(made))
n_missed = int(np.sum(~made))
legend = Legend(
    items=[
        LegendItem(label=f"Made ({n_made})", renderers=[r_made]),
        LegendItem(label=f"Missed ({n_missed})", renderers=[r_missed]),
    ],
    location="top_center",
    orientation="horizontal",
)
p.add_layout(legend, "above")
p.legend.label_text_font_size = "28pt"
p.legend.label_text_color = INK_SOFT
p.legend.glyph_width = 40
p.legend.glyph_height = 40
p.legend.spacing = 50
p.legend.padding = 20
p.legend.background_fill_alpha = 0.0
p.legend.border_line_color = None

# FG% summary — placed above the three-point arc in the open court floor area
fg_pct = n_made / n_shots * 100
p.add_layout(
    Label(
        x=0,
        y=32,
        text=f"FG: {fg_pct:.1f}%  ·  {n_shots} attempts",
        text_font_size="24pt",
        text_color=INK_MUTED,
        text_align="center",
        text_font_style="bold",
    )
)

# Zone efficiency overlays with made/total counts
zone_positions = {
    "Paint": [(3, 6)],
    "Mid-Range": [(15, 14)],
    "Three-Point": [(0, 27)],
    "Corner 3": [(-21, 4), (21, 4)],
    "Free Throw": [(18, 16)],
}
for z, positions in zone_positions.items():
    z_made, z_total, z_pct = zone_stats[z]
    for zx, zy in positions:
        p.add_layout(
            Label(
                x=zx,
                y=zy,
                text=f"{z_pct:.0f}%",
                text_font_size="22pt",
                text_color=INK,
                text_align="center",
                text_font_style="bold",
                background_fill_color=ELEVATED_BG,
                background_fill_alpha=0.85,
            )
        )
        p.add_layout(
            Label(
                x=zx,
                y=zy - 2.0,
                text=f"{z_made}/{z_total}",
                text_font_size="18pt",
                text_color=INK_SOFT,
                text_align="center",
                background_fill_color=ELEVATED_BG,
                background_fill_alpha=0.85,
            )
        )

# Chrome — theme-adaptive
p.title.text_font_size = "50pt"
p.title.text_color = INK
p.title.text_font_style = "bold"
p.title.align = "center"

p.xaxis.visible = False
p.yaxis.visible = False
p.xgrid.grid_line_color = None
p.ygrid.grid_line_color = None

p.background_fill_color = PAGE_BG
p.border_fill_color = PAGE_BG
p.outline_line_color = None

# Save — interactive HTML, then PNG via Selenium headless Chrome
output_file(f"plot-{THEME}.html")
save(p, resources=CDN)

W, H = 2400, 2400
opts = Options()
for arg in (
    "--headless=new",
    "--no-sandbox",
    "--disable-dev-shm-usage",
    "--disable-gpu",
    f"--window-size={W},{H}",
    "--hide-scrollbars",
):
    opts.add_argument(arg)
driver = webdriver.Chrome(options=opts)
# CDP override forces exact W×H viewport regardless of browser chrome
driver.execute_cdp_cmd(
    "Emulation.setDeviceMetricsOverride", {"width": W, "height": H, "deviceScaleFactor": 1, "mobile": False}
)
driver.get(f"file://{Path(f'plot-{THEME}.html').resolve()}")
time.sleep(3)
driver.save_screenshot(f"plot-{THEME}.png")
driver.quit()
Runnable source as JSON, for any HTTP client: https://api.anyplot.ai/specs/scatter-shot-chart/bokeh/code. Any spec id and library id listed in llms-full.txt fit the same URL shape; every URL below is complete and callable.
{
  "spec_id": "scatter-shot-chart",
  "language": "python",
  "library": "bokeh",
  "page": "https://anyplot.ai/scatter-shot-chart/python/bokeh",
  "hub": "https://anyplot.ai/scatter-shot-chart",
  "code_json": "https://api.anyplot.ai/specs/scatter-shot-chart/bokeh/code",
  "spec_json": "https://api.anyplot.ai/specs/scatter-shot-chart",
  "render_light_png": "https://storage.googleapis.com/anyplot-images/plots/scatter-shot-chart/python/bokeh/plot-light.png",
  "render_dark_png": "https://storage.googleapis.com/anyplot-images/plots/scatter-shot-chart/python/bokeh/plot-dark.png",
  "interactive_light_html": "https://storage.googleapis.com/anyplot-images/plots/scatter-shot-chart/python/bokeh/plot-light.html",
  "interactive_dark_html": "https://storage.googleapis.com/anyplot-images/plots/scatter-shot-chart/python/bokeh/plot-dark.html",
  "quality_score": 86.0,
  "license": "MIT",
  "guide": "https://anyplot.ai/llms.txt"
}
Part of Basketball Shot Chart on anyplot.ai.