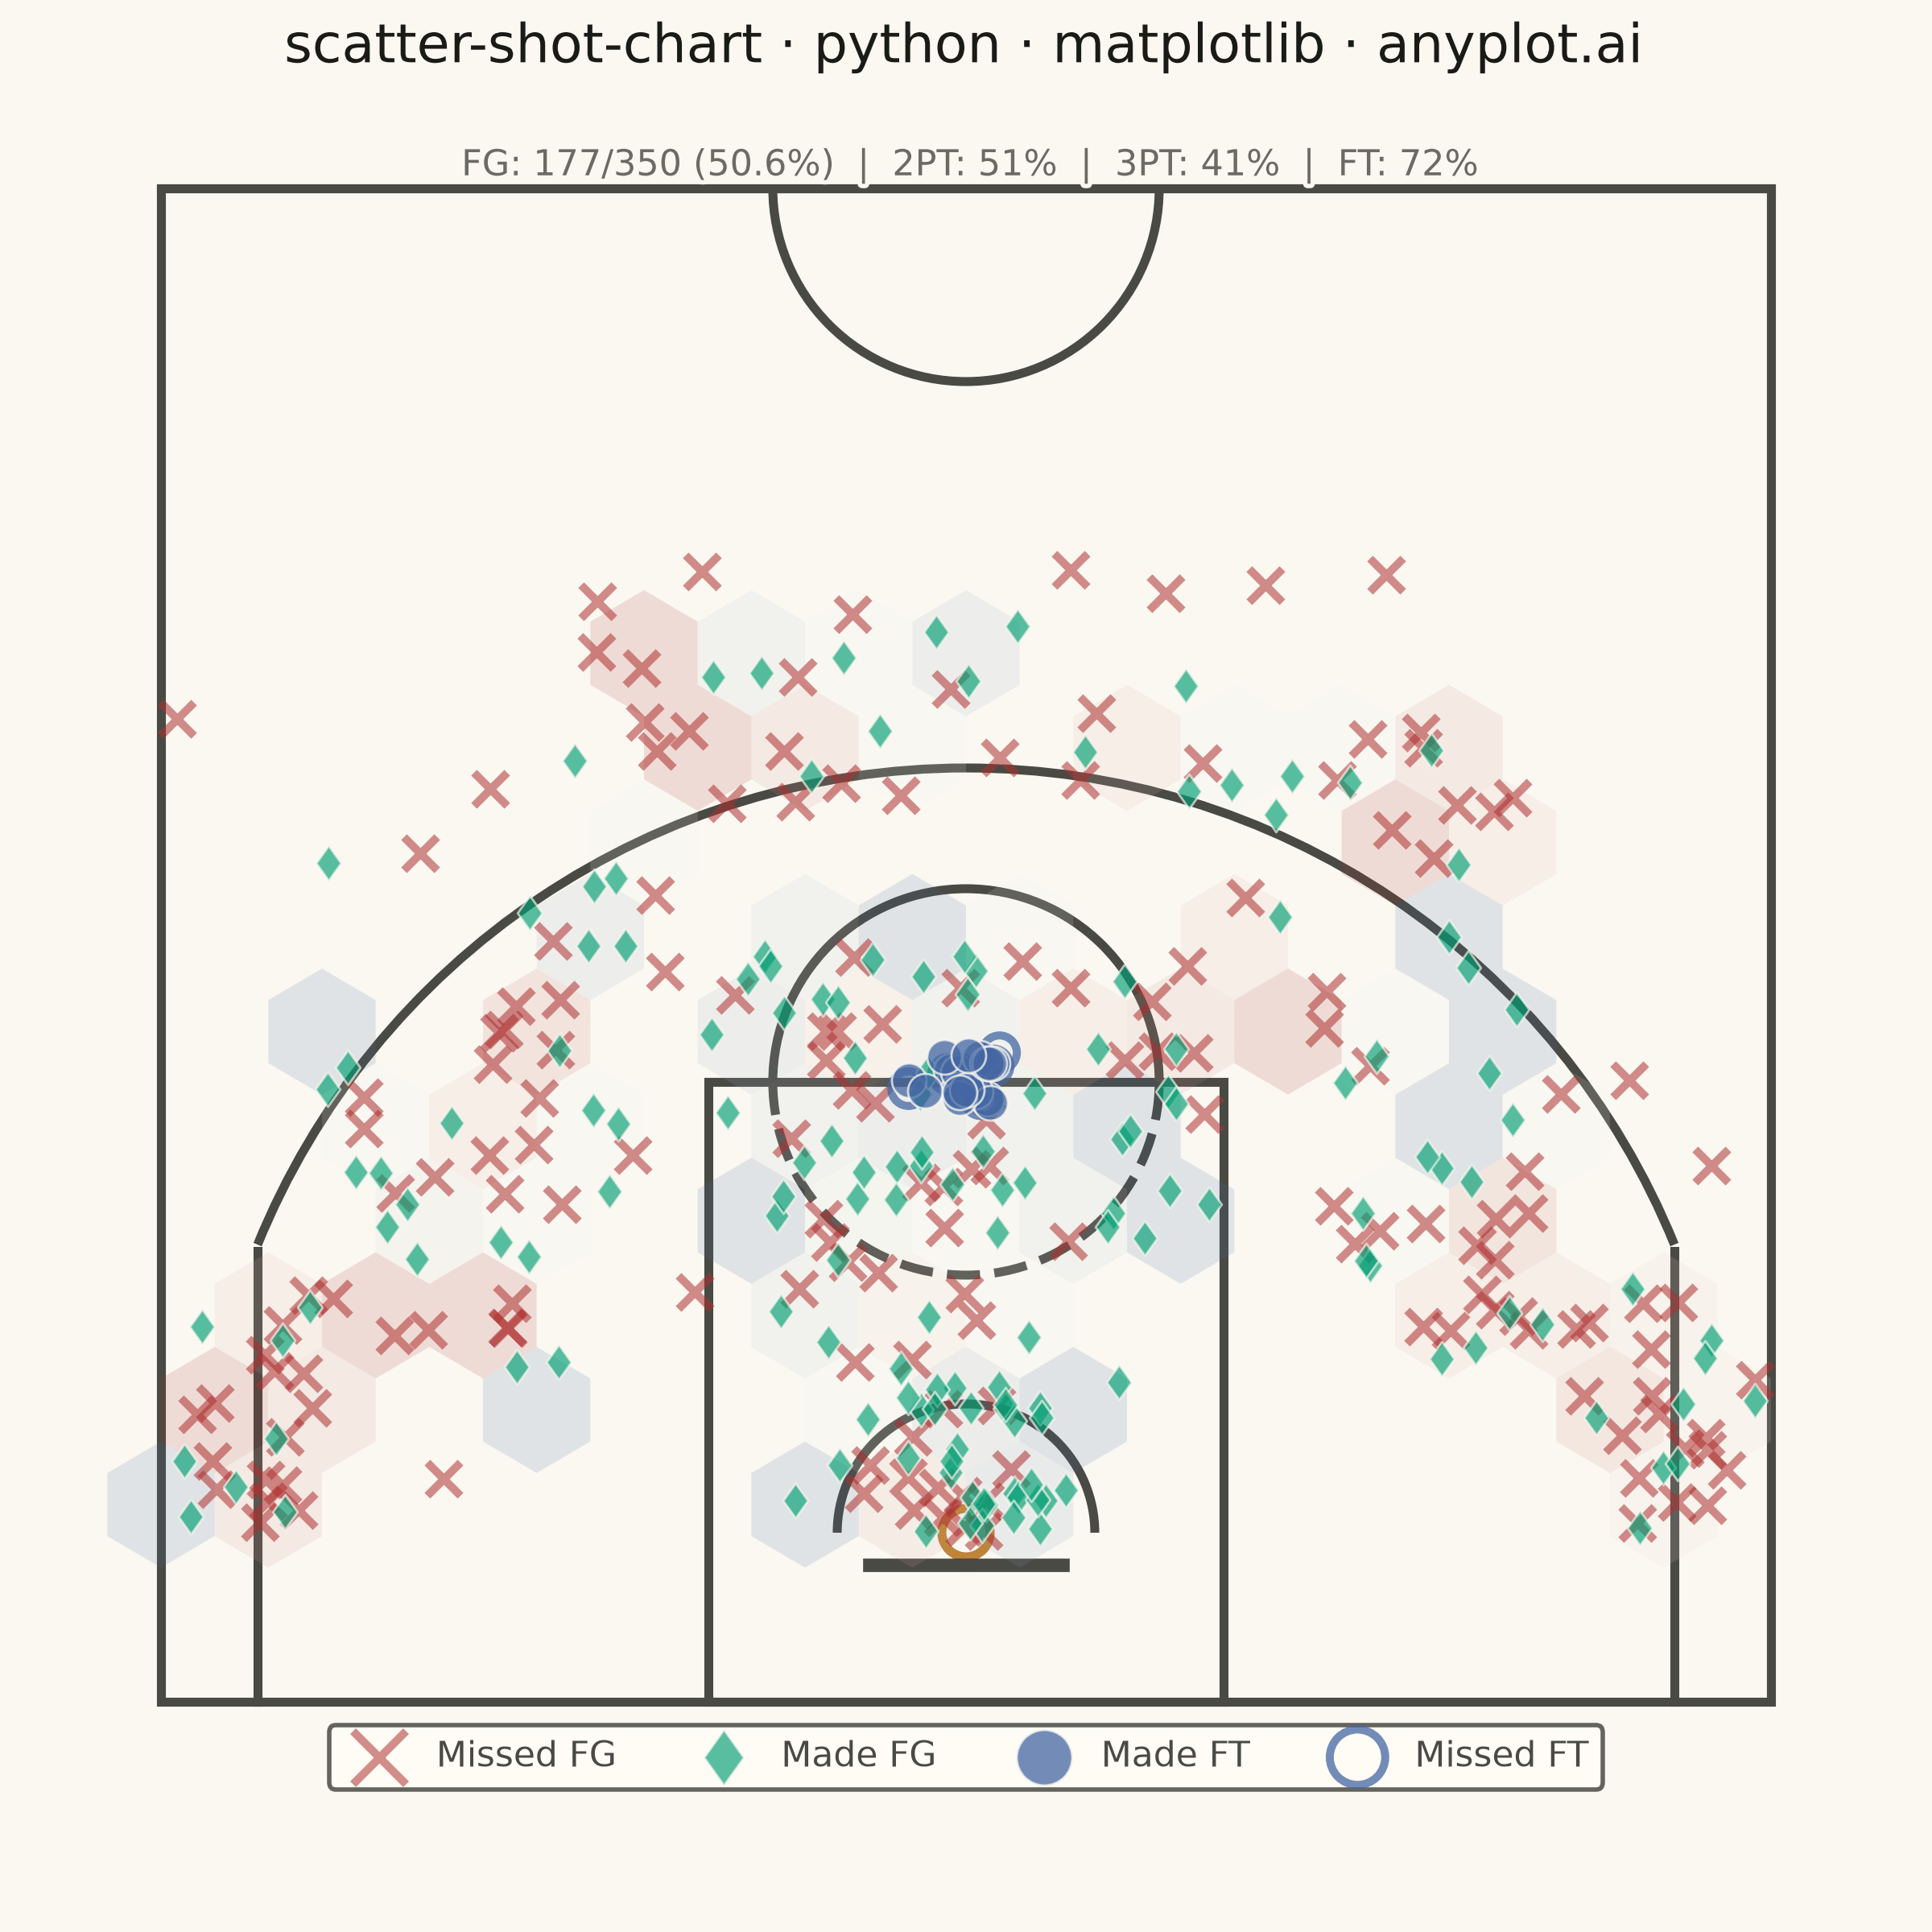
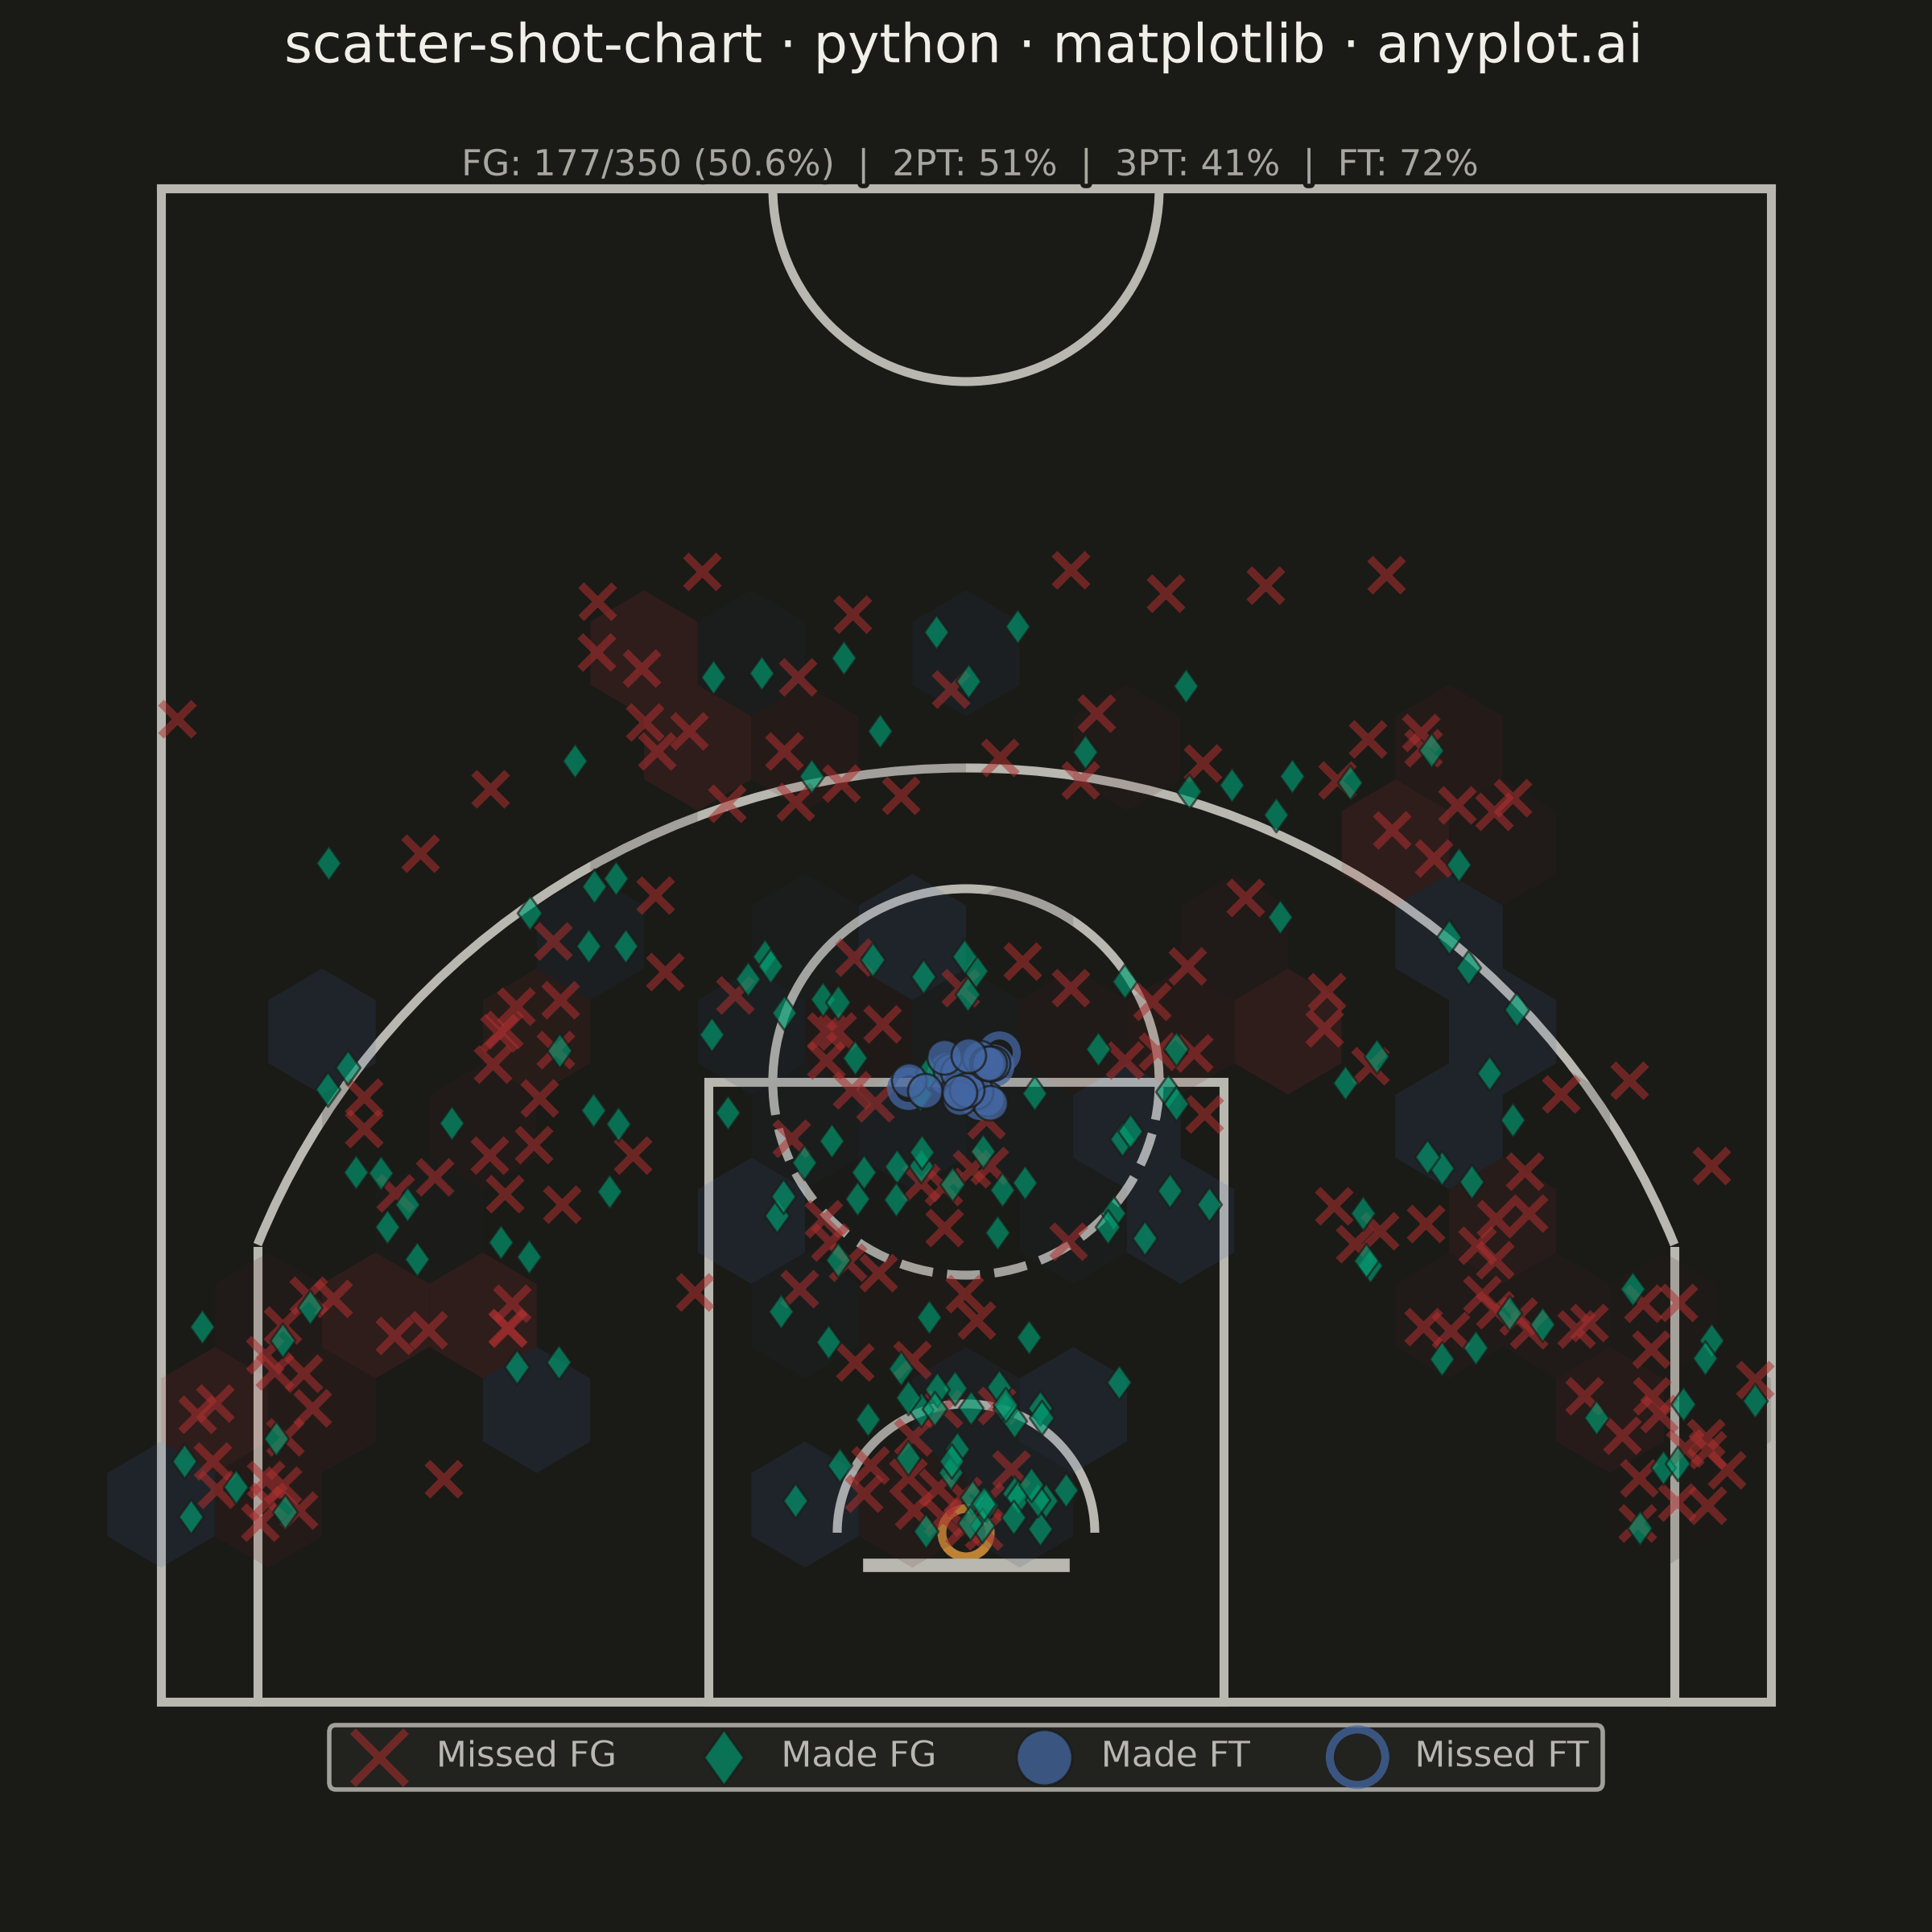
A basketball shot chart overlays shooting data on a half-court diagram, plotting each shot attempt as a point colored by outcome (made or missed). The court drawing includes the three-point arc, free-throw line, paint/key area, and basket, providing spatial context for analyzing shooting patterns and efficiency. Essential for basketball analytics and player evaluation.
""" anyplot.ai
scatter-shot-chart: Basketball Shot Chart
Library: matplotlib 3.11.0 | Python 3.13.14
Quality: 92/100 | Updated: 2026-06-21
"""

import os
import sys


# Prevent this script's filename from shadowing the installed matplotlib package
sys.path = [p for p in sys.path if os.path.abspath(p) != os.path.dirname(os.path.abspath(__file__))]

import matplotlib.patches as patches
import matplotlib.patheffects as pe
import matplotlib.pyplot as plt
import numpy as np
from matplotlib.colors import LinearSegmentedColormap
from matplotlib.path import Path


# Theme tokens — Imprint palette, theme-adaptive chrome
THEME = os.getenv("ANYPLOT_THEME", "light")
PAGE_BG = "#FAF8F1" if THEME == "light" else "#1A1A17"
ELEVATED_BG = "#FFFDF6" if THEME == "light" else "#242420"
INK = "#1A1A17" if THEME == "light" else "#F0EFE8"
INK_SOFT = "#4A4A44" if THEME == "light" else "#B8B7B0"
INK_MUTED = "#6B6A63" if THEME == "light" else "#A8A79F"

# Imprint palette — semantic mapping: made=green (good), missed=red (bad), FT=blue
C_MADE = "#009E73"  # brand green — made shots (position 1)
C_MISSED = "#AE3030"  # matte red — missed shots (semantic: bad/error, position 5)
C_FT = "#4467A3"  # blue — free-throw distinct shot type (position 3)

# Data
np.random.seed(42)

n_ft = 25
n_field = 325
n_shots = n_field + n_ft

# Field goal shot locations in feet relative to basket center at (0, 0)
x_field = np.concatenate(
    [
        np.random.normal(0, 3, 55),  # paint area shots
        np.random.normal(0, 1.5, 25),  # close to basket
        np.random.uniform(-8, 8, 50),  # mid-range middle
        np.random.normal(-15, 3, 35),  # left wing mid-range
        np.random.normal(15, 3, 35),  # right wing mid-range
        np.random.normal(-22, 1.5, 25),  # left corner three
        np.random.normal(22, 1.5, 25),  # right corner three
        np.random.normal(0, 8, 40),  # top of arc three
        np.random.normal(-12, 4, 18),  # left wing three
        np.random.normal(12, 4, 17),  # right wing three
    ]
)

y_field = np.concatenate(
    [
        np.random.uniform(0, 12, 55),  # paint
        np.random.uniform(0, 4, 25),  # close
        np.random.uniform(10, 18, 50),  # mid-range
        np.random.uniform(5, 15, 35),  # left wing mid
        np.random.uniform(5, 15, 35),  # right wing mid
        np.random.uniform(0, 8, 25),  # left corner
        np.random.uniform(0, 8, 25),  # right corner
        np.random.uniform(22, 30, 40),  # top of arc
        np.random.uniform(15, 25, 18),  # left wing three
        np.random.uniform(15, 25, 17),  # right wing three
    ]
)

# Free-throw shots clustered at the free-throw line (15 ft from backboard)
x_ft = np.random.normal(0, 0.8, n_ft)
y_ft = np.random.normal(14.0, 0.6, n_ft)

x = np.clip(np.concatenate([x_field, x_ft]), -24.5, 24.5)
y = np.clip(np.concatenate([y_field, y_ft]), 0, 40)

# Shot outcome — closer shots have higher make rate; free throws ~75%
distance = np.sqrt(x**2 + y**2)
make_prob = np.clip(0.65 - distance * 0.012, 0.25, 0.70)
make_prob[-n_ft:] = 0.75
made = np.random.random(n_shots) < make_prob

# Shot type based on distance from basket
three_pt_dist = np.where(np.abs(x) >= 22, 22.0, 23.75)
shot_type = np.array(
    ["3-pointer" if d >= t else "2-pointer" for d, t in zip(distance, three_pt_dist, strict=False)], dtype=object
)
shot_type[-n_ft:] = "free-throw"

# Plot — square canvas (1:1 aspect for undistorted court)
fig, ax = plt.subplots(figsize=(6, 6), dpi=400, facecolor=PAGE_BG)
ax.set_facecolor(PAGE_BG)

lw = 2.0

# Court geometry — theme-adaptive line color
court_patches = [
    patches.Rectangle((-25, -5.25), 50, 47, linewidth=lw, edgecolor=INK_SOFT, facecolor="none"),
    patches.Circle((0, 0), 0.75, linewidth=lw, edgecolor="#BD8233", facecolor="none"),
    patches.Rectangle((-8, -5.25), 16, 19.25, linewidth=lw, edgecolor=INK_SOFT, facecolor="none"),
    patches.Arc((0, 14.0), 12, 12, angle=0, theta1=0, theta2=180, linewidth=lw, edgecolor=INK_SOFT),
    patches.Arc((0, 14.0), 12, 12, angle=0, theta1=180, theta2=360, linewidth=lw, edgecolor=INK_SOFT, linestyle="--"),
    patches.Arc((0, 0), 8, 8, angle=0, theta1=0, theta2=180, linewidth=lw, edgecolor=INK_SOFT),
    patches.Arc((0, 41.75), 12, 12, angle=0, theta1=180, theta2=360, linewidth=lw, edgecolor=INK_SOFT),
]
for p in court_patches:
    ax.add_patch(p)

# Backboard
ax.plot([-3, 3], [-1.0, -1.0], color=INK_SOFT, linewidth=3)

# Three-point line corners and arc
ax.plot([-22, -22], [-5.25, 8.75], color=INK_SOFT, linewidth=lw)
ax.plot([22, 22], [-5.25, 8.75], color=INK_SOFT, linewidth=lw)
three_arc_angle = np.degrees(np.arccos(22.0 / 23.75))
ax.add_patch(
    patches.Arc(
        (0, 0),
        47.5,
        47.5,
        angle=90,
        theta1=-90 + three_arc_angle,
        theta2=90 - three_arc_angle,
        linewidth=lw,
        edgecolor=INK_SOFT,
    )
)

# Half-court line
ax.plot([-25, 25], [41.75, 41.75], color=INK_SOFT, linewidth=lw)

# Imprint diverging colormap for efficiency underlay (centered near 50% FG)
midpoint = "#FAF8F1" if THEME == "light" else "#1A1A17"
imprint_div = LinearSegmentedColormap.from_list("imprint_div", [C_MISSED, midpoint, "#4467A3"])
ax.hexbin(
    x,
    y,
    C=made.astype(float),
    gridsize=15,
    cmap=imprint_div,
    reduce_C_function=np.mean,
    alpha=0.14,
    extent=[-25, 25, -5, 42],
    mincnt=2,
    zorder=2,
    linewidths=0,
)

# Custom diamond marker for made field goals
diamond_verts = [(-0.5, 0), (0, 0.7), (0.5, 0), (0, -0.7), (-0.5, 0)]
diamond_codes = [Path.MOVETO, Path.LINETO, Path.LINETO, Path.LINETO, Path.CLOSEPOLY]
diamond_marker = Path(diamond_verts, diamond_codes)

# Shot masks
field_made = made & (shot_type != "free-throw")
field_missed = ~made & (shot_type != "free-throw")
ft_made = made & (shot_type == "free-throw")
ft_missed = ~made & (shot_type == "free-throw")

# Missed field goals — red X
ax.scatter(
    x[field_missed],
    y[field_missed],
    s=55,
    marker="x",
    c=C_MISSED,
    alpha=0.55,
    linewidths=1.8,
    zorder=4,
    label="Missed FG",
)
# Made field goals — green diamond
ax.scatter(
    x[field_made],
    y[field_made],
    s=60,
    marker=diamond_marker,
    c=C_MADE,
    alpha=0.65,
    edgecolors=PAGE_BG,
    linewidth=0.5,
    zorder=5,
    label="Made FG",
)
# Made free throws — blue filled circle
ax.scatter(
    x[ft_made],
    y[ft_made],
    s=60,
    marker="o",
    c=C_FT,
    alpha=0.75,
    edgecolors=PAGE_BG,
    linewidth=0.5,
    zorder=5,
    label="Made FT",
)
# Missed free throws — blue open circle, clearly distinct from missed field goals
ax.scatter(
    x[ft_missed],
    y[ft_missed],
    s=60,
    marker="o",
    c="none",
    edgecolors=C_FT,
    linewidths=1.8,
    alpha=0.75,
    zorder=4,
    label="Missed FT",
)

# Style
ax.set_xlim(-27, 27)
ax.set_ylim(-7, 44)
ax.set_aspect("equal")
ax.axis("off")

title = "scatter-shot-chart · python · matplotlib · anyplot.ai"
ax.set_title(
    title,
    fontsize=12,
    fontweight="medium",
    color=INK,
    pad=12,
    path_effects=[pe.withStroke(linewidth=3, foreground=PAGE_BG)],
)

# Legend — 4 entries to distinguish all shot outcome × type combinations
legend = ax.legend(
    loc="lower center",
    ncol=4,
    fontsize=8,
    framealpha=0.85,
    facecolor=ELEVATED_BG,
    edgecolor=INK_SOFT,
    bbox_to_anchor=(0.5, -0.03),
    markerscale=1.6,
    handletextpad=0.6,
)
plt.setp(legend.get_texts(), color=INK_SOFT)

# Shooting summary
total = n_shots
makes = int(made.sum())
fg_pct = makes / total * 100
twos = shot_type == "2-pointer"
threes = shot_type == "3-pointer"
fts = shot_type == "free-throw"
fg2 = made[twos].sum() / twos.sum() * 100 if twos.sum() > 0 else 0
fg3 = made[threes].sum() / threes.sum() * 100 if threes.sum() > 0 else 0
ft_pct = made[fts].sum() / fts.sum() * 100 if fts.sum() > 0 else 0
summary = f"FG: {makes}/{total} ({fg_pct:.1f}%)  |  2PT: {fg2:.0f}%  |  3PT: {fg3:.0f}%  |  FT: {ft_pct:.0f}%"
ax.text(
    0,
    43.0,
    summary,
    fontsize=8,
    color=INK_MUTED,
    ha="center",
    va="top",
    path_effects=[pe.withStroke(linewidth=2, foreground=PAGE_BG)],
)

fig.subplots_adjust(left=0.02, right=0.98, top=0.94, bottom=0.09)

# Save — no bbox_inches='tight' to preserve exact 2400×2400 canvas
plt.savefig(f"plot-{THEME}.png", dpi=400, facecolor=PAGE_BG)
Runnable source as JSON, for any HTTP client: https://api.anyplot.ai/specs/scatter-shot-chart/matplotlib/code. Any spec id and library id listed in llms-full.txt fit the same URL shape; every URL below is complete and callable.
{
  "spec_id": "scatter-shot-chart",
  "language": "python",
  "library": "matplotlib",
  "page": "https://anyplot.ai/scatter-shot-chart/python/matplotlib",
  "hub": "https://anyplot.ai/scatter-shot-chart",
  "code_json": "https://api.anyplot.ai/specs/scatter-shot-chart/matplotlib/code",
  "spec_json": "https://api.anyplot.ai/specs/scatter-shot-chart",
  "render_light_png": "https://storage.googleapis.com/anyplot-images/plots/scatter-shot-chart/python/matplotlib/plot-light.png",
  "render_dark_png": "https://storage.googleapis.com/anyplot-images/plots/scatter-shot-chart/python/matplotlib/plot-dark.png",
  "quality_score": 92.0,
  "license": "MIT",
  "guide": "https://anyplot.ai/llms.txt"
}
Part of Basketball Shot Chart on anyplot.ai.