The same plot in 14 other libraries — JavaScript: D3.js, Apache ECharts, Highcharts, MUI X Charts; Python: Altair, Bokeh, lets-plot, Matplotlib, Plotly, plotnine, Pygal, Seaborn; R: ggplot2; Julia: Makie.jl. Compare all 15 side by side: Sequence Logo for Motif Visualization in Python, R, Julia and JavaScript.
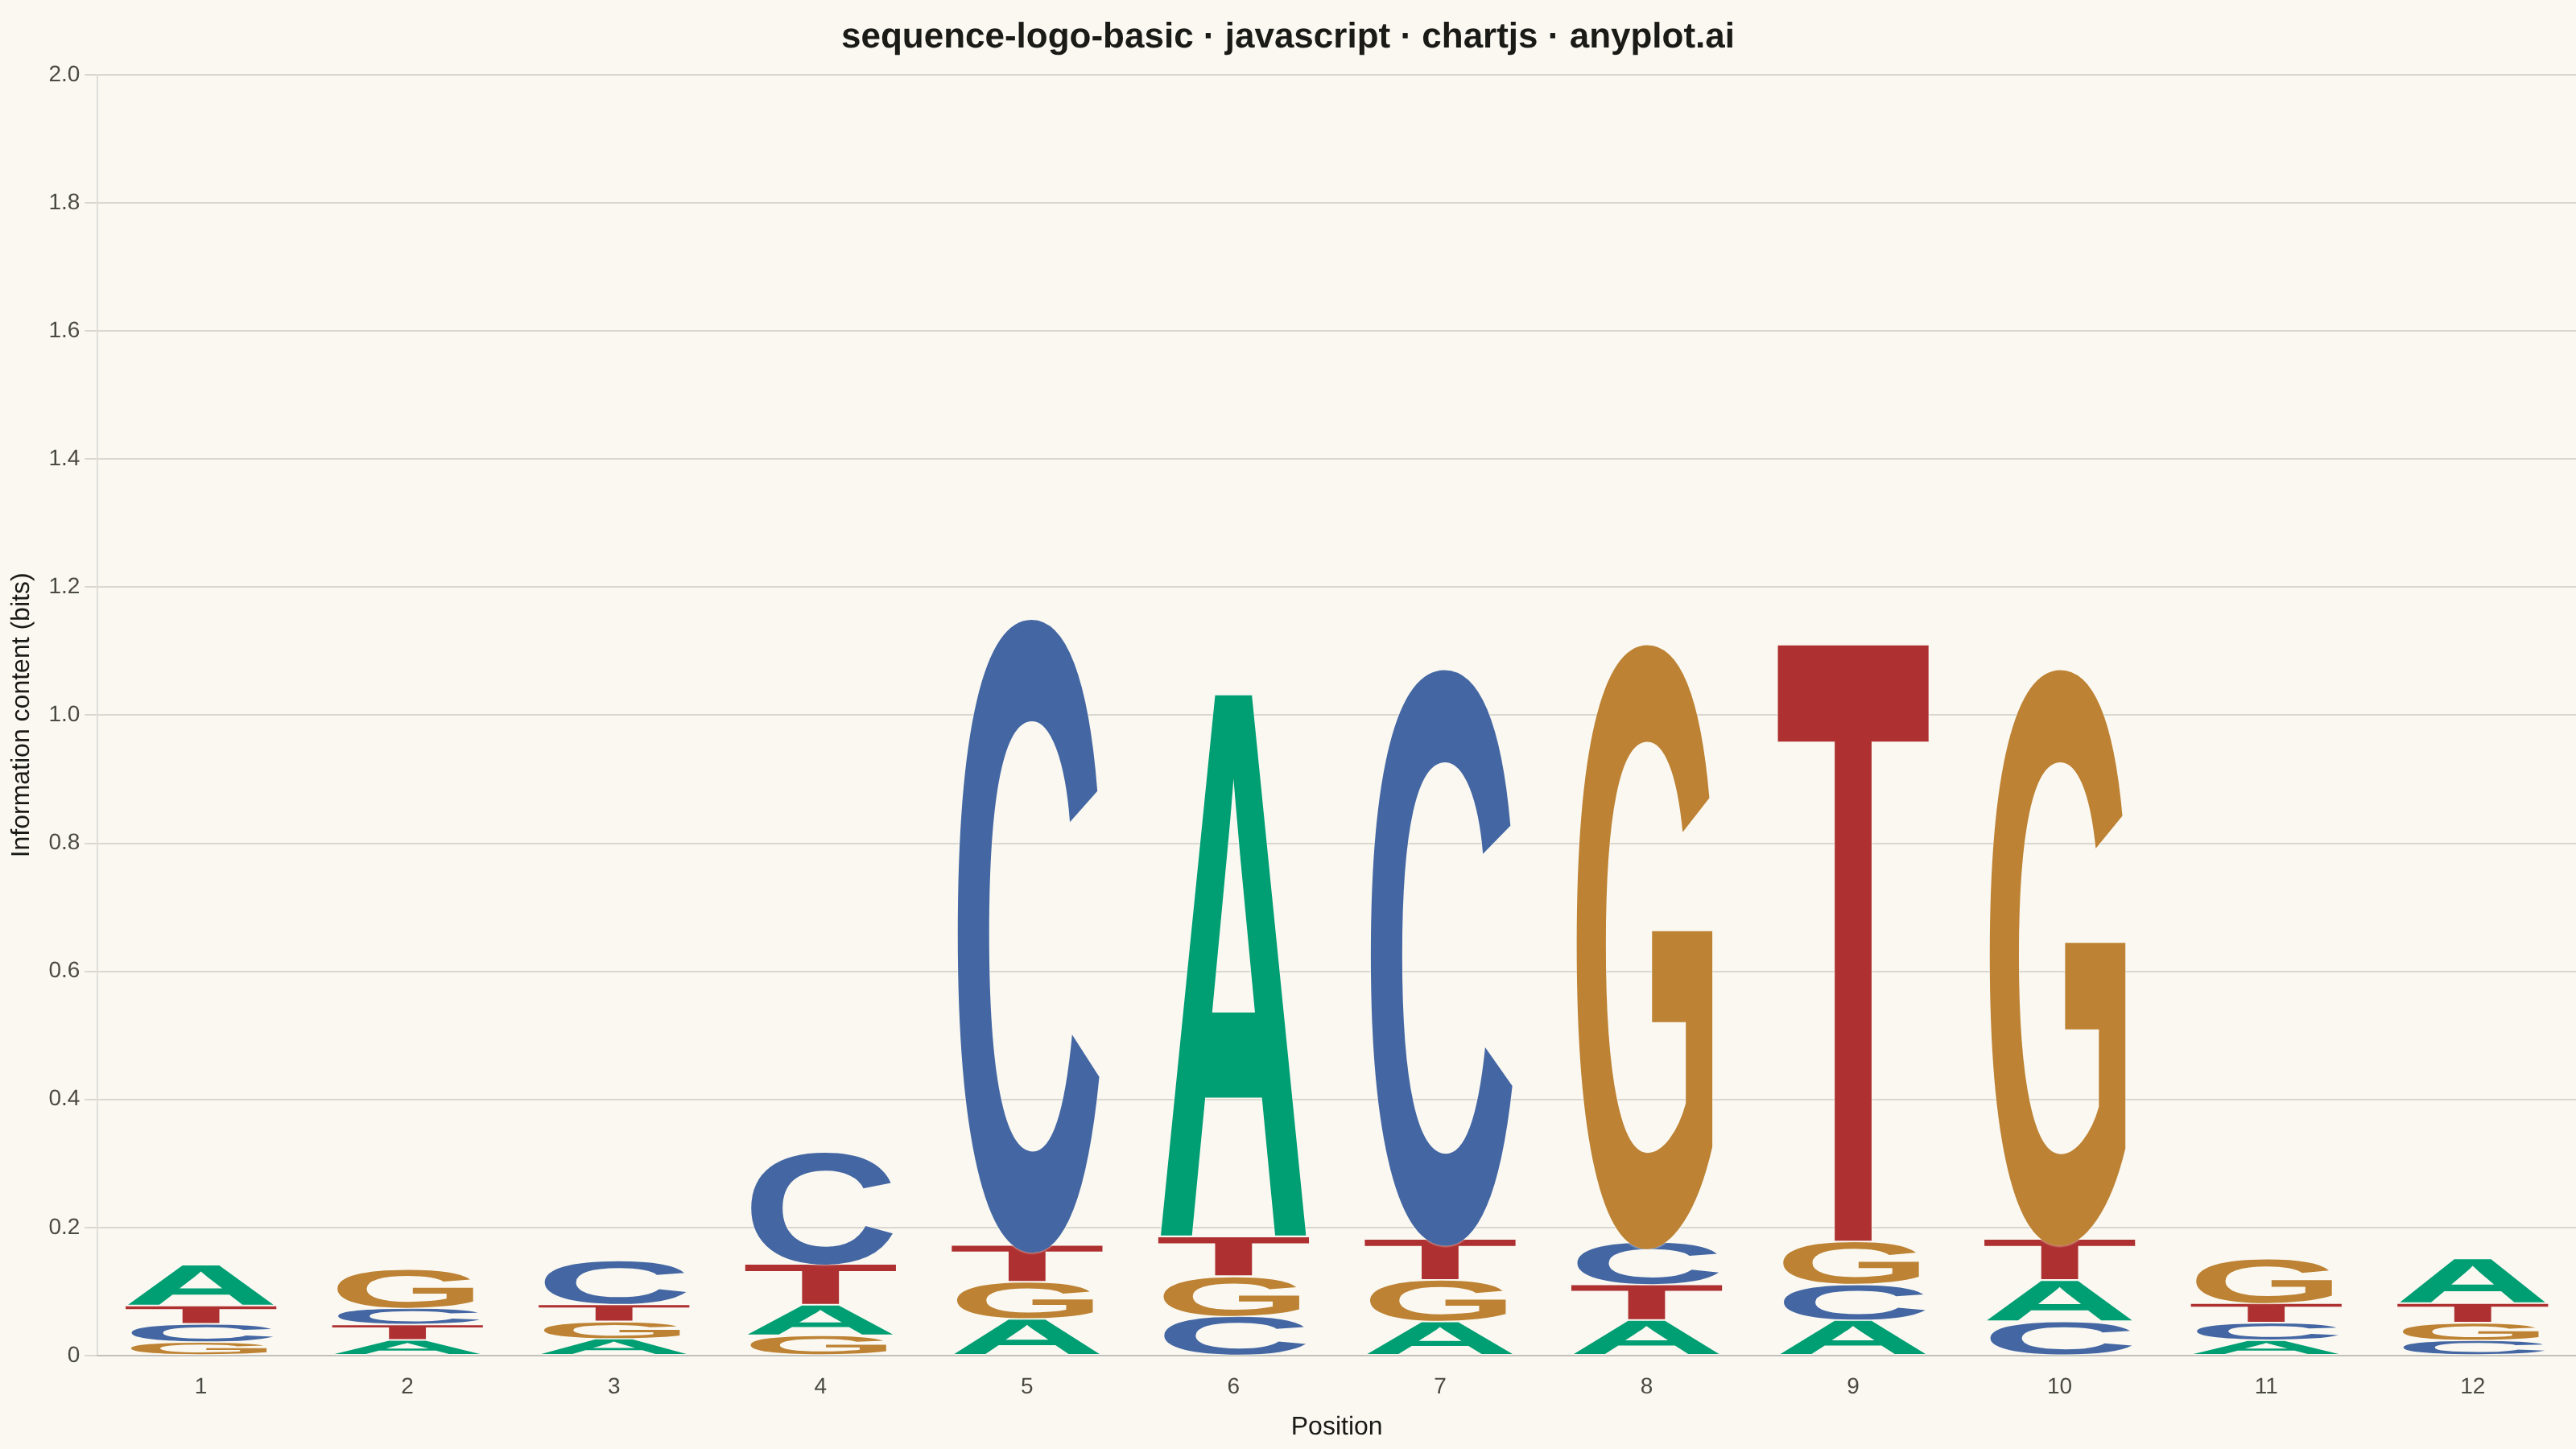
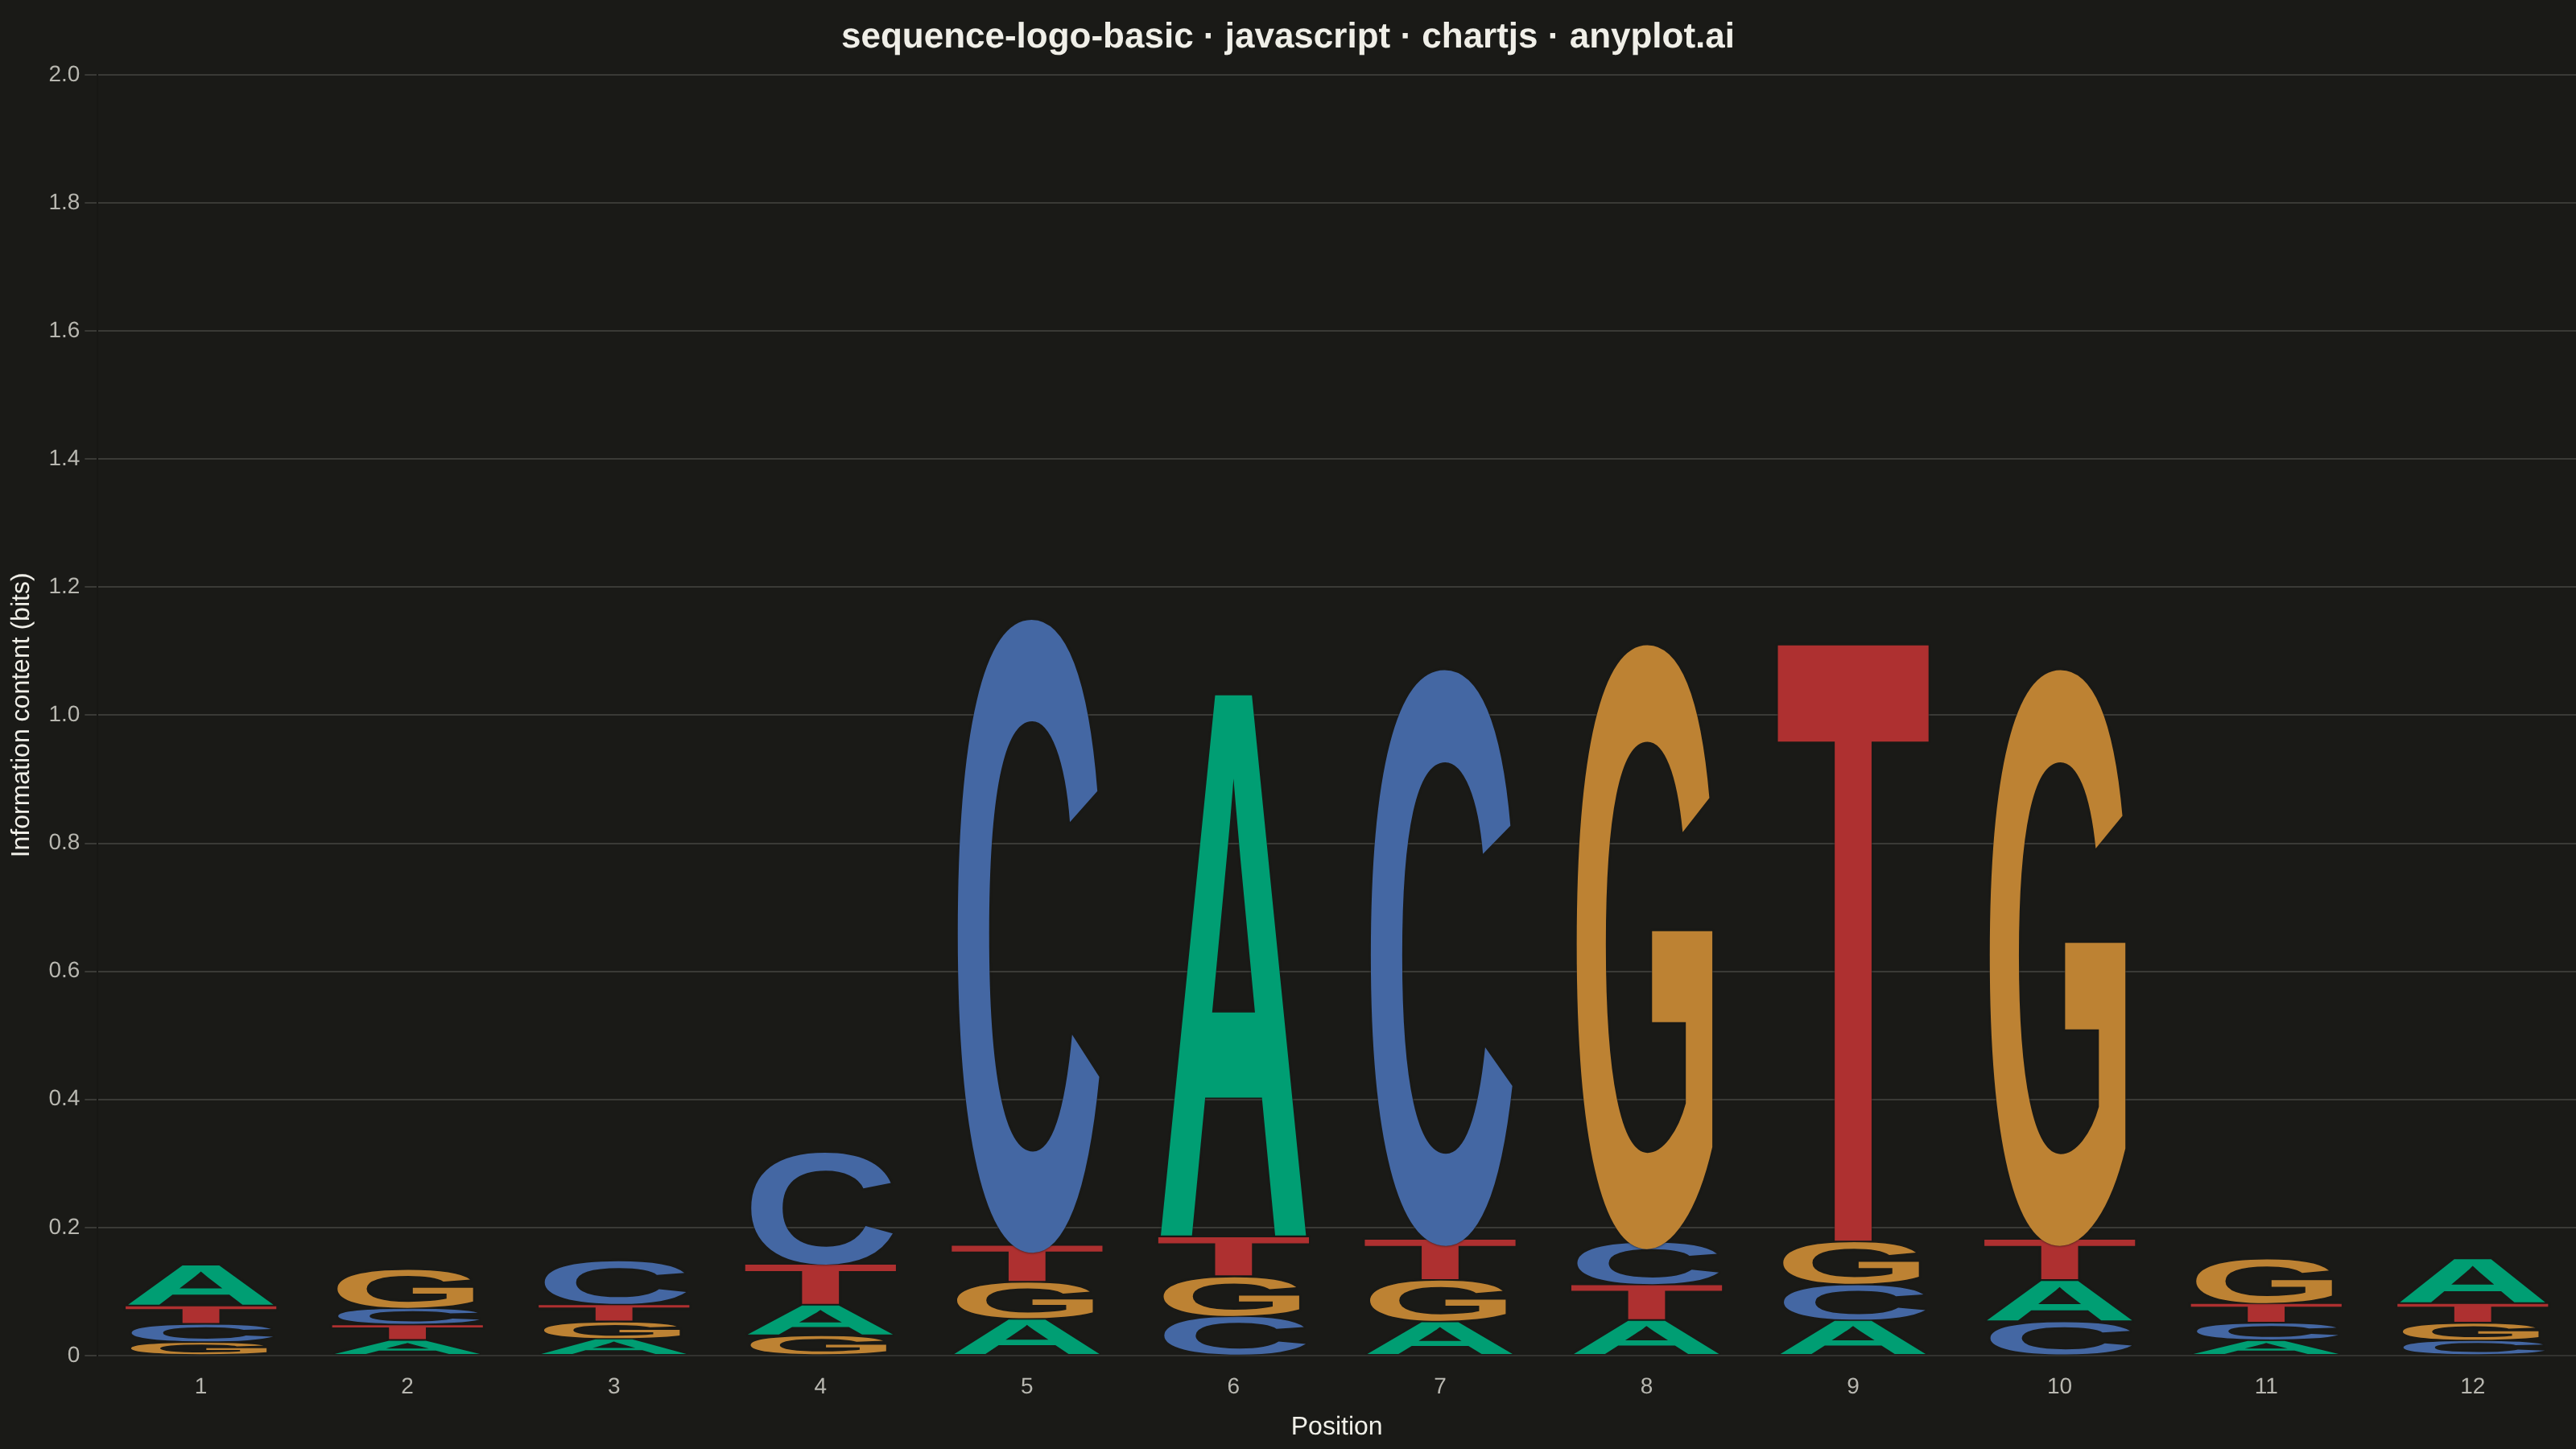
A sequence logo visualizes the consensus of multiple aligned DNA, RNA, or protein sequences. At each position, letters are stacked vertically with height proportional to information content (measured in bits), and individual letter heights within the stack reflect their relative frequency. This is the standard visualization for identifying conserved positions in transcription factor binding sites, splice sites, and protein domains.
// anyplot.ai
// sequence-logo-basic: Sequence Logo for Motif Visualization
// Library: chartjs 4.4.7 | JavaScript 22.23.2
// Quality: 94/100 | Created: 2026-08-26

const t = window.ANYPLOT_TOKENS;

// --- Data (in-memory, deterministic) -----------------------------------------
// 12-bp transcription-factor binding site: a highly conserved E-box core
// (CACGTG, the canonical bHLH recognition motif) flanked by weakly-preferred
// positions, letter order [A, C, G, T].
const letters = ["A", "C", "G", "T"];
const frequencyMatrix = [
  [0.45, 0.2, 0.15, 0.2],
  [0.18, 0.19, 0.45, 0.18],
  [0.18, 0.46, 0.18, 0.18],
  [0.15, 0.55, 0.1, 0.2],
  [0.05, 0.85, 0.05, 0.05],
  [0.82, 0.06, 0.06, 0.06],
  [0.05, 0.83, 0.06, 0.06],
  [0.05, 0.06, 0.84, 0.05],
  [0.05, 0.05, 0.06, 0.84],
  [0.06, 0.05, 0.83, 0.06],
  [0.16, 0.18, 0.46, 0.2],
  [0.46, 0.16, 0.18, 0.2],
];
const positions = frequencyMatrix.map((_, i) => i + 1);
const MAX_BITS = 2; // log2(4) -- max information content for a 4-letter DNA alphabet

// Standard nucleotide color convention (A=green, C=blue, G=orange/yellow,
// T=red) mapped onto the closest Imprint hues -- the Semantic Exception in
// prompts/default-style-guide.md permits this reassignment because the
// association is a widely shared domain convention, not an arbitrary choice.
const letterColor = {
  A: t.palette[0], // green
  C: t.palette[2], // blue
  G: t.palette[3], // ochre (stands in for orange/yellow)
  T: t.palette[4], // red
};

// Shannon information content per position, R(i) = max_bits - entropy(i).
const infoContent = frequencyMatrix.map((freqs) => {
  const entropy = freqs.reduce(
    (sum, p) => (p > 0 ? sum - p * Math.log2(p) : sum),
    0,
  );
  return MAX_BITS - entropy;
});

// Stack order per position, ascending by frequency, so the most frequent
// letter is drawn last (on top of the stack) -- per the spec's "most
// frequent on top" rule.
const rankedLetters = frequencyMatrix.map((freqs) =>
  letters
    .map((letter, idx) => ({ letter, freq: freqs[idx] }))
    .sort((a, b) => a.freq - b.freq),
);

// One Chart.js dataset per stack rank; each bar segment's height is that
// rank's letter frequency scaled by the position's information content.
// Segments are invisible (transparent) -- Chart.js only supplies the
// stacked layout math, the glyphs themselves are drawn by the plugin below.
const datasets = letters.map((_, rank) => ({
  data: positions.map((_, i) => rankedLetters[i][rank].freq * infoContent[i]),
  stack: "logo",
  backgroundColor: "transparent",
  borderWidth: 0,
  categoryPercentage: 1.0,
  barPercentage: 0.86,
}));

// --- Glyph-stacking plugin ---------------------------------------------------
// Draws each letter as a glyph stretched (non-uniform scale) to exactly fill
// its stack segment's rectangle, using the pixel geometry Chart.js already
// computed for the (invisible) bar segments.
const sequenceLogoGlyphs = {
  id: "sequenceLogoGlyphs",
  afterDatasetsDraw(chart) {
    const ctx = chart.ctx;
    ctx.save();
    ctx.textAlign = "center";
    ctx.textBaseline = "alphabetic";
    ctx.font = '800 100px "Arial", "Helvetica Neue", sans-serif';
    for (let rank = 0; rank < letters.length; rank++) {
      const meta = chart.getDatasetMeta(rank);
      for (let i = 0; i < positions.length; i++) {
        const value = chart.data.datasets[rank].data[i];
        if (!value) continue;
        const el = meta.data[i];
        if (!el) continue;

        const rectWidth = el.width * 0.88;
        const rectTop = el.y + 0.5;
        const rectBottom = el.base - 0.5;
        const rectHeight = rectBottom - rectTop;
        if (rectHeight <= 0) continue;

        const letter = rankedLetters[i][rank].letter;
        const metrics = ctx.measureText(letter);
        const naturalWidth = metrics.width;
        const naturalHeight = metrics.actualBoundingBoxAscent || 72;

        // Shadow (unlike stroke) isn't stretched by the non-uniform glyph
        // scale below, so it gives a crisp, undistorted separation edge.
        ctx.save();
        ctx.shadowColor = t.pageBg;
        ctx.shadowBlur = 3;
        ctx.translate(el.x, rectBottom);
        ctx.scale(rectWidth / naturalWidth, rectHeight / naturalHeight);
        ctx.fillStyle = letterColor[letter];
        ctx.fillText(letter, 0, 0);
        ctx.restore();
      }
    }
    ctx.restore();
  },
};

// --- Mount --------------------------------------------------------------------
const canvas = document.createElement("canvas");
document.getElementById("container").appendChild(canvas);

// --- Chart --------------------------------------------------------------------
new Chart(canvas, {
  type: "bar",
  plugins: [sequenceLogoGlyphs],
  data: {
    labels: positions.map(String),
    datasets,
  },
  options: {
    responsive: true,
    maintainAspectRatio: false,
    animation: false,
    plugins: {
      title: {
        display: true,
        text: "sequence-logo-basic · javascript · chartjs · anyplot.ai",
        color: t.ink,
        font: { size: 22 },
      },
      legend: { display: false },
      tooltip: { enabled: false },
    },
    scales: {
      x: {
        stacked: true,
        ticks: { color: t.inkSoft, font: { size: 14 } },
        grid: { display: false },
        title: { display: true, text: "Position", color: t.ink, font: { size: 16 } },
      },
      y: {
        stacked: true,
        min: 0,
        max: MAX_BITS,
        ticks: { color: t.inkSoft, font: { size: 14 } },
        grid: { color: t.grid },
        title: {
          display: true,
          text: "Information content (bits)",
          color: t.ink,
          font: { size: 16 },
        },
      },
    },
  },
});
Runnable source as JSON, for any HTTP client: https://api.anyplot.ai/specs/sequence-logo-basic/chartjs/code. Any spec id and library id listed in llms-full.txt fit the same URL shape; every URL below is complete and callable.
{
  "spec_id": "sequence-logo-basic",
  "language": "javascript",
  "library": "chartjs",
  "page": "https://anyplot.ai/sequence-logo-basic/javascript/chartjs",
  "hub": "https://anyplot.ai/sequence-logo-basic",
  "code_json": "https://api.anyplot.ai/specs/sequence-logo-basic/chartjs/code",
  "spec_json": "https://api.anyplot.ai/specs/sequence-logo-basic",
  "render_light_png": "https://storage.googleapis.com/anyplot-images/plots/sequence-logo-basic/javascript/chartjs/plot-light.png",
  "render_dark_png": "https://storage.googleapis.com/anyplot-images/plots/sequence-logo-basic/javascript/chartjs/plot-dark.png",
  "interactive_light_html": "https://storage.googleapis.com/anyplot-images/plots/sequence-logo-basic/javascript/chartjs/plot-light.html",
  "interactive_dark_html": "https://storage.googleapis.com/anyplot-images/plots/sequence-logo-basic/javascript/chartjs/plot-dark.html",
  "quality_score": 94.0,
  "license": "MIT",
  "guide": "https://anyplot.ai/llms.txt"
}
Part of Sequence Logo for Motif Visualization on anyplot.ai.