The same plot in 14 other libraries — JavaScript: Chart.js, D3.js, Apache ECharts, MUI X Charts; Python: Altair, Bokeh, lets-plot, Matplotlib, Plotly, plotnine, Pygal, Seaborn; R: ggplot2; Julia: Makie.jl. Compare all 15 side by side: Sequence Logo for Motif Visualization in Python, R, Julia and JavaScript.
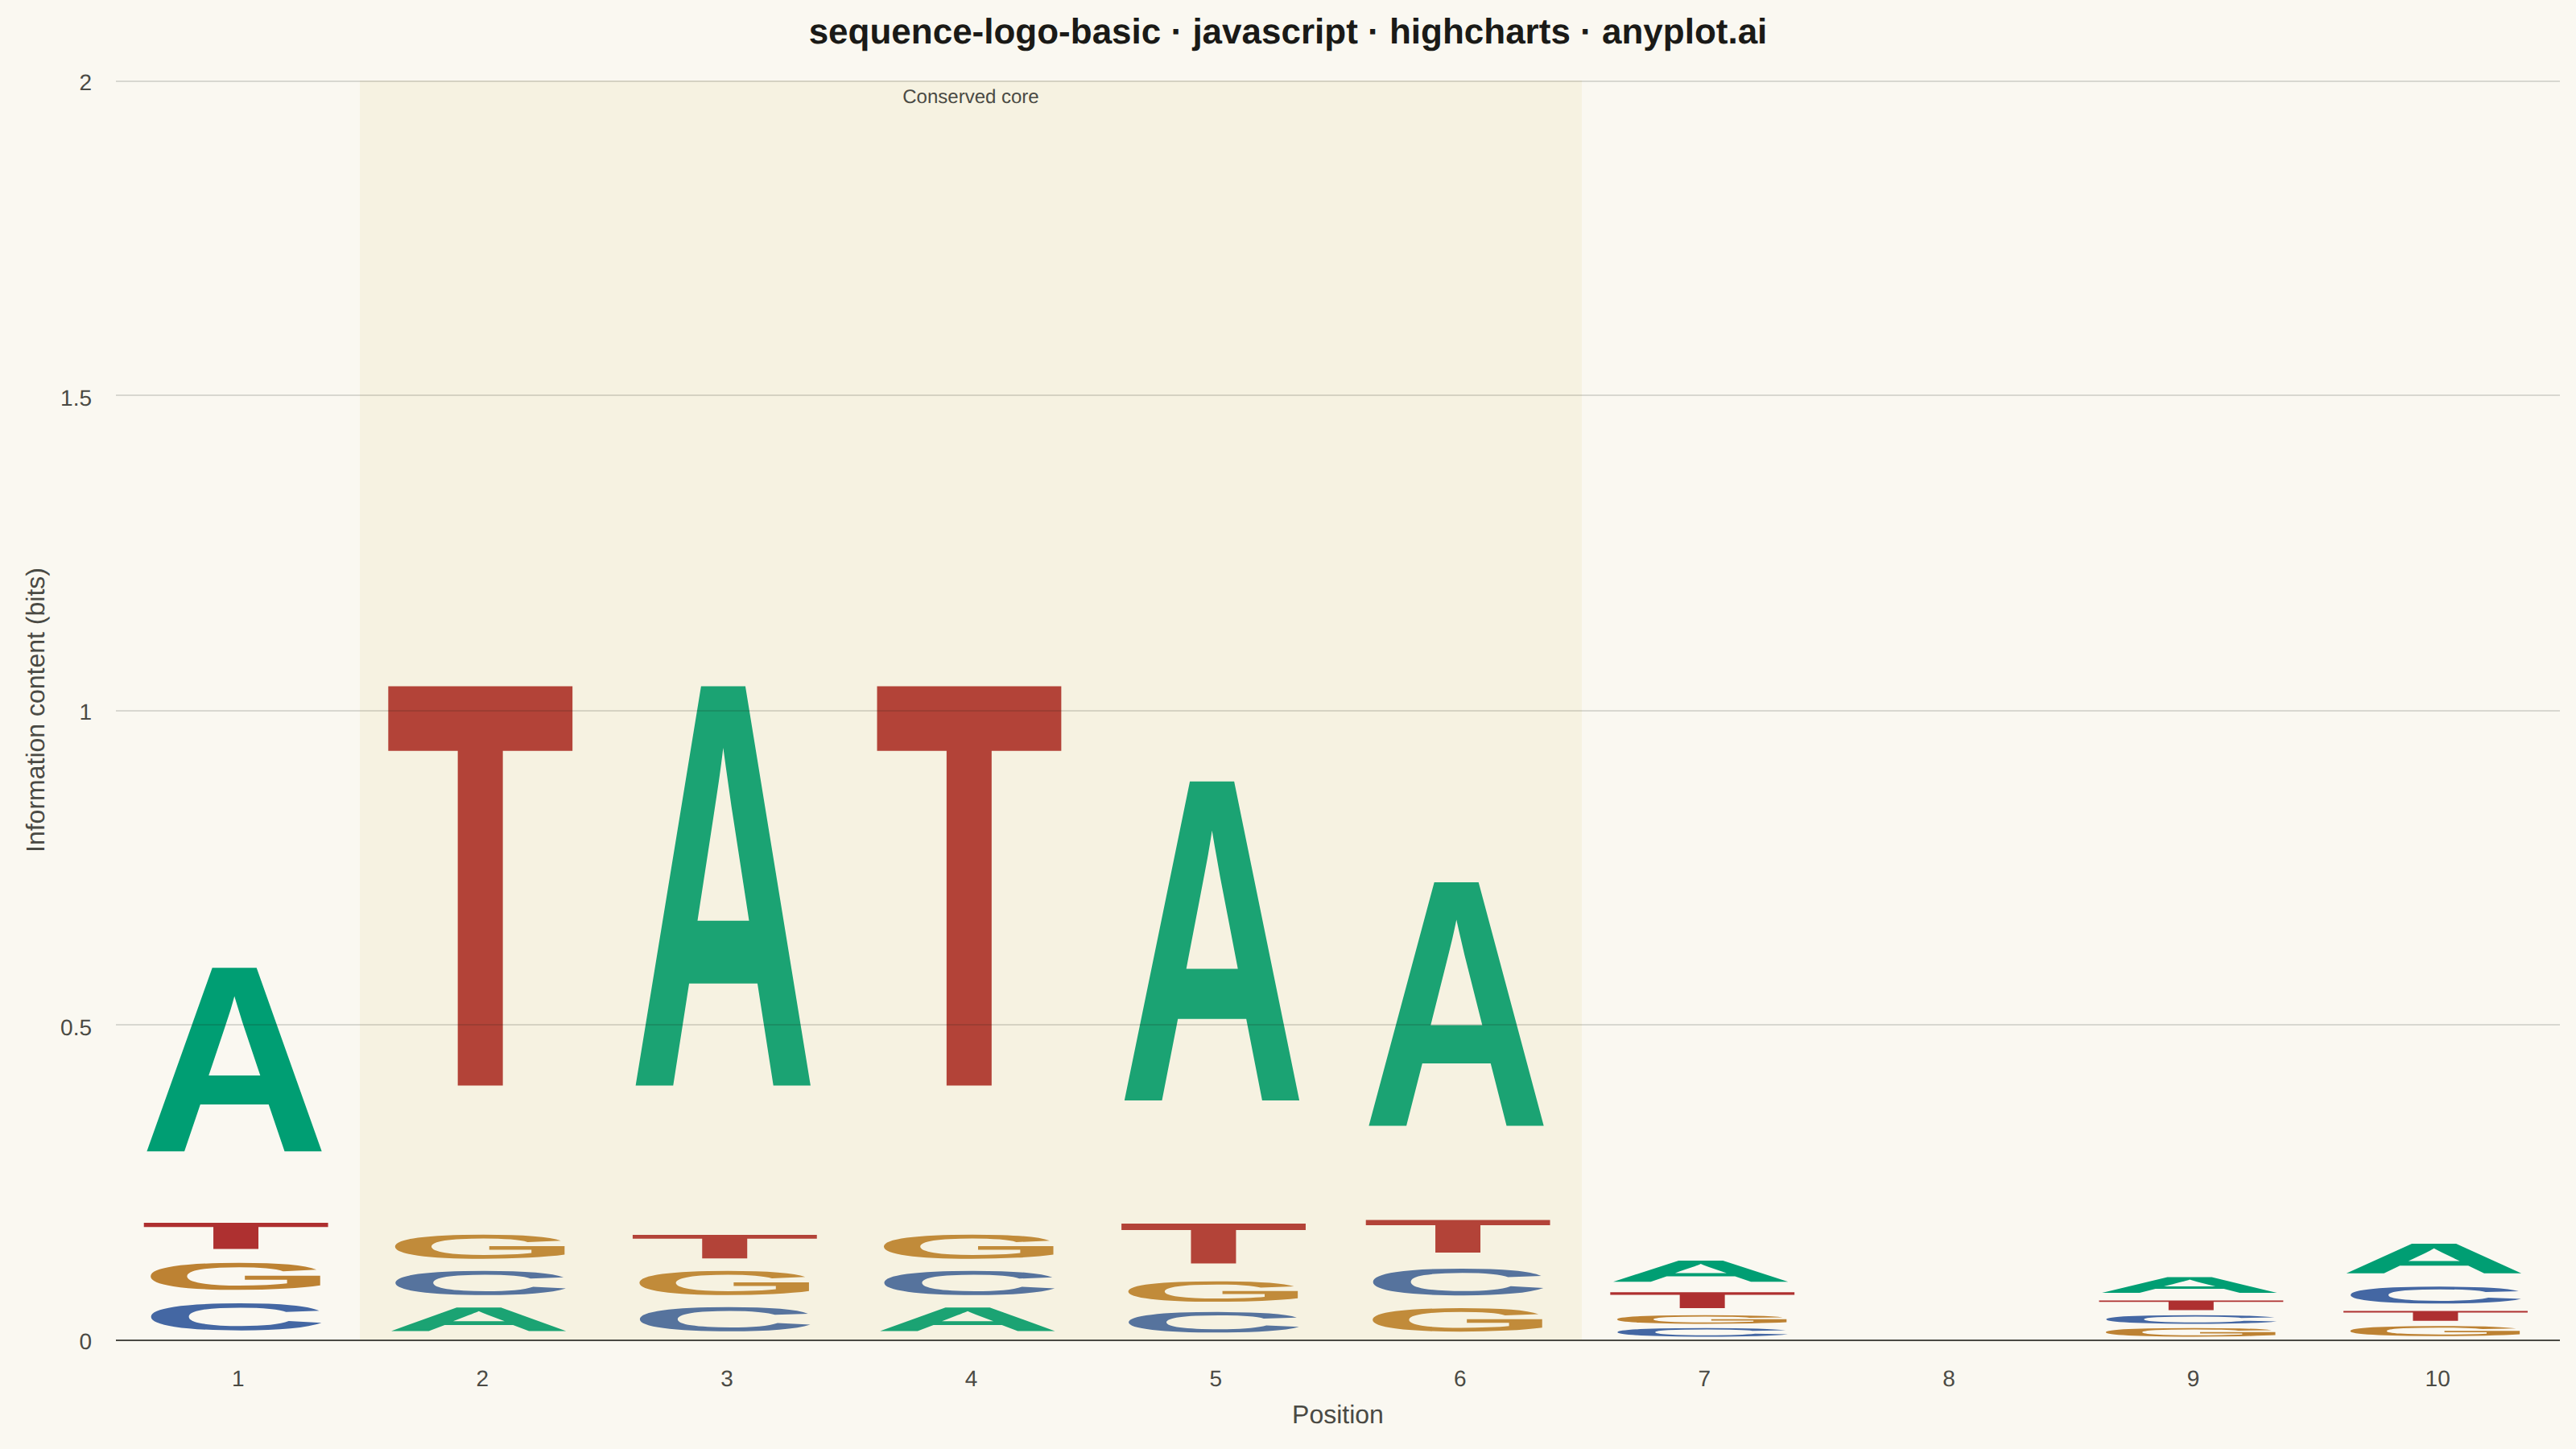
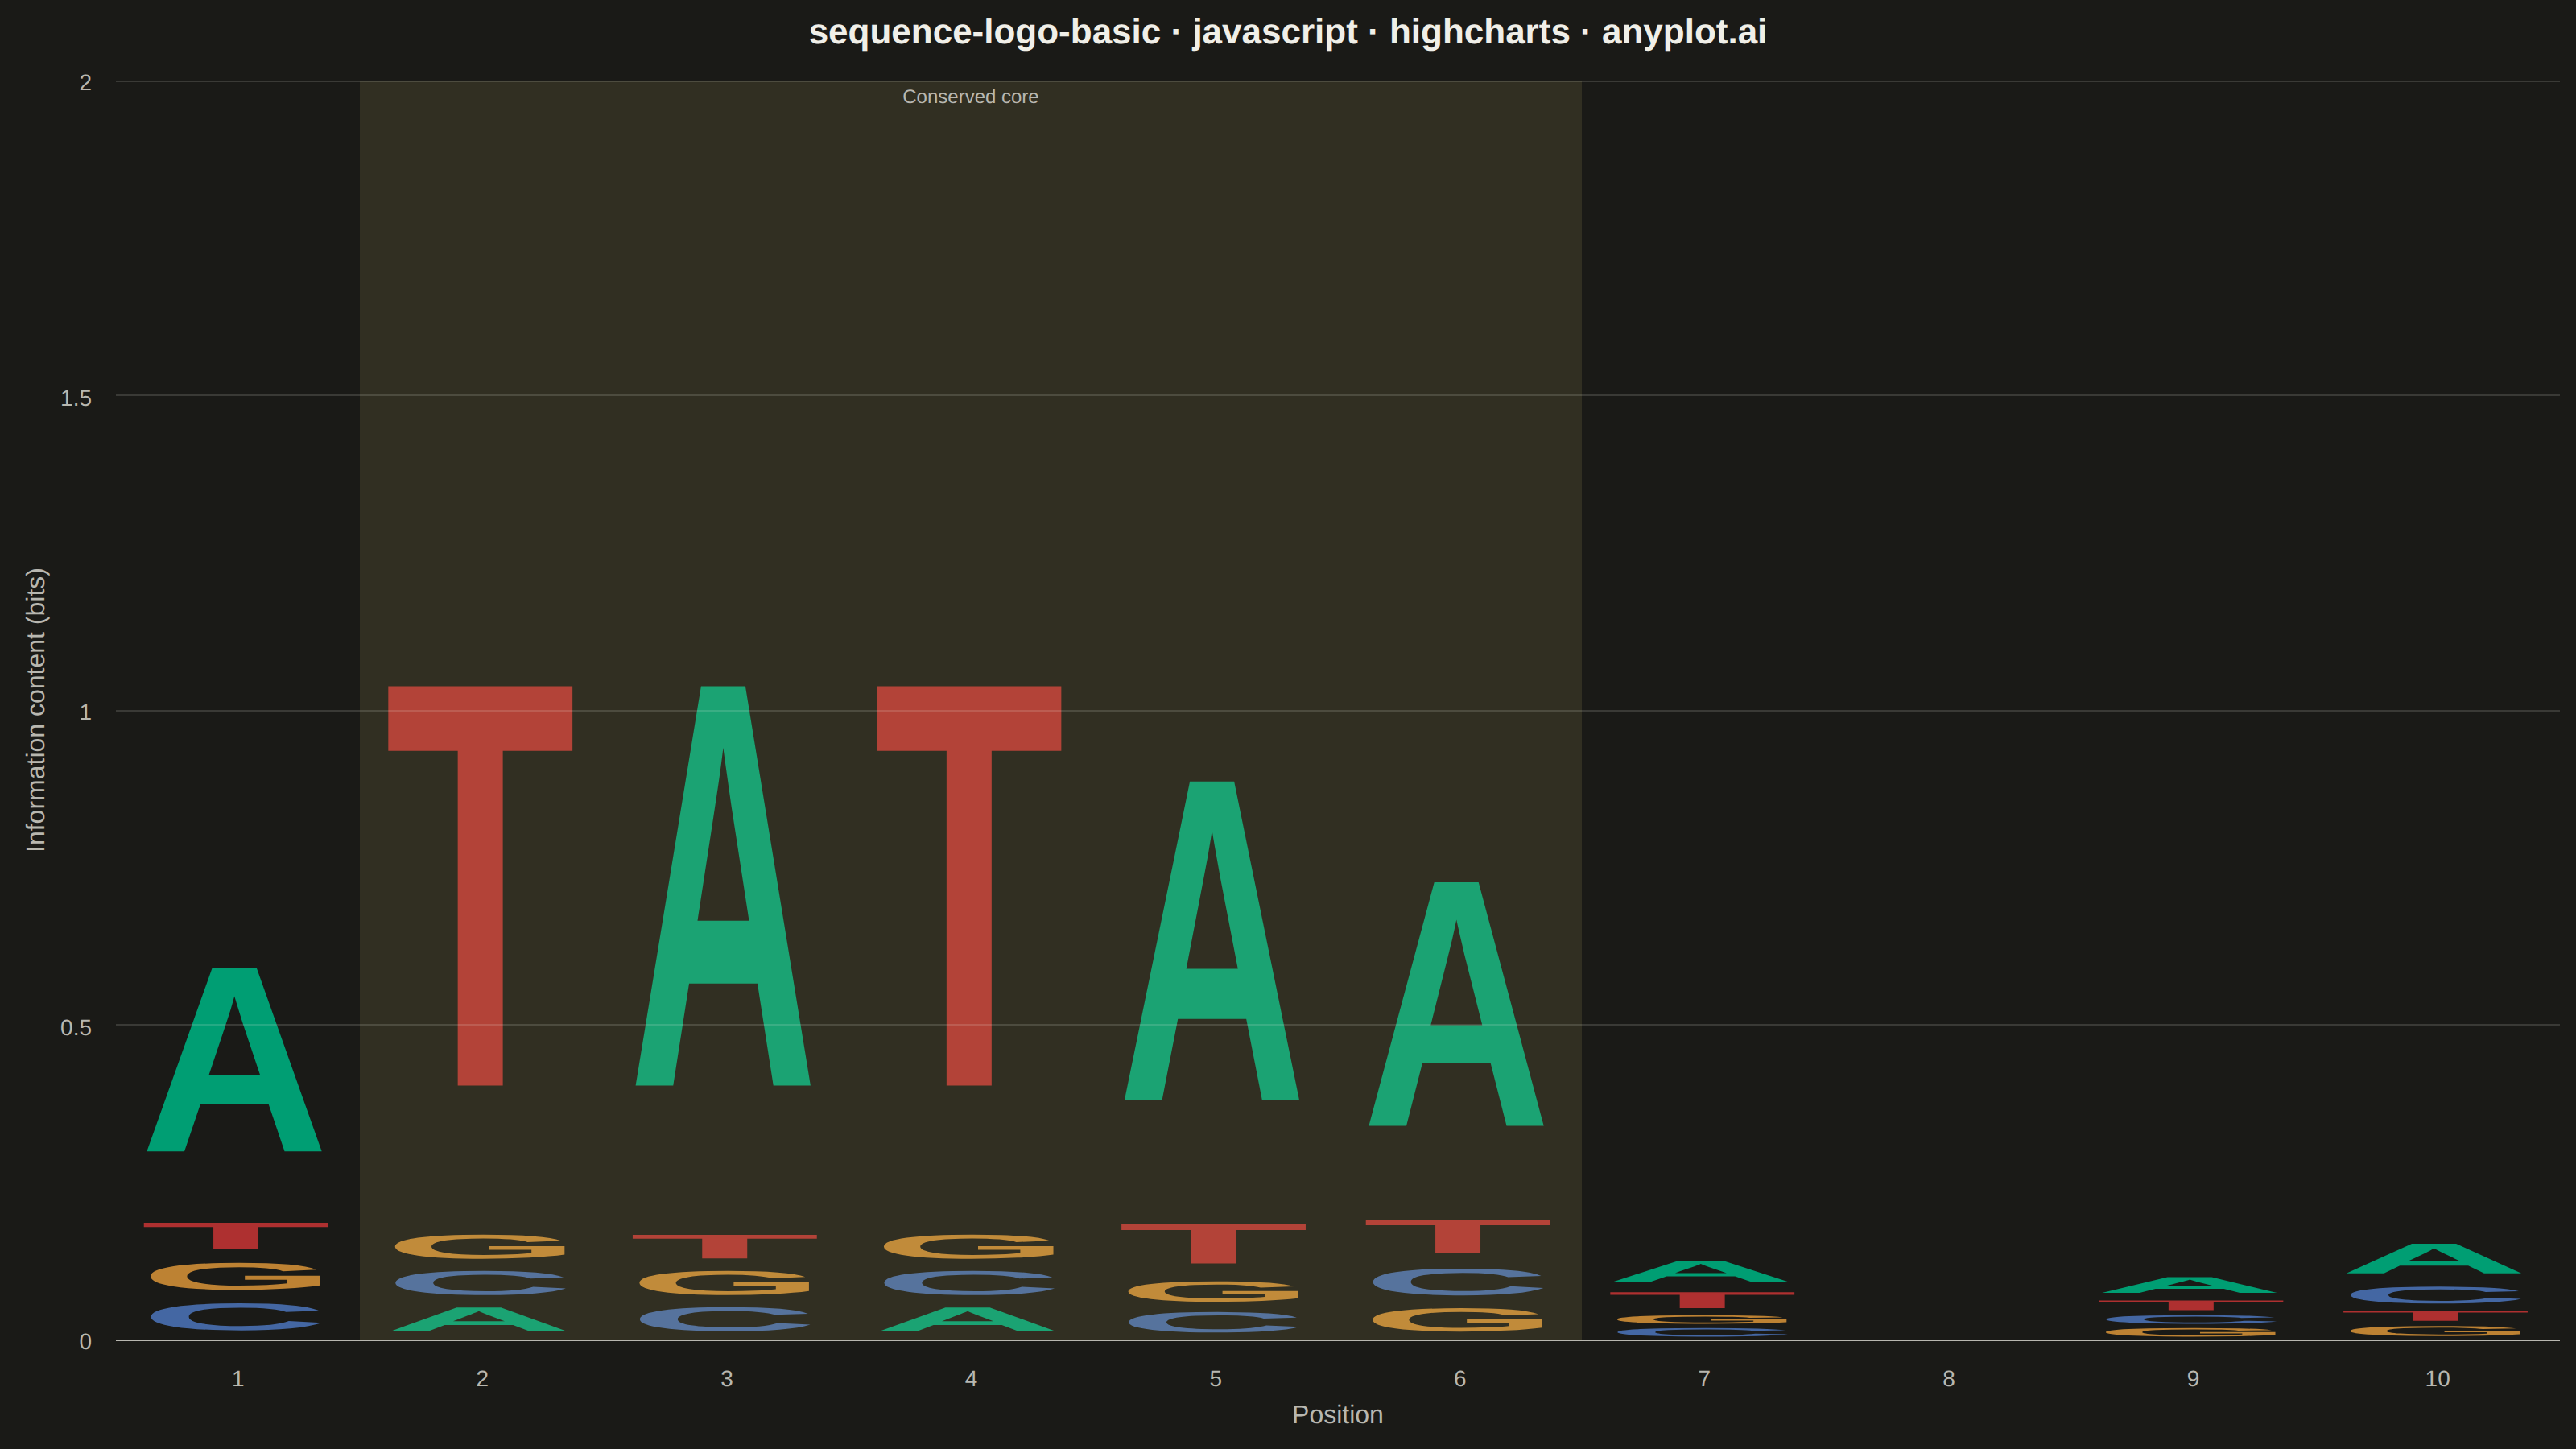
A sequence logo visualizes the consensus of multiple aligned DNA, RNA, or protein sequences. At each position, letters are stacked vertically with height proportional to information content (measured in bits), and individual letter heights within the stack reflect their relative frequency. This is the standard visualization for identifying conserved positions in transcription factor binding sites, splice sites, and protein domains.
// anyplot.ai
// sequence-logo-basic: Sequence Logo for Motif Visualization
// Library: highcharts 12.6.0 | JavaScript 22.23.2
// Quality: 90/100 | Created: 2026-08-26

const t = window.ANYPLOT_TOKENS;

// --- Data (in-memory, deterministic) ----------------------------------------
// A 10-position DNA transcription-factor binding motif (TATA-box-like core),
// highly conserved at positions 2-6, more variable at the flanks, and a
// zero-information (perfectly flat) position 8 to show a position with no
// informative letters — the standard behaviour of a real sequence logo.
const letters = ["A", "C", "G", "T"];
const freqMatrix = [
  [0.7, 0.1, 0.1, 0.1],
  [0.05, 0.05, 0.05, 0.85],
  [0.85, 0.05, 0.05, 0.05],
  [0.05, 0.05, 0.05, 0.85],
  [0.8, 0.05, 0.05, 0.1],
  [0.75, 0.08, 0.07, 0.1],
  [0.4, 0.15, 0.15, 0.3],
  [0.25, 0.25, 0.25, 0.25],
  [0.4, 0.2, 0.15, 0.25],
  [0.45, 0.25, 0.15, 0.15],
];
const positions = freqMatrix.map((_, i) => String(i + 1));
const MAX_BITS = 2; // log2(4) — the DNA information-content ceiling

// Shannon information content per position, then each letter's stack height
// (frequency * information content), sorted ascending so the most frequent
// letter lands on top of the stack.
const stacks = freqMatrix.map((freqs) => {
  const entropy = freqs.reduce((sum, p) => (p > 0 ? sum - p * Math.log2(p) : sum), 0);
  const infoContent = Math.max(0, MAX_BITS - entropy);
  return letters
    .map((letter, i) => ({ letter, height: freqs[i] * infoContent }))
    .sort((a, b) => a.height - b.height);
});

// Standard DNA color convention (A green / C blue / G orange / T red),
// mapped onto the closest Imprint categorical hues (semantic exception).
const LETTER_COLOR = {
  A: t.palette[0], // brand green
  C: t.palette[2], // blue
  G: t.palette[3], // ochre (orange)
  T: t.palette[4], // matte red
};

// --- Chart -------------------------------------------------------------------
// No data series is used for the visible marks — the axes only establish the
// position/bits coordinate system. Each letter is drawn as an SVG glyph via
// the core Highcharts renderer, scaled with translateX/Y + scaleX/Y so it
// exactly fills its allocated position/height box (per spec: "letters
// rendered as scaled glyphs, stretched to fill their allocated height").
let glyphs = [];

// Very-low-information letters (e.g. minor bases at positions 9-10) would
// otherwise scale down to a near-invisible sliver. Give every drawn letter a
// minimum on-screen height, converted from px into bits via the y-axis
// scale, so it still reads as a distinct glyph. The floor is applied to the
// stacking cursor too (not just the render box), so heights stay additive
// and no glyph overlaps its neighbor.
const MIN_GLYPH_PX = 8;

function drawLetters(chart) {
  glyphs.forEach((el) => el.destroy());
  glyphs = [];

  const xAxis = chart.xAxis[0];
  const yAxis = chart.yAxis[0];
  const bandWidth = xAxis.toPixels(1) - xAxis.toPixels(0);
  const letterWidth = bandWidth * 0.8;
  const pxPerBit = yAxis.toPixels(0) - yAxis.toPixels(1);
  const minBits = MIN_GLYPH_PX / pxPerBit;

  stacks.forEach((stack, i) => {
    const xCenter = xAxis.toPixels(i);
    const boxLeft = xCenter - letterWidth / 2;
    let bottomBits = 0;

    stack.forEach(({ letter, height }) => {
      if (height > 0.01) {
        const renderHeight = Math.max(height, minBits);
        const topBits = bottomBits + renderHeight;
        const yTop = yAxis.toPixels(topBits);
        const yBottom = yAxis.toPixels(bottomBits);
        const boxHeight = yBottom - yTop;

        const glyph = chart.renderer
          .text(letter, 0, 0)
          .attr({ x: 0, y: 0, fill: LETTER_COLOR[letter] })
          .css({ fontFamily: "Arial, Helvetica, sans-serif", fontWeight: "700" })
          .add();

        const bbox = glyph.getBBox(true);
        const scaleX = letterWidth / bbox.width;
        const scaleY = boxHeight / bbox.height;
        glyph.attr({
          translateX: boxLeft - scaleX * bbox.x,
          translateY: yTop - scaleY * bbox.y,
          scaleX,
          scaleY,
        });
        glyphs.push(glyph);
        bottomBits += renderHeight;
      } else {
        bottomBits += height;
      }
    });
  });
}

Highcharts.chart("container", {
  chart: {
    backgroundColor: "transparent",
    animation: false,
    style: { fontFamily: "inherit" },
    events: { render() { drawLetters(this); } },
  },
  credits: { enabled: false },
  title: {
    text: "sequence-logo-basic · javascript · highcharts · anyplot.ai",
    style: { color: t.ink, fontSize: "22px", fontWeight: "600" },
  },
  xAxis: {
    categories: positions,
    min: 0,
    max: positions.length - 1,
    lineColor: t.inkSoft,
    tickColor: t.inkSoft,
    labels: { style: { color: t.inkSoft, fontSize: "14px" } },
    title: { text: "Position", style: { color: t.inkSoft, fontSize: "16px" } },
    // Subtle band calling out the highly-conserved TATA-box-like core
    // (positions 2-6) so the motif's story reads at a glance, without
    // competing with the letter glyphs drawn on top.
    plotBands: [
      {
        from: 0.5,
        to: 5.5,
        color: `${t.amber}1f`,
        label: {
          text: "Conserved core",
          align: "center",
          verticalAlign: "top",
          y: 14,
          style: { color: t.inkSoft, fontSize: "12px" },
        },
      },
    ],
  },
  yAxis: {
    min: 0,
    max: MAX_BITS,
    tickInterval: 0.5,
    gridLineColor: t.grid,
    labels: { style: { color: t.inkSoft, fontSize: "14px" } },
    title: { text: "Information content (bits)", style: { color: t.inkSoft, fontSize: "16px" } },
  },
  legend: { enabled: false },
  plotOptions: { series: { animation: false } },
  // Invisible series: gives Highcharts real data extremes so it reserves
  // proper margins for the axis titles/labels (letters are drawn separately).
  series: [
    {
      type: "scatter",
      data: positions.map((_, i) => [i, 0]),
      marker: { enabled: false },
      lineWidth: 0,
      enableMouseTracking: false,
      showInLegend: false,
    },
  ],
});
Runnable source as JSON, for any HTTP client: https://api.anyplot.ai/specs/sequence-logo-basic/highcharts/code. Any spec id and library id listed in llms-full.txt fit the same URL shape; every URL below is complete and callable.
{
  "spec_id": "sequence-logo-basic",
  "language": "javascript",
  "library": "highcharts",
  "page": "https://anyplot.ai/sequence-logo-basic/javascript/highcharts",
  "hub": "https://anyplot.ai/sequence-logo-basic",
  "code_json": "https://api.anyplot.ai/specs/sequence-logo-basic/highcharts/code",
  "spec_json": "https://api.anyplot.ai/specs/sequence-logo-basic",
  "render_light_png": "https://storage.googleapis.com/anyplot-images/plots/sequence-logo-basic/javascript/highcharts/plot-light.png",
  "render_dark_png": "https://storage.googleapis.com/anyplot-images/plots/sequence-logo-basic/javascript/highcharts/plot-dark.png",
  "interactive_light_html": "https://storage.googleapis.com/anyplot-images/plots/sequence-logo-basic/javascript/highcharts/plot-light.html",
  "interactive_dark_html": "https://storage.googleapis.com/anyplot-images/plots/sequence-logo-basic/javascript/highcharts/plot-dark.html",
  "quality_score": 90.0,
  "license": "MIT",
  "guide": "https://anyplot.ai/llms.txt"
}
Part of Sequence Logo for Motif Visualization on anyplot.ai.