The same plot in 14 other libraries — JavaScript: Chart.js, Apache ECharts, Highcharts, MUI X Charts; Python: Altair, Bokeh, lets-plot, Matplotlib, Plotly, plotnine, Pygal, Seaborn; R: ggplot2; Julia: Makie.jl. Compare all 15 side by side: Sequence Logo for Motif Visualization in Python, R, Julia and JavaScript.
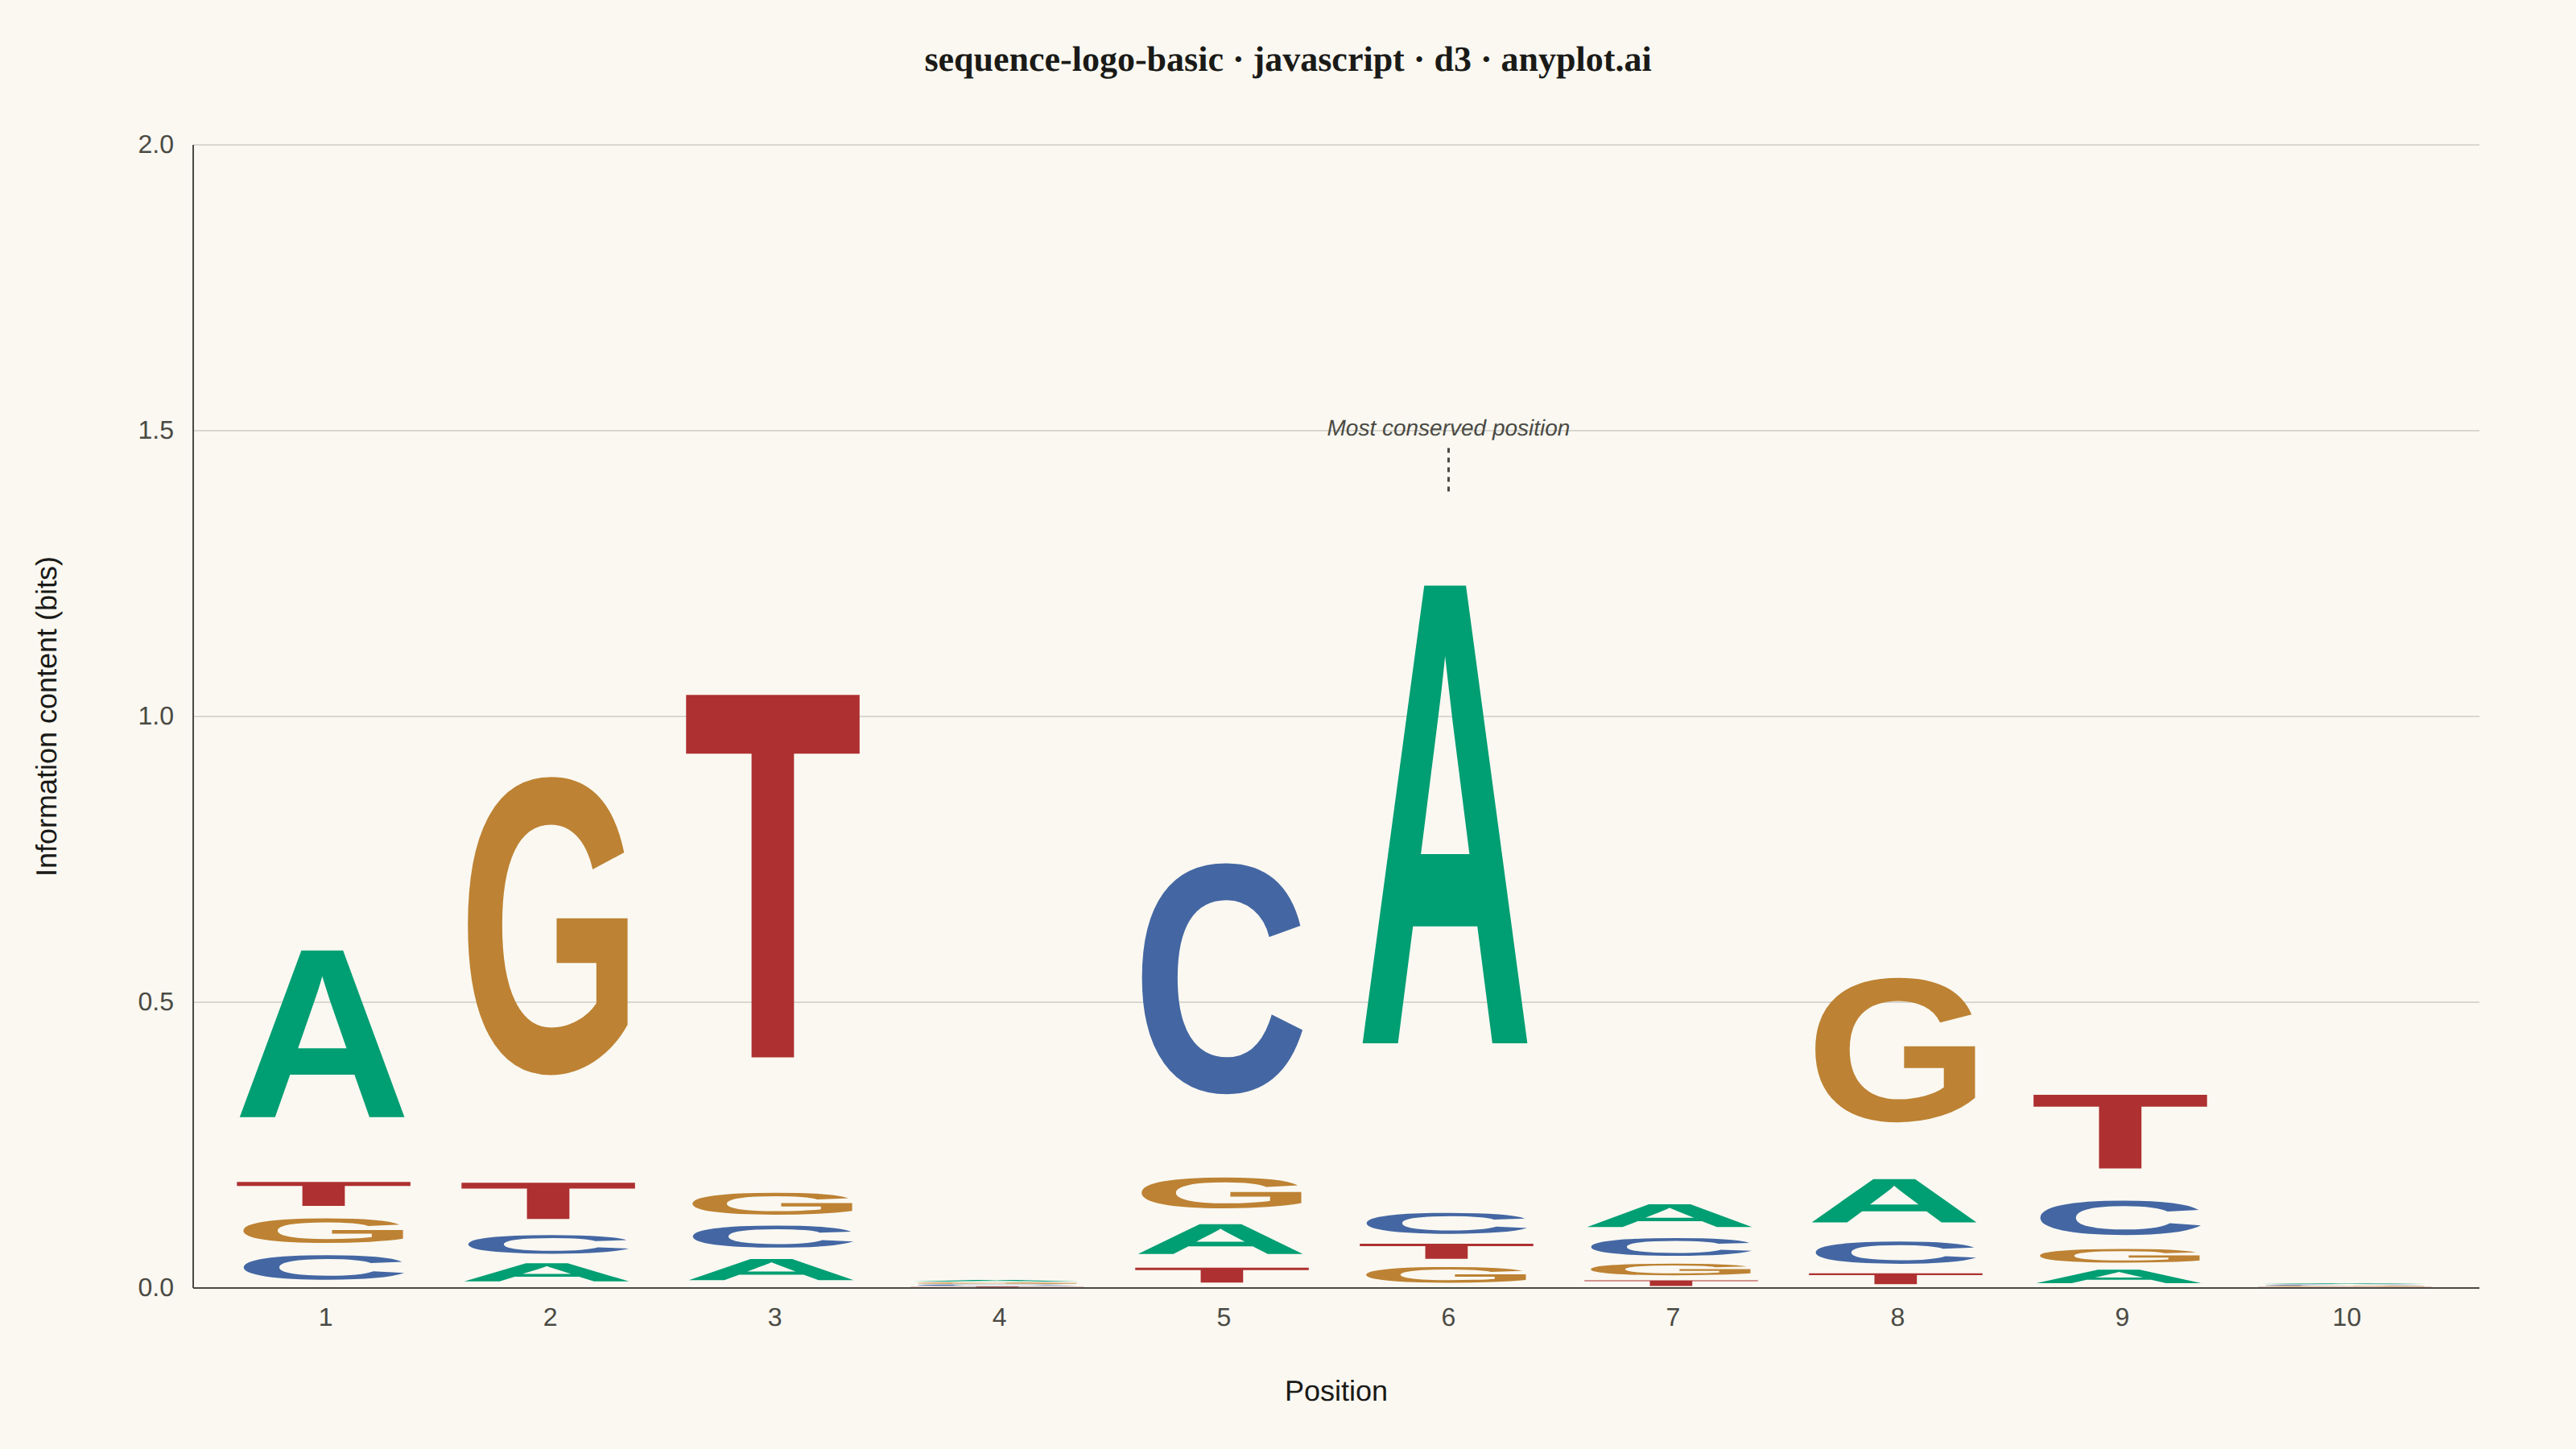
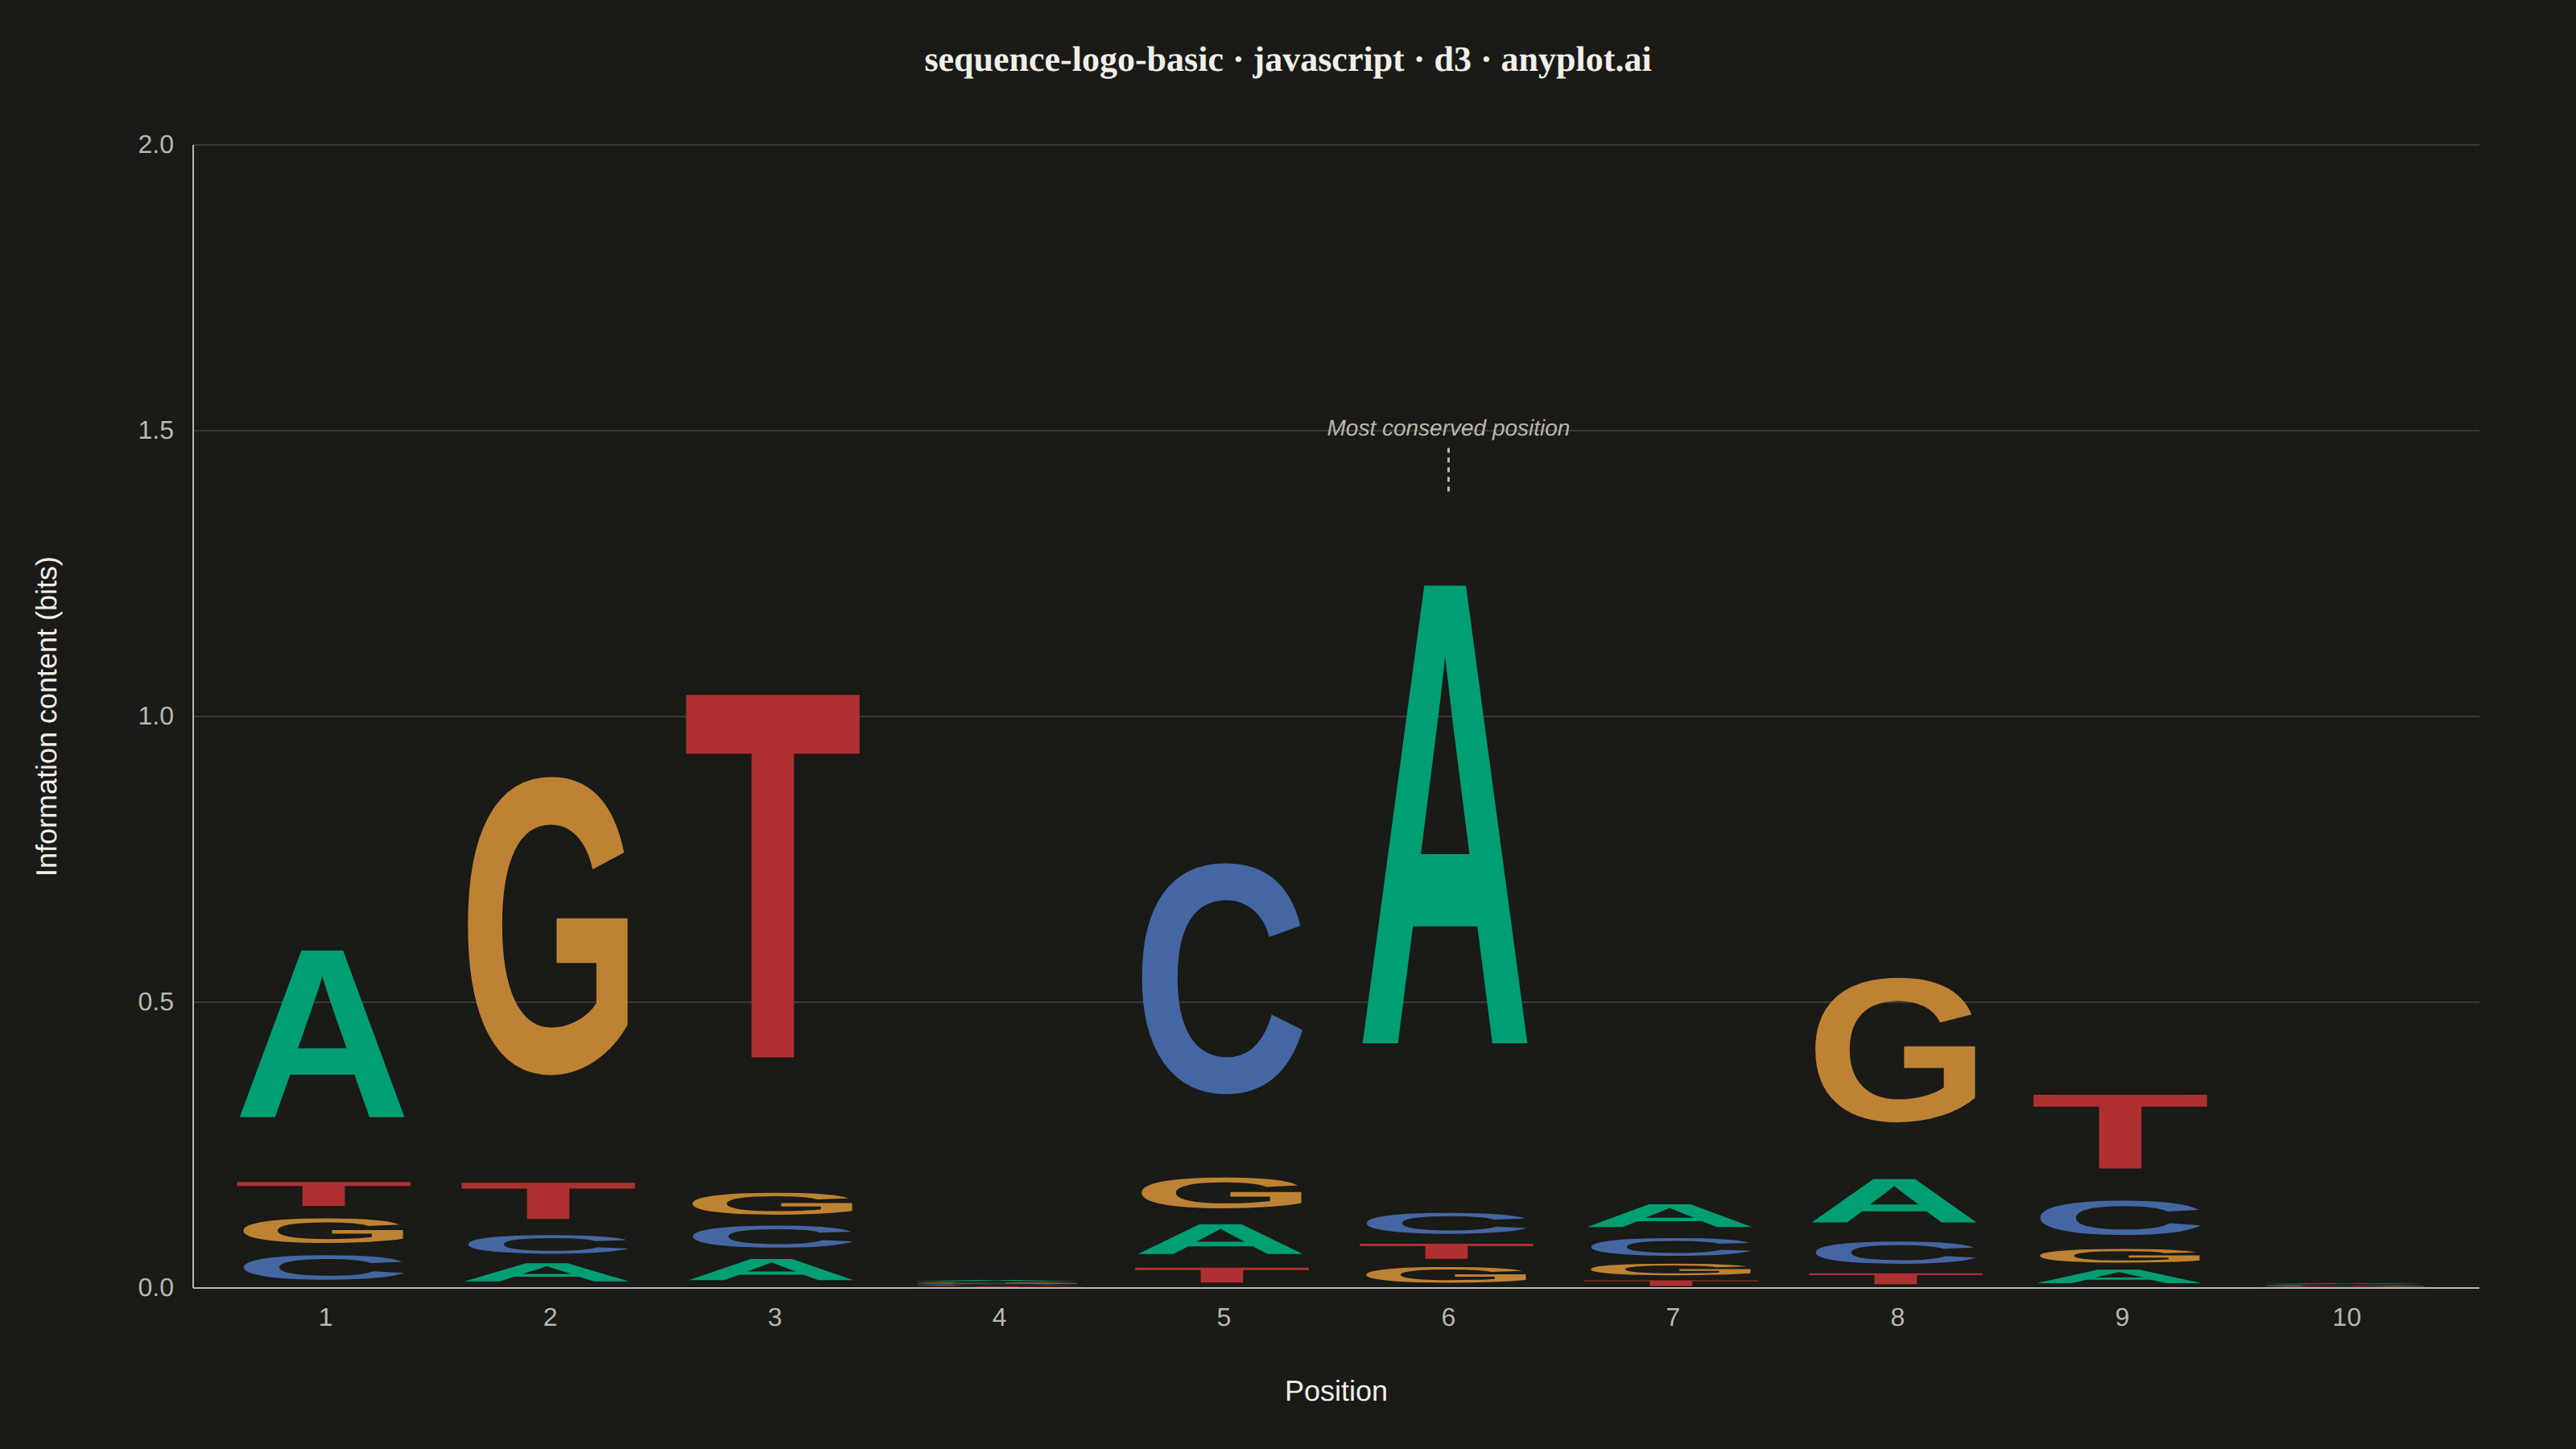
A sequence logo visualizes the consensus of multiple aligned DNA, RNA, or protein sequences. At each position, letters are stacked vertically with height proportional to information content (measured in bits), and individual letter heights within the stack reflect their relative frequency. This is the standard visualization for identifying conserved positions in transcription factor binding sites, splice sites, and protein domains.
// anyplot.ai
// sequence-logo-basic: Sequence Logo for Motif Visualization
// Library: d3 7.9.0 | JavaScript 22.23.2
// Quality: 92/100 | Created: 2026-08-26
//# anyplot-orientation: landscape

const t = window.ANYPLOT_TOKENS;
const { width, height } = window.ANYPLOT_SIZE;
const margin = { top: 90, right: 60, bottom: 100, left: 120 };
const iw = width - margin.left - margin.right;
const ih = height - margin.top - margin.bottom;

// --- Data: relative letter frequencies at each aligned position of a
// synthetic transcription-factor binding-site motif (10 positions, DNA) -----
const motif = [
  { position: 1, freqs: { A: 0.7, C: 0.1, G: 0.1, T: 0.1 } },
  { position: 2, freqs: { A: 0.05, C: 0.05, G: 0.8, T: 0.1 } },
  { position: 3, freqs: { A: 0.05, C: 0.05, G: 0.05, T: 0.85 } },
  { position: 4, freqs: { A: 0.3, C: 0.25, G: 0.25, T: 0.2 } },
  { position: 5, freqs: { A: 0.1, C: 0.75, G: 0.1, T: 0.05 } },
  { position: 6, freqs: { A: 0.9, C: 0.04, G: 0.03, T: 0.03 } },
  { position: 7, freqs: { A: 0.4, C: 0.3, G: 0.2, T: 0.1 } },
  { position: 8, freqs: { A: 0.2, C: 0.1, G: 0.65, T: 0.05 } },
  { position: 9, freqs: { A: 0.1, C: 0.25, G: 0.1, T: 0.55 } },
  { position: 10, freqs: { A: 0.28, C: 0.27, G: 0.24, T: 0.21 } },
];

// Shannon-entropy information content: DNA alphabet ceiling is log2(4) = 2 bits.
const MAX_BITS = 2;
const infoContent = (freqs) => {
  const entropy = Object.values(freqs).reduce((sum, p) => (p > 0 ? sum - p * Math.log2(p) : sum), 0);
  return MAX_BITS - entropy;
};

const stacks = motif.map((d) => {
  const infoBits = infoContent(d.freqs);
  const letters = Object.entries(d.freqs)
    .sort((a, b) => a[1] - b[1]) // ascending: least-frequent letter drawn first (bottom), most-frequent lands on top
    .map(([letter, freq]) => ({ letter, height: freq * infoBits }));
  return { position: d.position, infoBits, letters };
});

// Most-conserved position (highest information content) — storytelling focal point.
const peak = stacks.reduce((max, s) => (s.infoBits > max.infoBits ? s : max));

// Standard nucleotide color convention (A green / C blue / G ochre / T red),
// mapped onto the closest Imprint hues — a domain-convention semantic exception.
const LETTER_COLOR = { A: t.palette[0], C: t.palette[2], G: t.palette[3], T: t.palette[4] };

// Distinctive typeface pairing: serif display face for the title, workhorse
// sans-serif for chrome/glyphs.
const TITLE_FONT = "Georgia, 'Times New Roman', serif";
const CHROME_FONT = "-apple-system, 'Segoe UI', Helvetica, Arial, sans-serif";

// --- Scales ------------------------------------------------------------
const x = d3
  .scaleBand()
  .domain(motif.map((d) => d.position))
  .range([0, iw])
  .padding(0.18);
const y = d3.scaleLinear().domain([0, MAX_BITS]).range([ih, 0]);

// --- SVG mount -----------------------------------------------------------
const svg = d3.select("#container").append("svg").attr("width", width).attr("height", height);
const g = svg.append("g").attr("transform", `translate(${margin.left},${margin.top})`);

// Subtle y-axis gridlines only (bar-like stacked chart)
g.append("g")
  .selectAll("line")
  .data(y.ticks(4))
  .join("line")
  .attr("x1", 0)
  .attr("x2", iw)
  .attr("y1", (d) => y(d))
  .attr("y2", (d) => y(d))
  .attr("stroke", t.grid)
  .attr("stroke-width", 1);

// --- Letter stacks: glyphs stretched to fill their allocated cell ----------
const colWidth = x.bandwidth();
for (const stack of stacks) {
  let cumulative = 0;
  const colX = x(stack.position);
  for (const item of stack.letters) {
    const yTop = y(cumulative + item.height);
    const yBottom = y(cumulative);
    const pixelHeight = yBottom - yTop;
    cumulative += item.height;
    if (pixelHeight <= 0) continue;

    const glyph = g
      .append("text")
      .attr("x", 0)
      .attr("y", 0)
      .style("font-family", CHROME_FONT)
      .style("font-weight", "900")
      .style("fill", LETTER_COLOR[item.letter])
      .text(item.letter);

    const bbox = glyph.node().getBBox();
    const scaleX = colWidth / bbox.width;
    const scaleY = pixelHeight / bbox.height;
    const tx = colX - bbox.x * scaleX;
    const ty = yTop - bbox.y * scaleY;
    glyph.attr("transform", `translate(${tx},${ty}) scale(${scaleX},${scaleY})`);
  }
}

// --- Axes ------------------------------------------------------------------
const xAxis = g
  .append("g")
  .attr("transform", `translate(0,${ih})`)
  .call(d3.axisBottom(x).tickSize(0).tickPadding(12));
xAxis.selectAll("text").attr("fill", t.inkSoft).style("font-family", CHROME_FONT).style("font-size", "16px");
xAxis.select(".domain").attr("stroke", t.inkSoft);

const yAxis = g.append("g").call(d3.axisLeft(y).ticks(4).tickSize(0).tickPadding(12));
yAxis.selectAll("text").attr("fill", t.inkSoft).style("font-family", CHROME_FONT).style("font-size", "16px");
yAxis.select(".domain").attr("stroke", t.inkSoft);

// --- Axis labels -------------------------------------------------------
g.append("text")
  .attr("x", iw / 2)
  .attr("y", ih + 70)
  .attr("text-anchor", "middle")
  .attr("fill", t.ink)
  .style("font-family", CHROME_FONT)
  .style("font-size", "18px")
  .text("Position");

g.append("text")
  .attr("transform", "rotate(-90)")
  .attr("x", -ih / 2)
  .attr("y", -85)
  .attr("text-anchor", "middle")
  .attr("fill", t.ink)
  .style("font-family", CHROME_FONT)
  .style("font-size", "18px")
  .text("Information content (bits)");

// --- Storytelling callout: flag the single most-conserved position ---------
const peakX = x(peak.position) + colWidth / 2;
const peakTopY = y(peak.infoBits);

g.append("line")
  .attr("x1", peakX)
  .attr("x2", peakX)
  .attr("y1", peakTopY - 34)
  .attr("y2", peakTopY - 6)
  .attr("stroke", t.inkSoft)
  .attr("stroke-width", 1.5)
  .attr("stroke-dasharray", "3,3");

g.append("text")
  .attr("x", peakX)
  .attr("y", peakTopY - 42)
  .attr("text-anchor", "middle")
  .attr("fill", t.inkSoft)
  .style("font-family", CHROME_FONT)
  .style("font-style", "italic")
  .style("font-size", "14px")
  .text("Most conserved position");

// --- Title ---------------------------------------------------------------
svg
  .append("text")
  .attr("x", width / 2)
  .attr("y", 44)
  .attr("text-anchor", "middle")
  .attr("fill", t.ink)
  .style("font-family", TITLE_FONT)
  .style("font-size", "22px")
  .style("font-weight", "700")
  .text("sequence-logo-basic · javascript · d3 · anyplot.ai");
Runnable source as JSON, for any HTTP client: https://api.anyplot.ai/specs/sequence-logo-basic/d3/code. Any spec id and library id listed in llms-full.txt fit the same URL shape; every URL below is complete and callable.
{
  "spec_id": "sequence-logo-basic",
  "language": "javascript",
  "library": "d3",
  "page": "https://anyplot.ai/sequence-logo-basic/javascript/d3",
  "hub": "https://anyplot.ai/sequence-logo-basic",
  "code_json": "https://api.anyplot.ai/specs/sequence-logo-basic/d3/code",
  "spec_json": "https://api.anyplot.ai/specs/sequence-logo-basic",
  "render_light_png": "https://storage.googleapis.com/anyplot-images/plots/sequence-logo-basic/javascript/d3/plot-light.png",
  "render_dark_png": "https://storage.googleapis.com/anyplot-images/plots/sequence-logo-basic/javascript/d3/plot-dark.png",
  "interactive_light_html": "https://storage.googleapis.com/anyplot-images/plots/sequence-logo-basic/javascript/d3/plot-light.html",
  "interactive_dark_html": "https://storage.googleapis.com/anyplot-images/plots/sequence-logo-basic/javascript/d3/plot-dark.html",
  "quality_score": 92.0,
  "license": "MIT",
  "guide": "https://anyplot.ai/llms.txt"
}
Part of Sequence Logo for Motif Visualization on anyplot.ai.