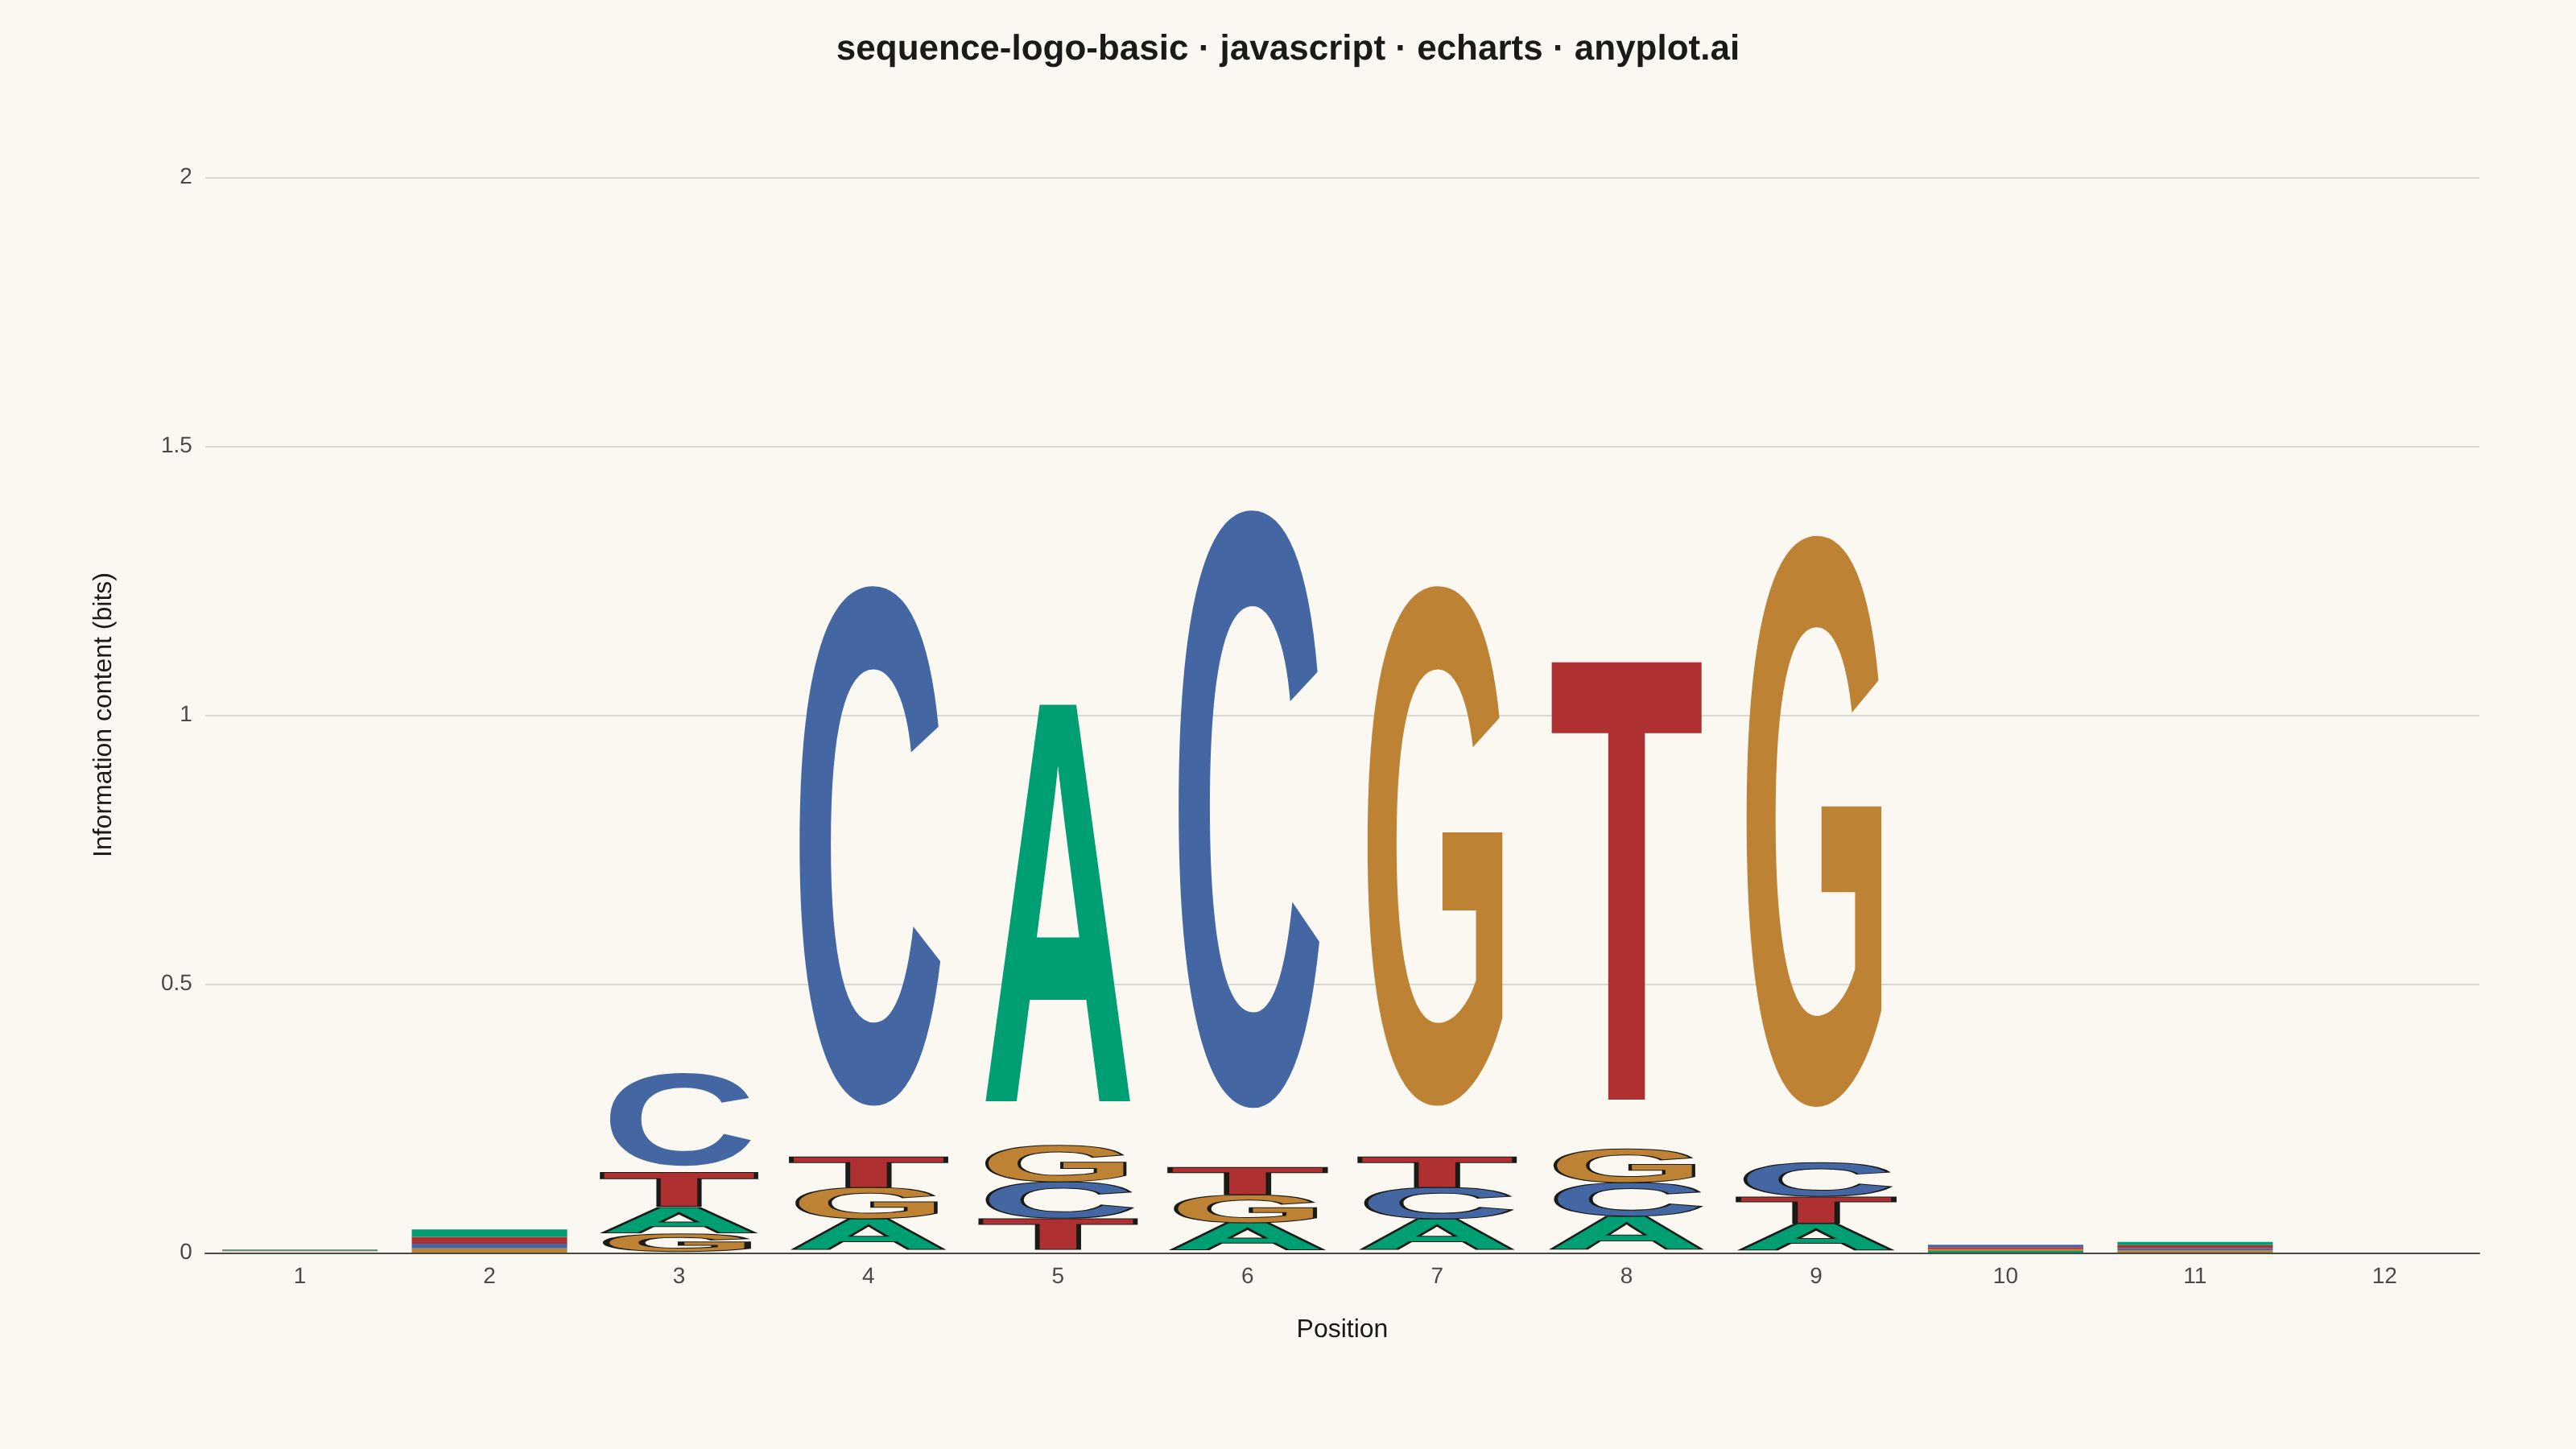
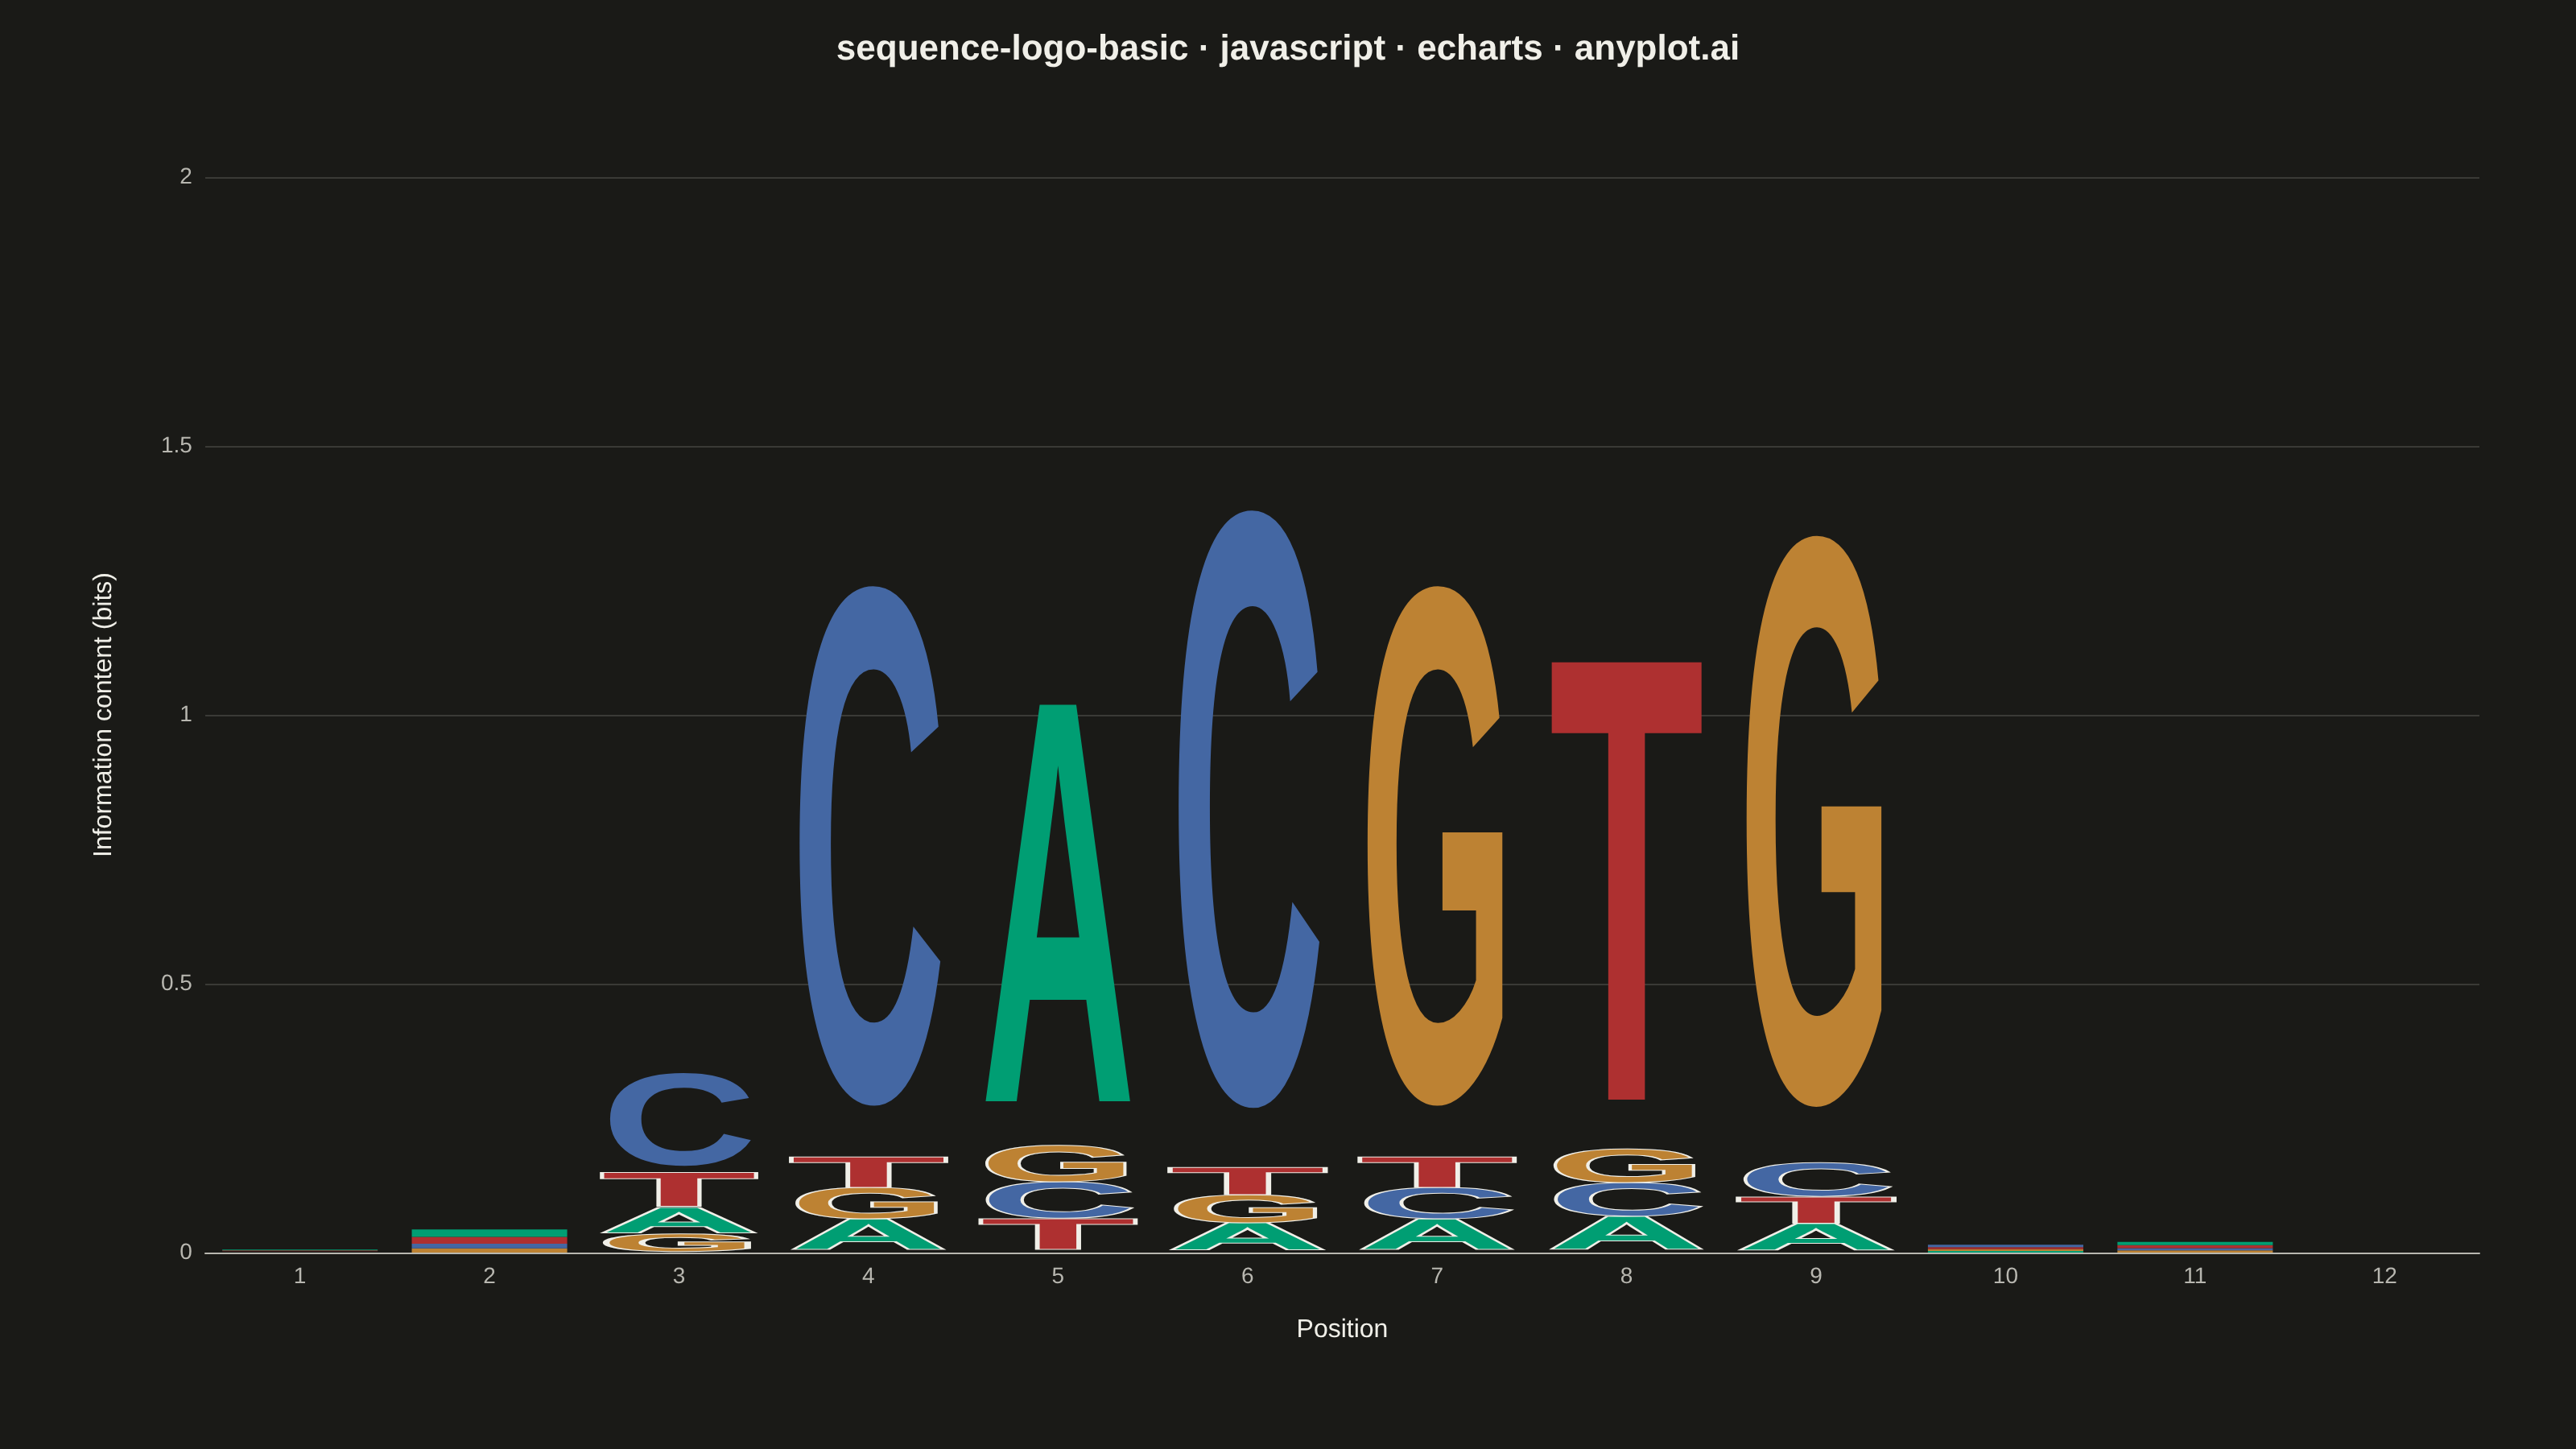
The same plot in 14 other libraries — JavaScript: Chart.js, D3.js, Highcharts, MUI X Charts; Python: Altair, Bokeh, lets-plot, Matplotlib, Plotly, plotnine, Pygal, Seaborn; R: ggplot2; Julia: Makie.jl. Compare all 15 side by side: Sequence Logo for Motif Visualization in Python, R, Julia and JavaScript.
A sequence logo visualizes the consensus of multiple aligned DNA, RNA, or protein sequences. At each position, letters are stacked vertically with height proportional to information content (measured in bits), and individual letter heights within the stack reflect their relative frequency. This is the standard visualization for identifying conserved positions in transcription factor binding sites, splice sites, and protein domains.
// anyplot.ai
// sequence-logo-basic: Sequence Logo for Motif Visualization
// Library: echarts 6.1.0 | JavaScript 22.23.2
// Quality: 94/100 | Created: 2026-08-26

const t = window.ANYPLOT_TOKENS;

// --- Data (in-memory, deterministic) ----------------------------------------
// 12-position DNA motif: degenerate flanks around a conserved CACGTG (E-box) core
const positions = [1, 2, 3, 4, 5, 6, 7, 8, 9, 10, 11, 12];
const motif = [
  { A: 0.28, C: 0.24, G: 0.22, T: 0.26 },
  { A: 0.32, C: 0.2, G: 0.18, T: 0.3 },
  { A: 0.15, C: 0.55, G: 0.1, T: 0.2 },
  { A: 0.05, C: 0.85, G: 0.05, T: 0.05 },
  { A: 0.8, C: 0.07, G: 0.07, T: 0.06 },
  { A: 0.04, C: 0.88, G: 0.04, T: 0.04 },
  { A: 0.05, C: 0.05, G: 0.85, T: 0.05 },
  { A: 0.06, C: 0.06, G: 0.06, T: 0.82 },
  { A: 0.04, C: 0.05, G: 0.87, T: 0.04 },
  { A: 0.2, C: 0.3, G: 0.25, T: 0.25 },
  { A: 0.3, C: 0.22, G: 0.2, T: 0.28 },
  { A: 0.27, C: 0.25, G: 0.23, T: 0.25 },
];
const MAX_BITS = 2; // DNA: log2(4 letters)

// DNA colors — semantic exception: standard A/C/G/T convention mapped onto Imprint
const LETTER_COLOR = {
  A: t.palette[0],
  C: t.palette[2],
  G: t.palette[3],
  T: t.palette[4],
};

// Approximate Helvetica/Arial-Bold uppercase glyph metrics (AFM widths, cap height)
// as a fraction of font size — used to stretch each glyph to fill its cell exactly.
const GLYPH_WIDTH_RATIO = { A: 0.722, C: 0.722, G: 0.778, T: 0.611 };
const CAP_HEIGHT_RATIO = 0.718;
const REFERENCE_FONT_SIZE = 100;

// Below this rendered height, four stacked glyphs smear into an illegible
// band — draw a thin color-coded sliver instead so the stack stays honest.
const MIN_LETTER_HEIGHT = 8;
// Below this, the letter is still drawn but gets an ink-color stroke: the
// muted ochre/matte-red hues fall under the WCAG contrast floor and need the
// extra edge right where the small scale already strains legibility.
const MIN_STROKE_HEIGHT = 24;

// Per position: Shannon-entropy information content (bits), letters stacked
// bottom-to-top in ascending frequency order (so the most frequent letter is on top).
const stackData = [];
positions.forEach((pos, posIdx) => {
  const freqs = motif[posIdx];
  const entropy = Object.values(freqs).reduce(
    (sum, f) => (f > 0 ? sum - f * Math.log2(f) : sum),
    0,
  );
  const infoContent = MAX_BITS - entropy;
  const orderedLetters = Object.keys(freqs).sort((a, b) => freqs[a] - freqs[b]);
  let cumulative = 0;
  orderedLetters.forEach((letter) => {
    const freq = freqs[letter];
    const height = infoContent * freq;
    const y0 = cumulative;
    const y1 = cumulative + height;
    cumulative = y1;
    stackData.push([posIdx, y0, y1, letter, freq]);
  });
});

// --- Custom render: stretch each letter glyph to fill its stack cell ------------
function renderItem(params, api) {
  const posIdx = api.value(0);
  const y0 = api.value(1);
  const y1 = api.value(2);
  const letter = api.value(3);

  const bottomLeft = api.coord([posIdx, y0]);
  const topLeft = api.coord([posIdx, y1]);
  const bandWidth = api.size([1, 0])[0];

  const targetHeight = bottomLeft[1] - topLeft[1];
  const targetWidth = bandWidth * 0.82;
  if (targetHeight < 0.5 || targetWidth < 1) {
    return { type: "text", style: { text: "" } };
  }

  const centerX = bottomLeft[0];
  const centerY = (bottomLeft[1] + topLeft[1]) / 2;

  // Near-zero-information positions: four glyphs this small would overlap
  // into a muddy smear, so show a plain color-coded sliver instead.
  if (targetHeight < MIN_LETTER_HEIGHT) {
    return {
      type: "rect",
      shape: {
        x: centerX - targetWidth / 2,
        y: topLeft[1],
        width: targetWidth,
        height: targetHeight,
      },
      style: { fill: LETTER_COLOR[letter] },
    };
  }

  const scaleX =
    targetWidth / (REFERENCE_FONT_SIZE * GLYPH_WIDTH_RATIO[letter]);
  const scaleY = targetHeight / (REFERENCE_FONT_SIZE * CAP_HEIGHT_RATIO);
  // Stroke width is drawn in the pre-transform coordinate space, so
  // compensate for the scaleY shrink to keep the rendered edge ~1px.
  const needsStroke = targetHeight < MIN_STROKE_HEIGHT;
  const strokeWidth = needsStroke ? 1 / scaleY : 0;

  return {
    type: "text",
    x: centerX,
    y: centerY,
    scaleX: scaleX,
    scaleY: scaleY,
    style: {
      text: letter,
      fontSize: REFERENCE_FONT_SIZE,
      fontWeight: "bold",
      fontFamily: "Arial, Helvetica, sans-serif",
      fill: LETTER_COLOR[letter],
      stroke: needsStroke ? t.ink : "none",
      lineWidth: strokeWidth,
      textAlign: "center",
      textVerticalAlign: "middle",
    },
  };
}

// --- Init ---------------------------------------------------------------------
const chart = echarts.init(document.getElementById("container"));

// --- Option ---------------------------------------------------------------------
chart.setOption({
  animation: false,
  backgroundColor: "transparent",
  title: {
    text: "sequence-logo-basic · javascript · echarts · anyplot.ai",
    left: "center",
    textStyle: { color: t.ink, fontSize: 22 },
  },
  tooltip: {
    trigger: "item",
    backgroundColor: t.elevatedBg,
    borderColor: t.grid,
    textStyle: { color: t.ink },
    formatter: (params) => {
      const [posIdx, , , letter, freq] = params.value;
      return `Position ${posIdx + 1}<br/>${letter}: ${Math.round(freq * 100)}%`;
    },
  },
  grid: { left: 100, right: 60, top: 110, bottom: 100, containLabel: true },
  xAxis: {
    type: "category",
    data: positions.map(String),
    name: "Position",
    nameLocation: "middle",
    nameGap: 40,
    nameTextStyle: { color: t.ink, fontSize: 16 },
    axisLabel: { color: t.inkSoft, fontSize: 14 },
    axisLine: { lineStyle: { color: t.inkSoft } },
    axisTick: { show: false },
    splitLine: { show: false },
  },
  yAxis: {
    type: "value",
    min: 0,
    max: MAX_BITS,
    name: "Information content (bits)",
    nameLocation: "middle",
    nameGap: 55,
    nameRotate: 90,
    nameTextStyle: { color: t.ink, fontSize: 16 },
    axisLabel: { color: t.inkSoft, fontSize: 14 },
    axisLine: { lineStyle: { color: t.inkSoft } },
    axisTick: { show: false },
    splitLine: { lineStyle: { color: t.grid } },
  },
  series: [
    {
      type: "custom",
      coordinateSystem: "cartesian2d",
      renderItem: renderItem,
      clip: true,
      data: stackData,
    },
  ],
});
Runnable source as JSON, for any HTTP client: https://api.anyplot.ai/specs/sequence-logo-basic/echarts/code. Any spec id and library id listed in llms-full.txt fit the same URL shape; every URL below is complete and callable.
{
  "spec_id": "sequence-logo-basic",
  "language": "javascript",
  "library": "echarts",
  "page": "https://anyplot.ai/sequence-logo-basic/javascript/echarts",
  "hub": "https://anyplot.ai/sequence-logo-basic",
  "code_json": "https://api.anyplot.ai/specs/sequence-logo-basic/echarts/code",
  "spec_json": "https://api.anyplot.ai/specs/sequence-logo-basic",
  "render_light_png": "https://storage.googleapis.com/anyplot-images/plots/sequence-logo-basic/javascript/echarts/plot-light.png",
  "render_dark_png": "https://storage.googleapis.com/anyplot-images/plots/sequence-logo-basic/javascript/echarts/plot-dark.png",
  "interactive_light_html": "https://storage.googleapis.com/anyplot-images/plots/sequence-logo-basic/javascript/echarts/plot-light.html",
  "interactive_dark_html": "https://storage.googleapis.com/anyplot-images/plots/sequence-logo-basic/javascript/echarts/plot-dark.html",
  "quality_score": 94.0,
  "license": "MIT",
  "guide": "https://anyplot.ai/llms.txt"
}
Part of Sequence Logo for Motif Visualization on anyplot.ai.