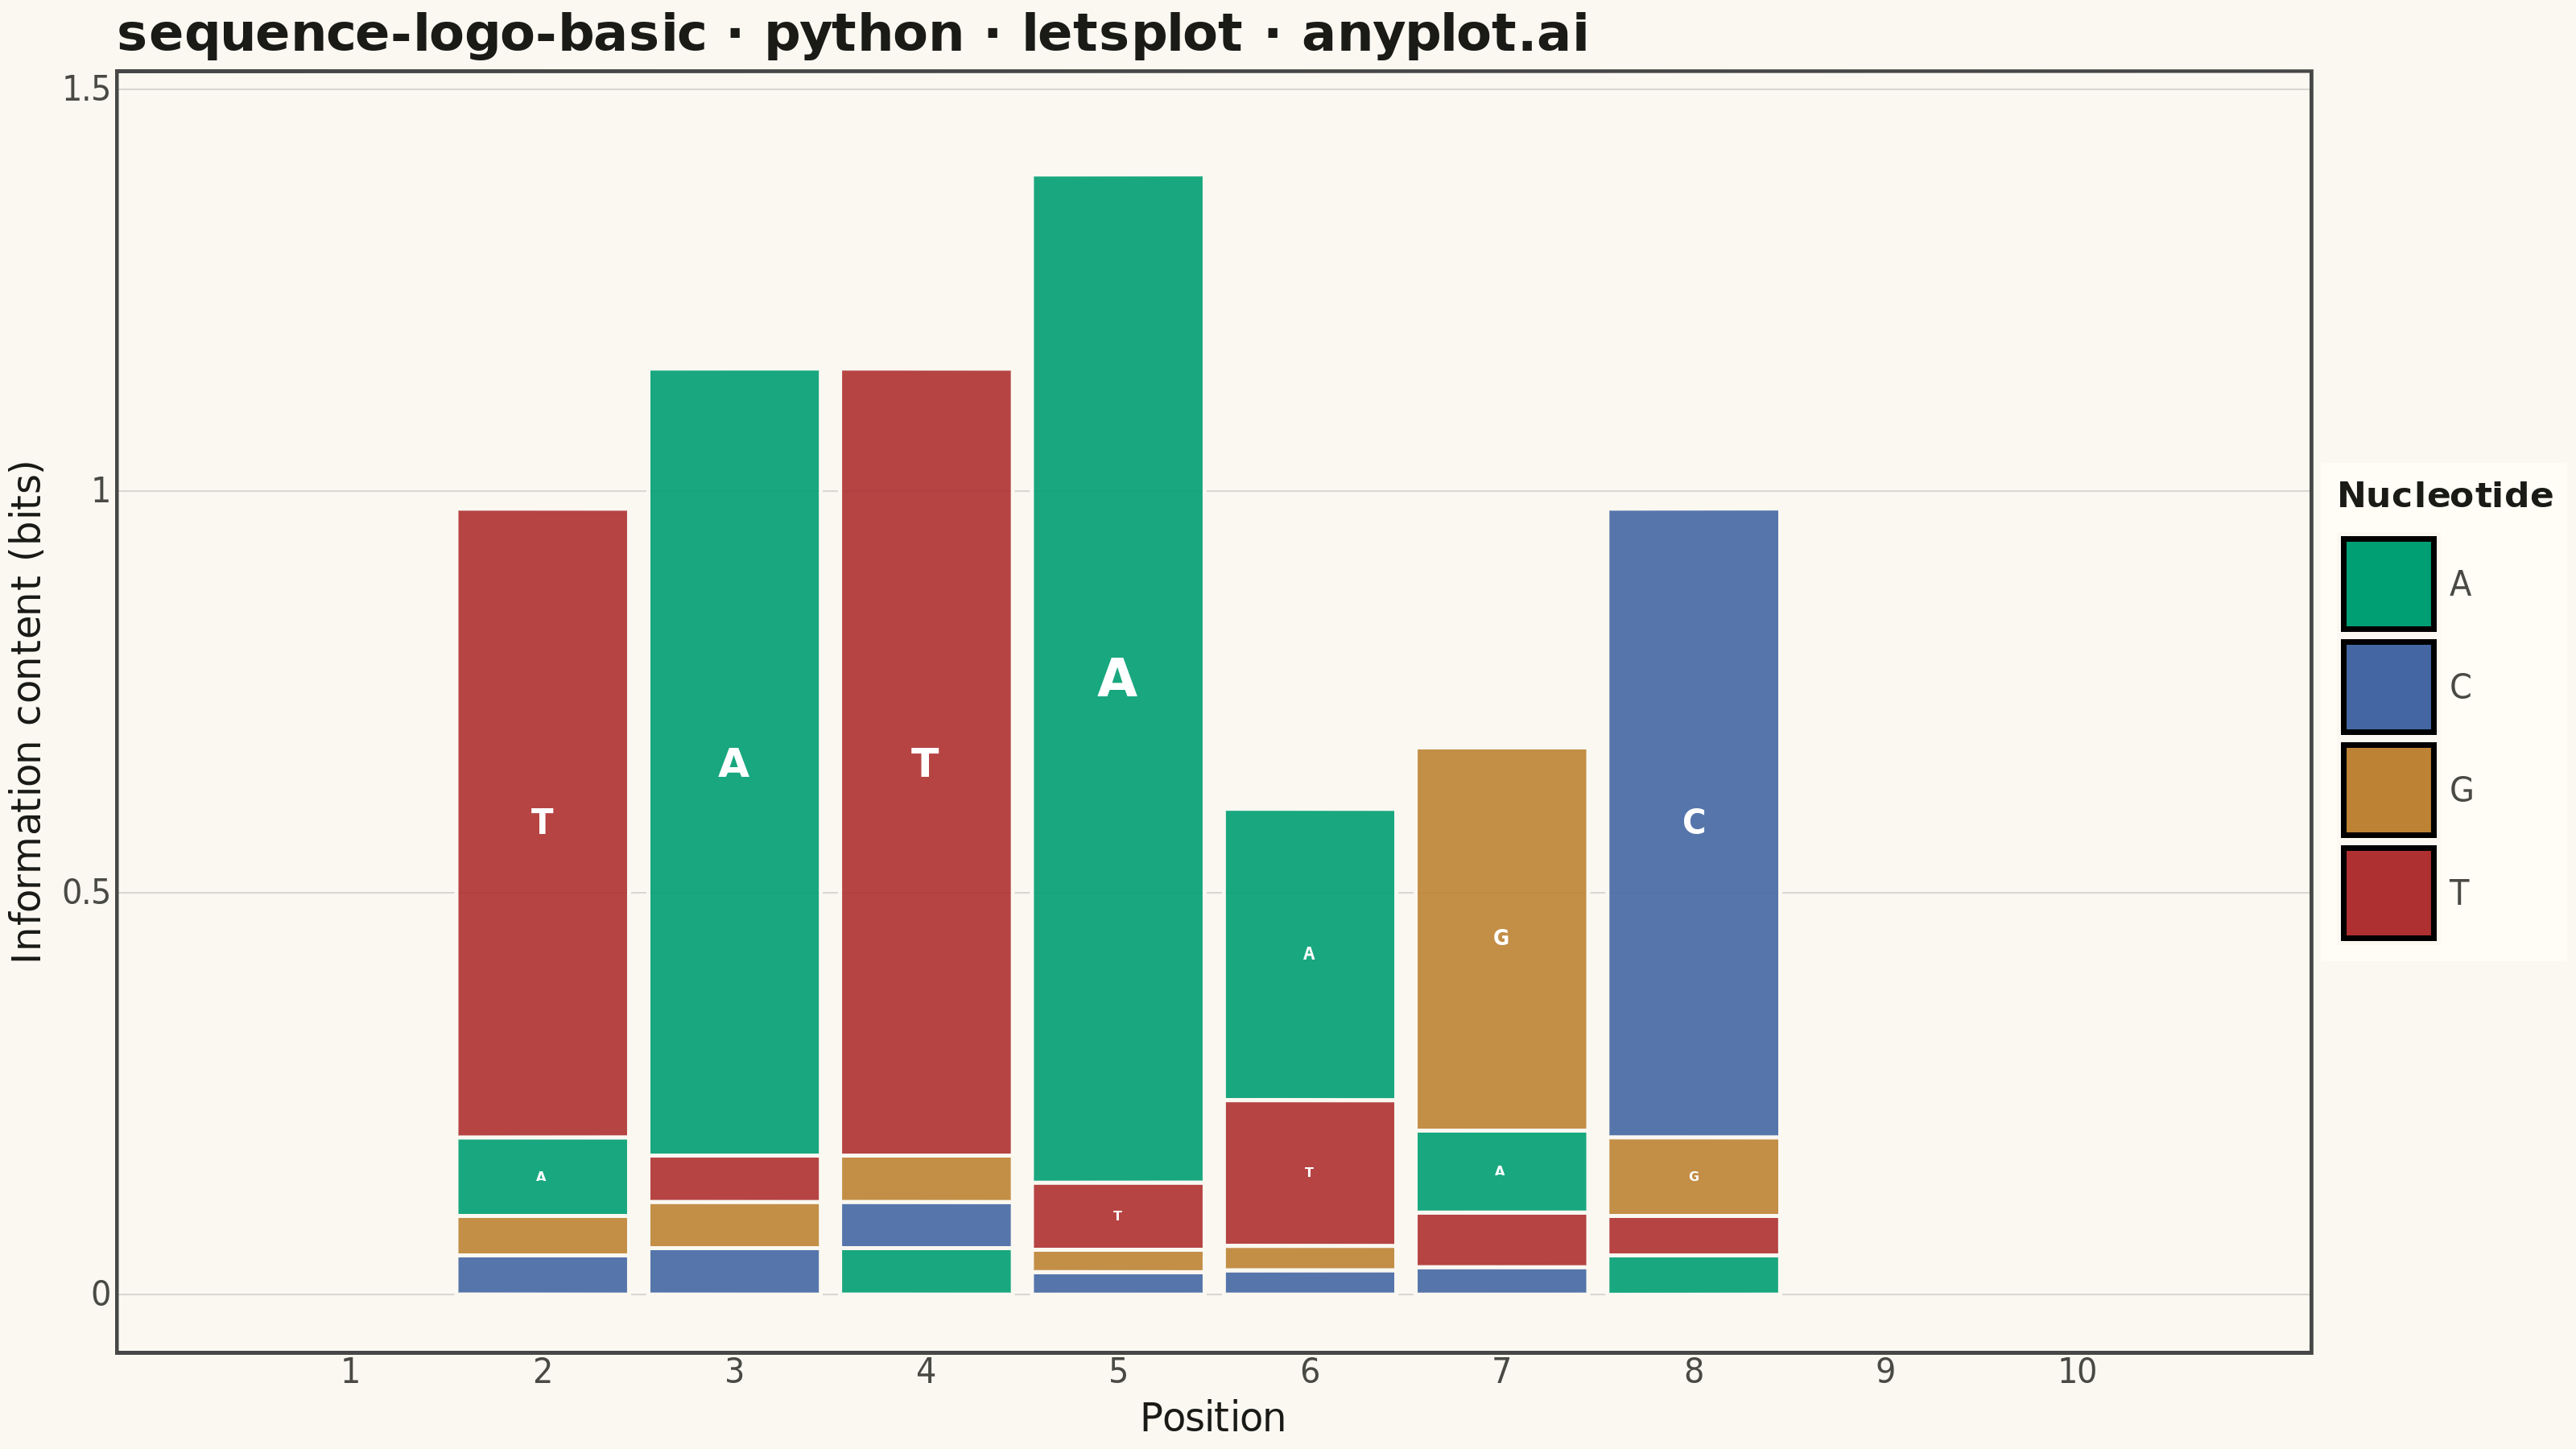
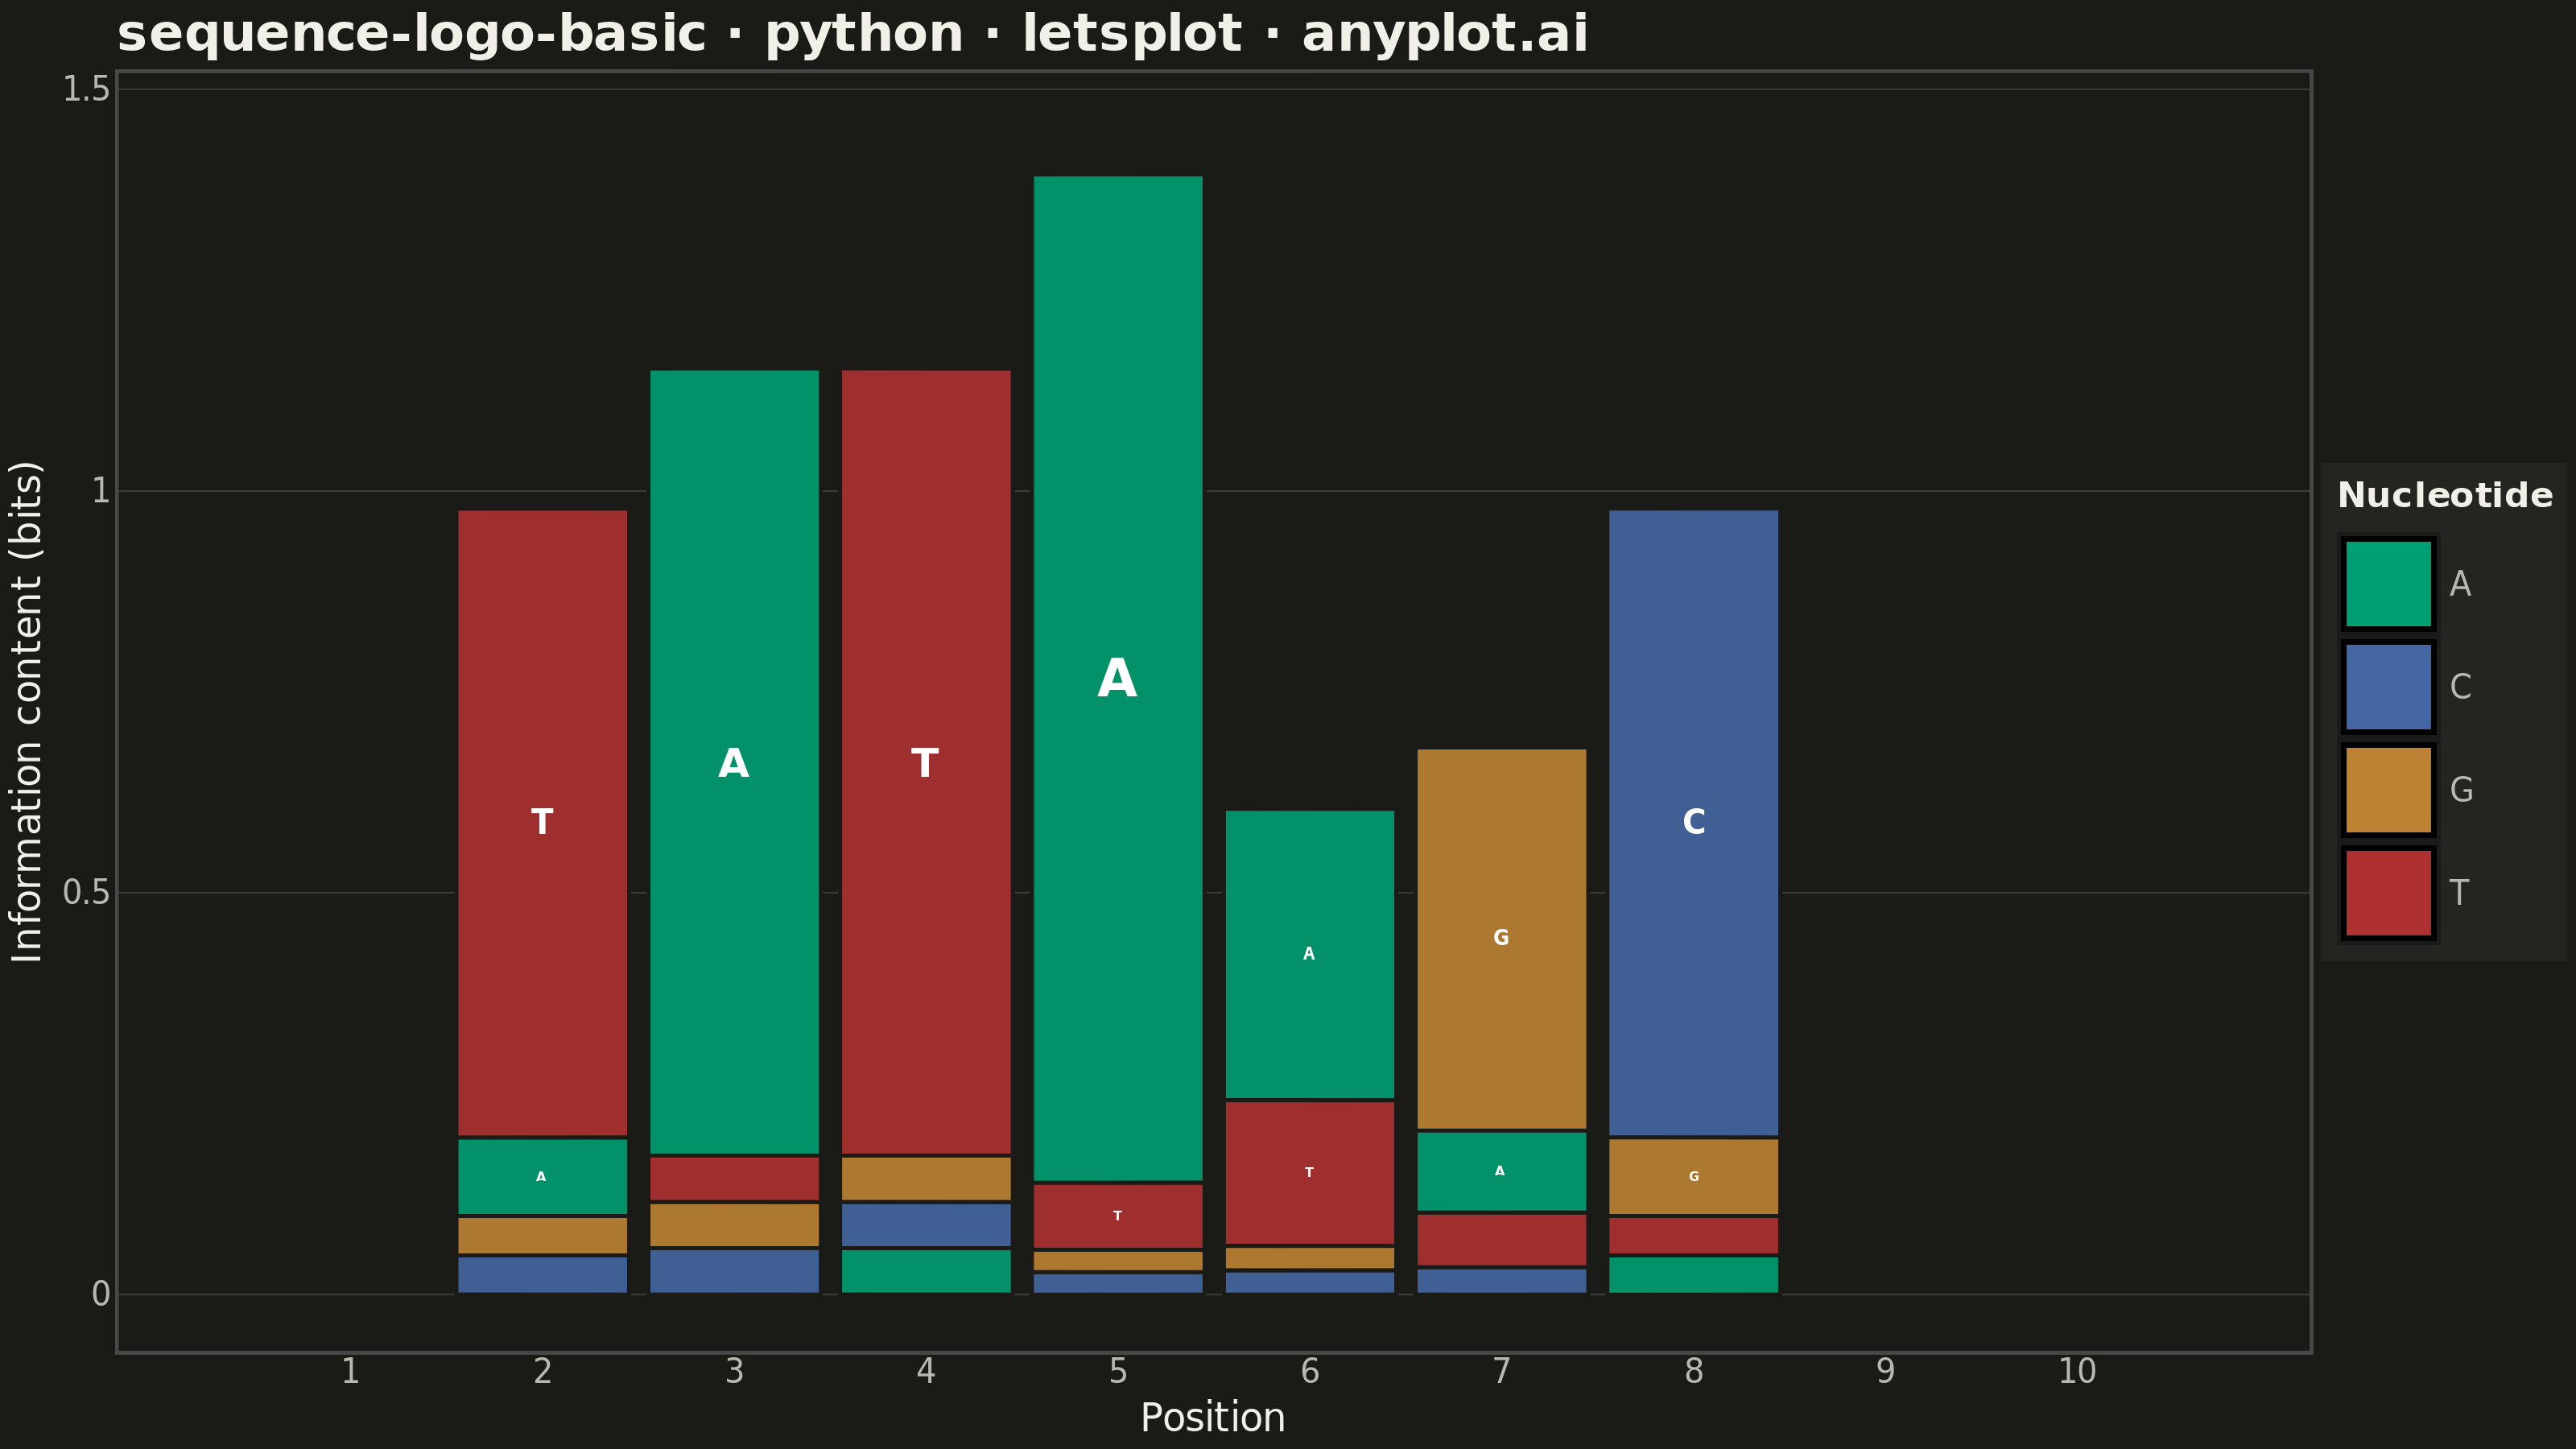
A sequence logo visualizes the consensus of multiple aligned DNA, RNA, or protein sequences. At each position, letters are stacked vertically with height proportional to information content (measured in bits), and individual letter heights within the stack reflect their relative frequency. This is the standard visualization for identifying conserved positions in transcription factor binding sites, splice sites, and protein domains.
""" anyplot.ai
sequence-logo-basic: Sequence Logo for Motif Visualization
Library: letsplot 4.10.1 | Python 3.13.13
Quality: 83/100 | Updated: 2026-06-02
"""

import os

import numpy as np
import pandas as pd
from lets_plot import *


LetsPlot.setup_html()

THEME = os.getenv("ANYPLOT_THEME", "light")
PAGE_BG = "#FAF8F1" if THEME == "light" else "#1A1A17"
ELEVATED_BG = "#FFFDF6" if THEME == "light" else "#242420"
INK = "#1A1A17" if THEME == "light" else "#F0EFE8"
INK_SOFT = "#4A4A44" if THEME == "light" else "#B8B7B0"
RULE = "rgba(26,26,23,0.15)" if THEME == "light" else "rgba(240,239,232,0.15)"

# Imprint palette members for DNA nucleotides (A=green, C=blue, G=ochre, T=red)
color_map = {"A": "#009E73", "C": "#4467A3", "G": "#BD8233", "T": "#AE3030"}

# 10-position TATA-box transcription factor binding site motif
positions = list(range(1, 11))
frequencies = {
    1: {"A": 0.25, "C": 0.25, "G": 0.25, "T": 0.25},
    2: {"A": 0.10, "C": 0.05, "G": 0.05, "T": 0.80},
    3: {"A": 0.85, "C": 0.05, "G": 0.05, "T": 0.05},
    4: {"A": 0.05, "C": 0.05, "G": 0.05, "T": 0.85},
    5: {"A": 0.90, "C": 0.02, "G": 0.02, "T": 0.06},
    6: {"A": 0.60, "C": 0.05, "G": 0.05, "T": 0.30},
    7: {"A": 0.15, "C": 0.05, "G": 0.70, "T": 0.10},
    8: {"A": 0.05, "C": 0.80, "G": 0.10, "T": 0.05},
    9: {"A": 0.30, "C": 0.30, "G": 0.20, "T": 0.20},
    10: {"A": 0.25, "C": 0.25, "G": 0.25, "T": 0.25},
}

# Calculate information content and build stacked letter segments
rows = []
max_info = 0.0
for pos in positions:
    freqs = frequencies[pos]
    entropy = -sum(f * np.log2(f) for f in freqs.values() if f > 0)
    info_content = 2.0 - entropy

    # Stack lowest-frequency letters at base, highest on top
    sorted_letters = sorted(freqs.items(), key=lambda x: x[1])
    y_bottom = 0.0
    for letter, freq in sorted_letters:
        height = freq * info_content
        if height < 0.02:
            y_bottom += height
            continue
        rows.append(
            {
                "position": pos,
                "xmin": pos - 0.45,
                "xmax": pos + 0.45,
                "ymin": y_bottom,
                "ymax": y_bottom + height,
                "ymid": y_bottom + height / 2,
                "height": height,
                "letter": letter,
                "frequency": freq,
                "info_bits": round(info_content, 3),
            }
        )
        y_bottom += height
    if info_content > max_info:
        max_info = info_content

df = pd.DataFrame(rows)
# Only label blocks tall enough to show text legibly
df_labeled = df[df["height"] > 0.08].copy()
# Scale text size proportional to block height so letters visually fill allocated space
df_labeled["text_size"] = (df_labeled["height"] / max_info * 9).clip(2, 9)

# Invisible points for building a proper fill legend with square symbols
legend_df = pd.DataFrame({"x": [0] * 4, "y": [0] * 4, "letter": ["A", "C", "G", "T"]})

y_max = np.ceil(max_info * 5) / 5 + 0.05

title = "sequence-logo-basic · python · letsplot · anyplot.ai"
title_size = round(16 * min(1.0, 67 / len(title)))

plot = (
    ggplot()
    # Solid colored blocks fill their allocated height — primary sequence logo encoding
    + geom_rect(
        aes(xmin="xmin", xmax="xmax", ymin="ymin", ymax="ymax", fill="letter"),
        data=df,
        alpha=0.90,
        color=PAGE_BG,
        size=0.5,
        show_legend=False,
    )
    # Letter labels with size proportional to block height so they visually fill allocated space
    + geom_text(
        aes(x="position", y="ymid", label="letter", size="text_size"),
        data=df_labeled,
        fontface="bold",
        color="white",
        show_legend=False,
        tooltips=layer_tooltips()
        .format("@frequency", ".0%")
        .format("@info_bits", ".3f")
        .line("@letter")
        .line("Frequency: @frequency")
        .line("Info content: @info_bits bits"),
    )
    + scale_size_identity()
    # Invisible points — carry fill mapping so the legend renders colored squares
    + geom_point(
        aes(x="x", y="y", fill="letter"),
        data=legend_df,
        size=6,
        shape=22,
        color="rgba(0,0,0,0)",
        alpha=0,
        tooltips="none",
    )
    + scale_fill_manual(values=color_map, name="Nucleotide", breaks=["A", "C", "G", "T"])
    + scale_x_continuous(breaks=positions, limits=[0.3, 10.7])
    + scale_y_continuous(limits=[0, y_max], breaks=[0.0, 0.5, 1.0, 1.5, 2.0])
    + guides(fill=guide_legend(override_aes={"size": 12, "alpha": 1.0}))
    + labs(x="Position", y="Information content (bits)", title=title)
    + theme_minimal()
    + theme(
        plot_title=element_text(size=title_size, face="bold", color=INK),
        axis_title=element_text(size=12, color=INK),
        axis_text=element_text(size=10, color=INK_SOFT),
        legend_title=element_text(size=11, face="bold", color=INK),
        legend_text=element_text(size=10, color=INK_SOFT),
        axis_line=element_line(color=INK_SOFT, size=0.5),
        panel_grid_major_x=element_blank(),
        panel_grid_minor=element_blank(),
        panel_grid_major_y=element_line(color=RULE, size=0.5),
        plot_background=element_rect(fill=PAGE_BG, color=PAGE_BG),
        panel_background=element_rect(fill=PAGE_BG),
        legend_background=element_rect(fill=ELEVATED_BG, color=INK_SOFT),
    )
    + ggsize(800, 450)
)

ggsave(plot, f"plot-{THEME}.png", scale=4, path=".")
ggsave(plot, f"plot-{THEME}.html", path=".")
Runnable source as JSON, for any HTTP client: https://api.anyplot.ai/specs/sequence-logo-basic/letsplot/code. Any spec id and library id listed in llms-full.txt fit the same URL shape; every URL below is complete and callable.
{
  "spec_id": "sequence-logo-basic",
  "language": "python",
  "library": "letsplot",
  "page": "https://anyplot.ai/sequence-logo-basic/python/letsplot",
  "hub": "https://anyplot.ai/sequence-logo-basic",
  "code_json": "https://api.anyplot.ai/specs/sequence-logo-basic/letsplot/code",
  "spec_json": "https://api.anyplot.ai/specs/sequence-logo-basic",
  "render_light_png": "https://storage.googleapis.com/anyplot-images/plots/sequence-logo-basic/python/letsplot/plot-light.png",
  "render_dark_png": "https://storage.googleapis.com/anyplot-images/plots/sequence-logo-basic/python/letsplot/plot-dark.png",
  "interactive_light_html": "https://storage.googleapis.com/anyplot-images/plots/sequence-logo-basic/python/letsplot/plot-light.html",
  "interactive_dark_html": "https://storage.googleapis.com/anyplot-images/plots/sequence-logo-basic/python/letsplot/plot-dark.html",
  "quality_score": 83.0,
  "license": "MIT",
  "guide": "https://anyplot.ai/llms.txt"
}
Part of Sequence Logo for Motif Visualization on anyplot.ai.