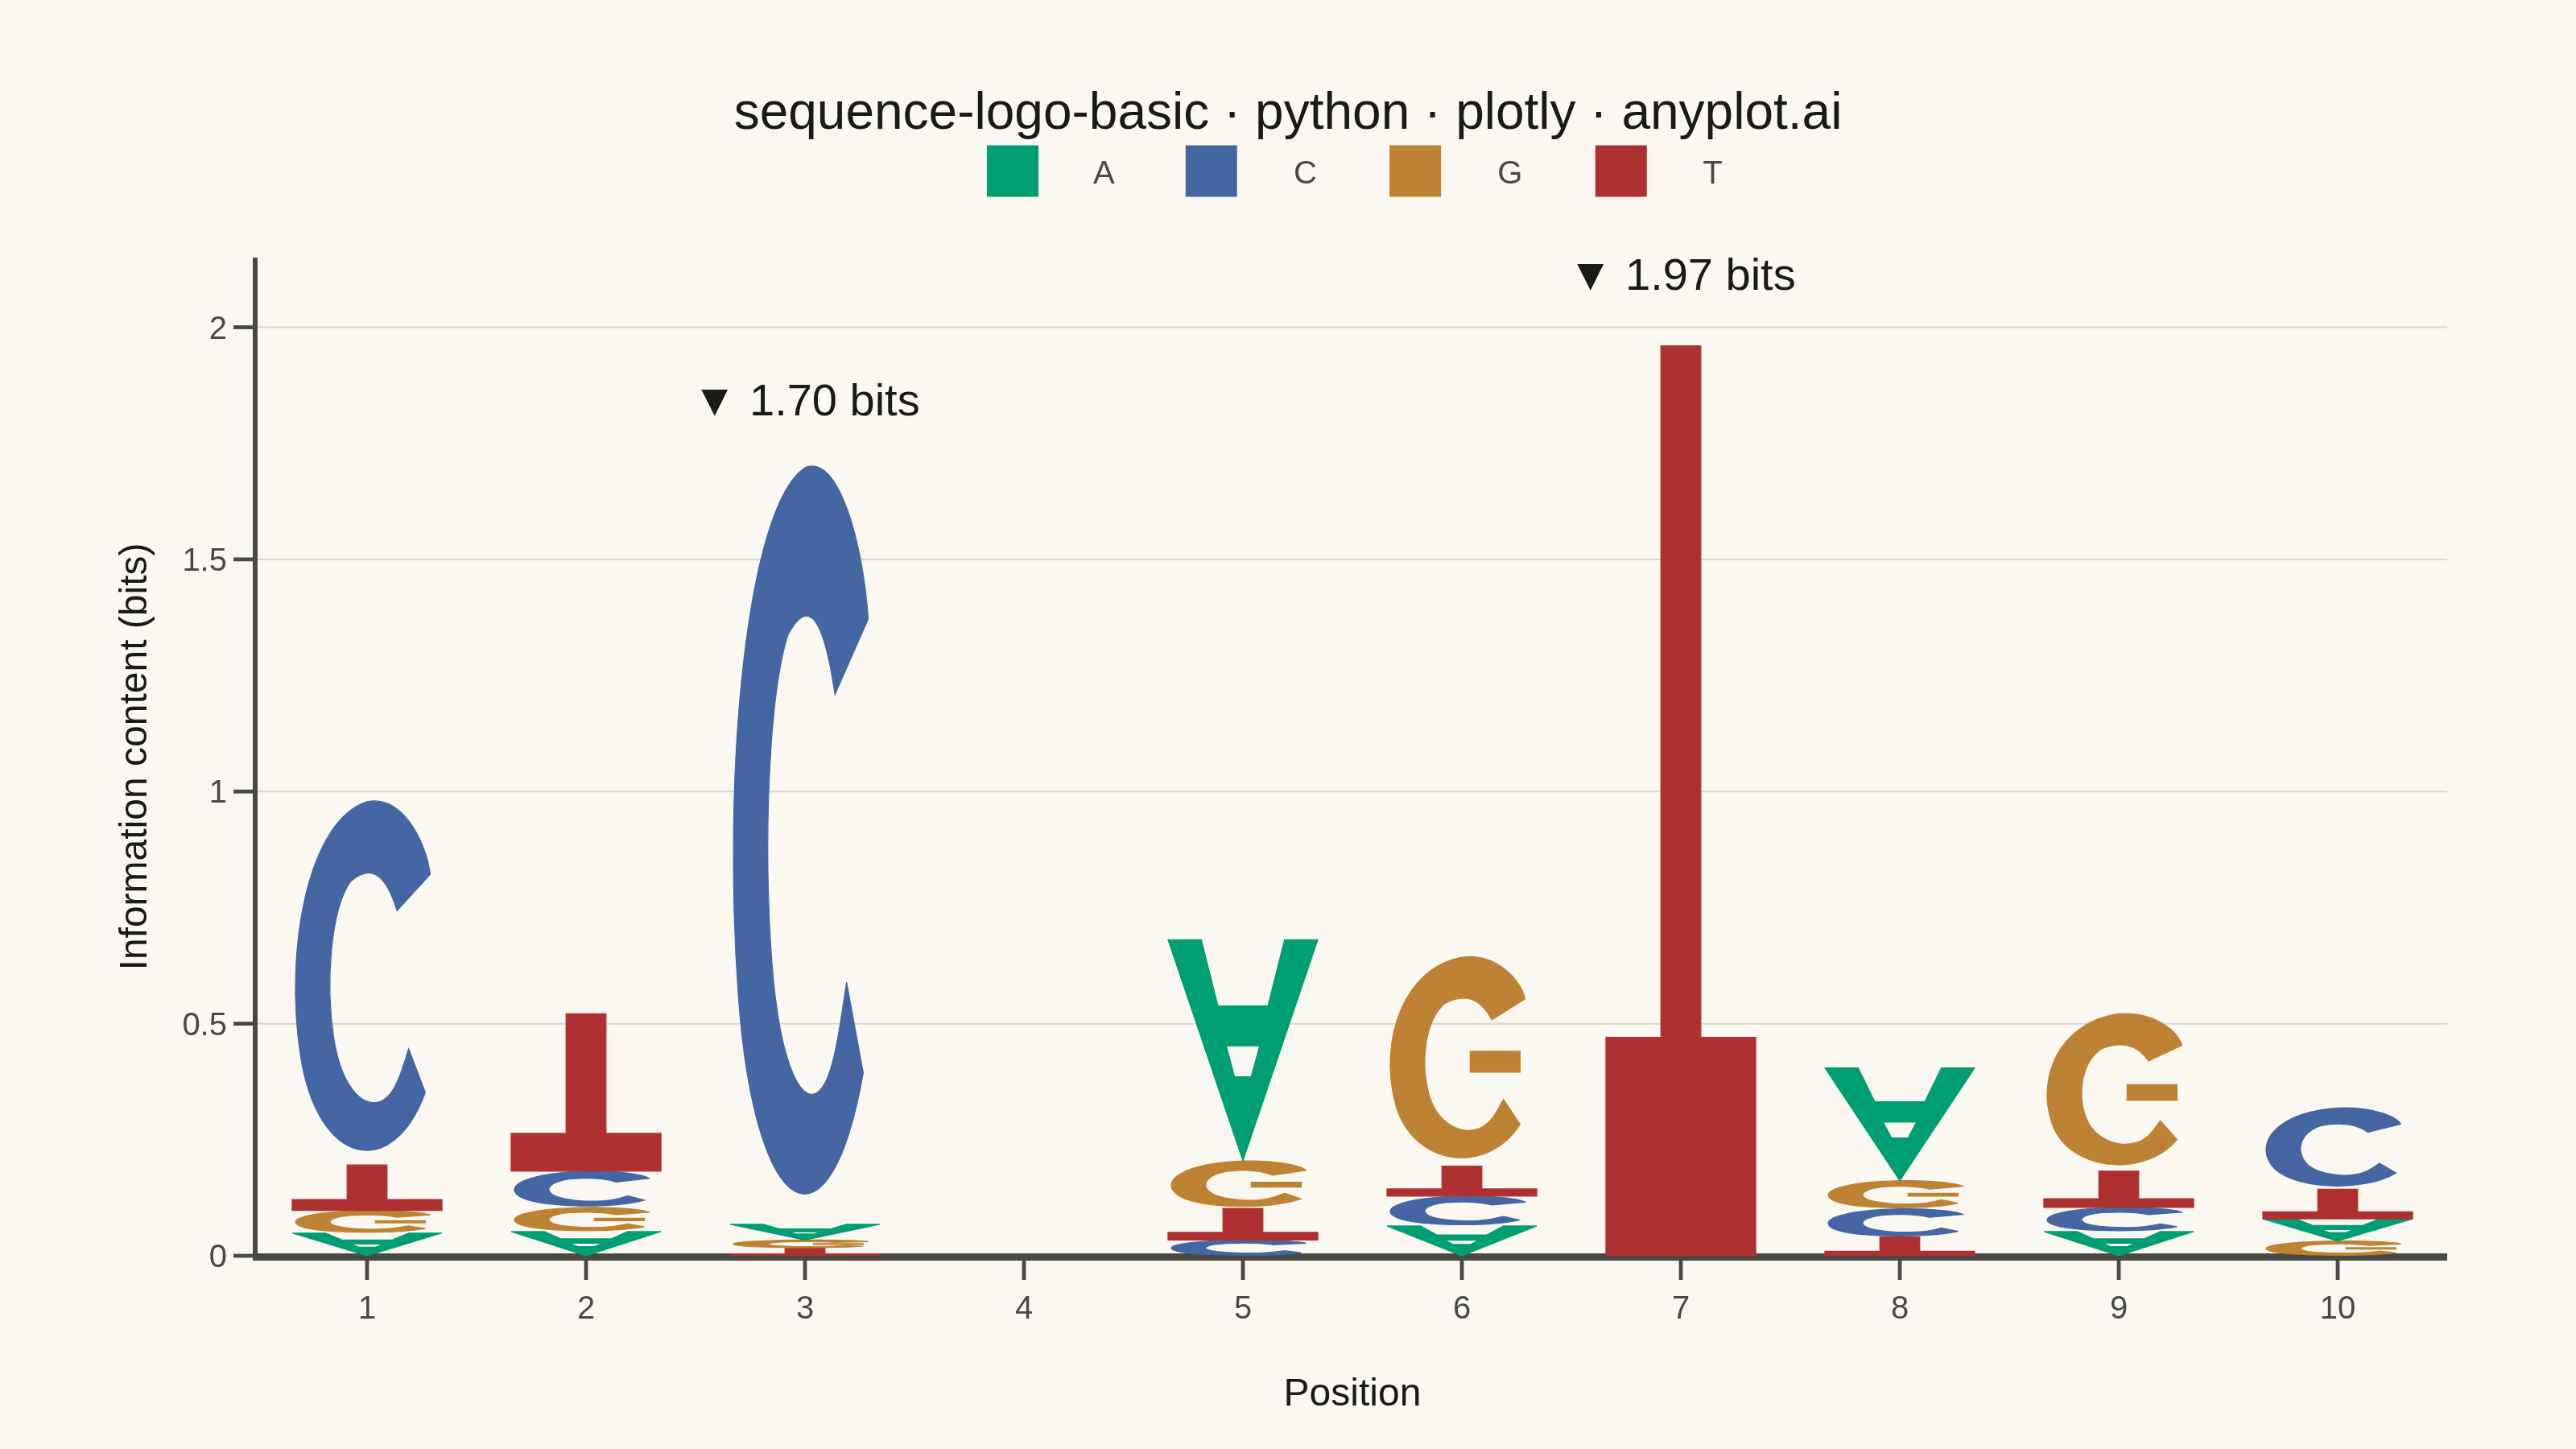
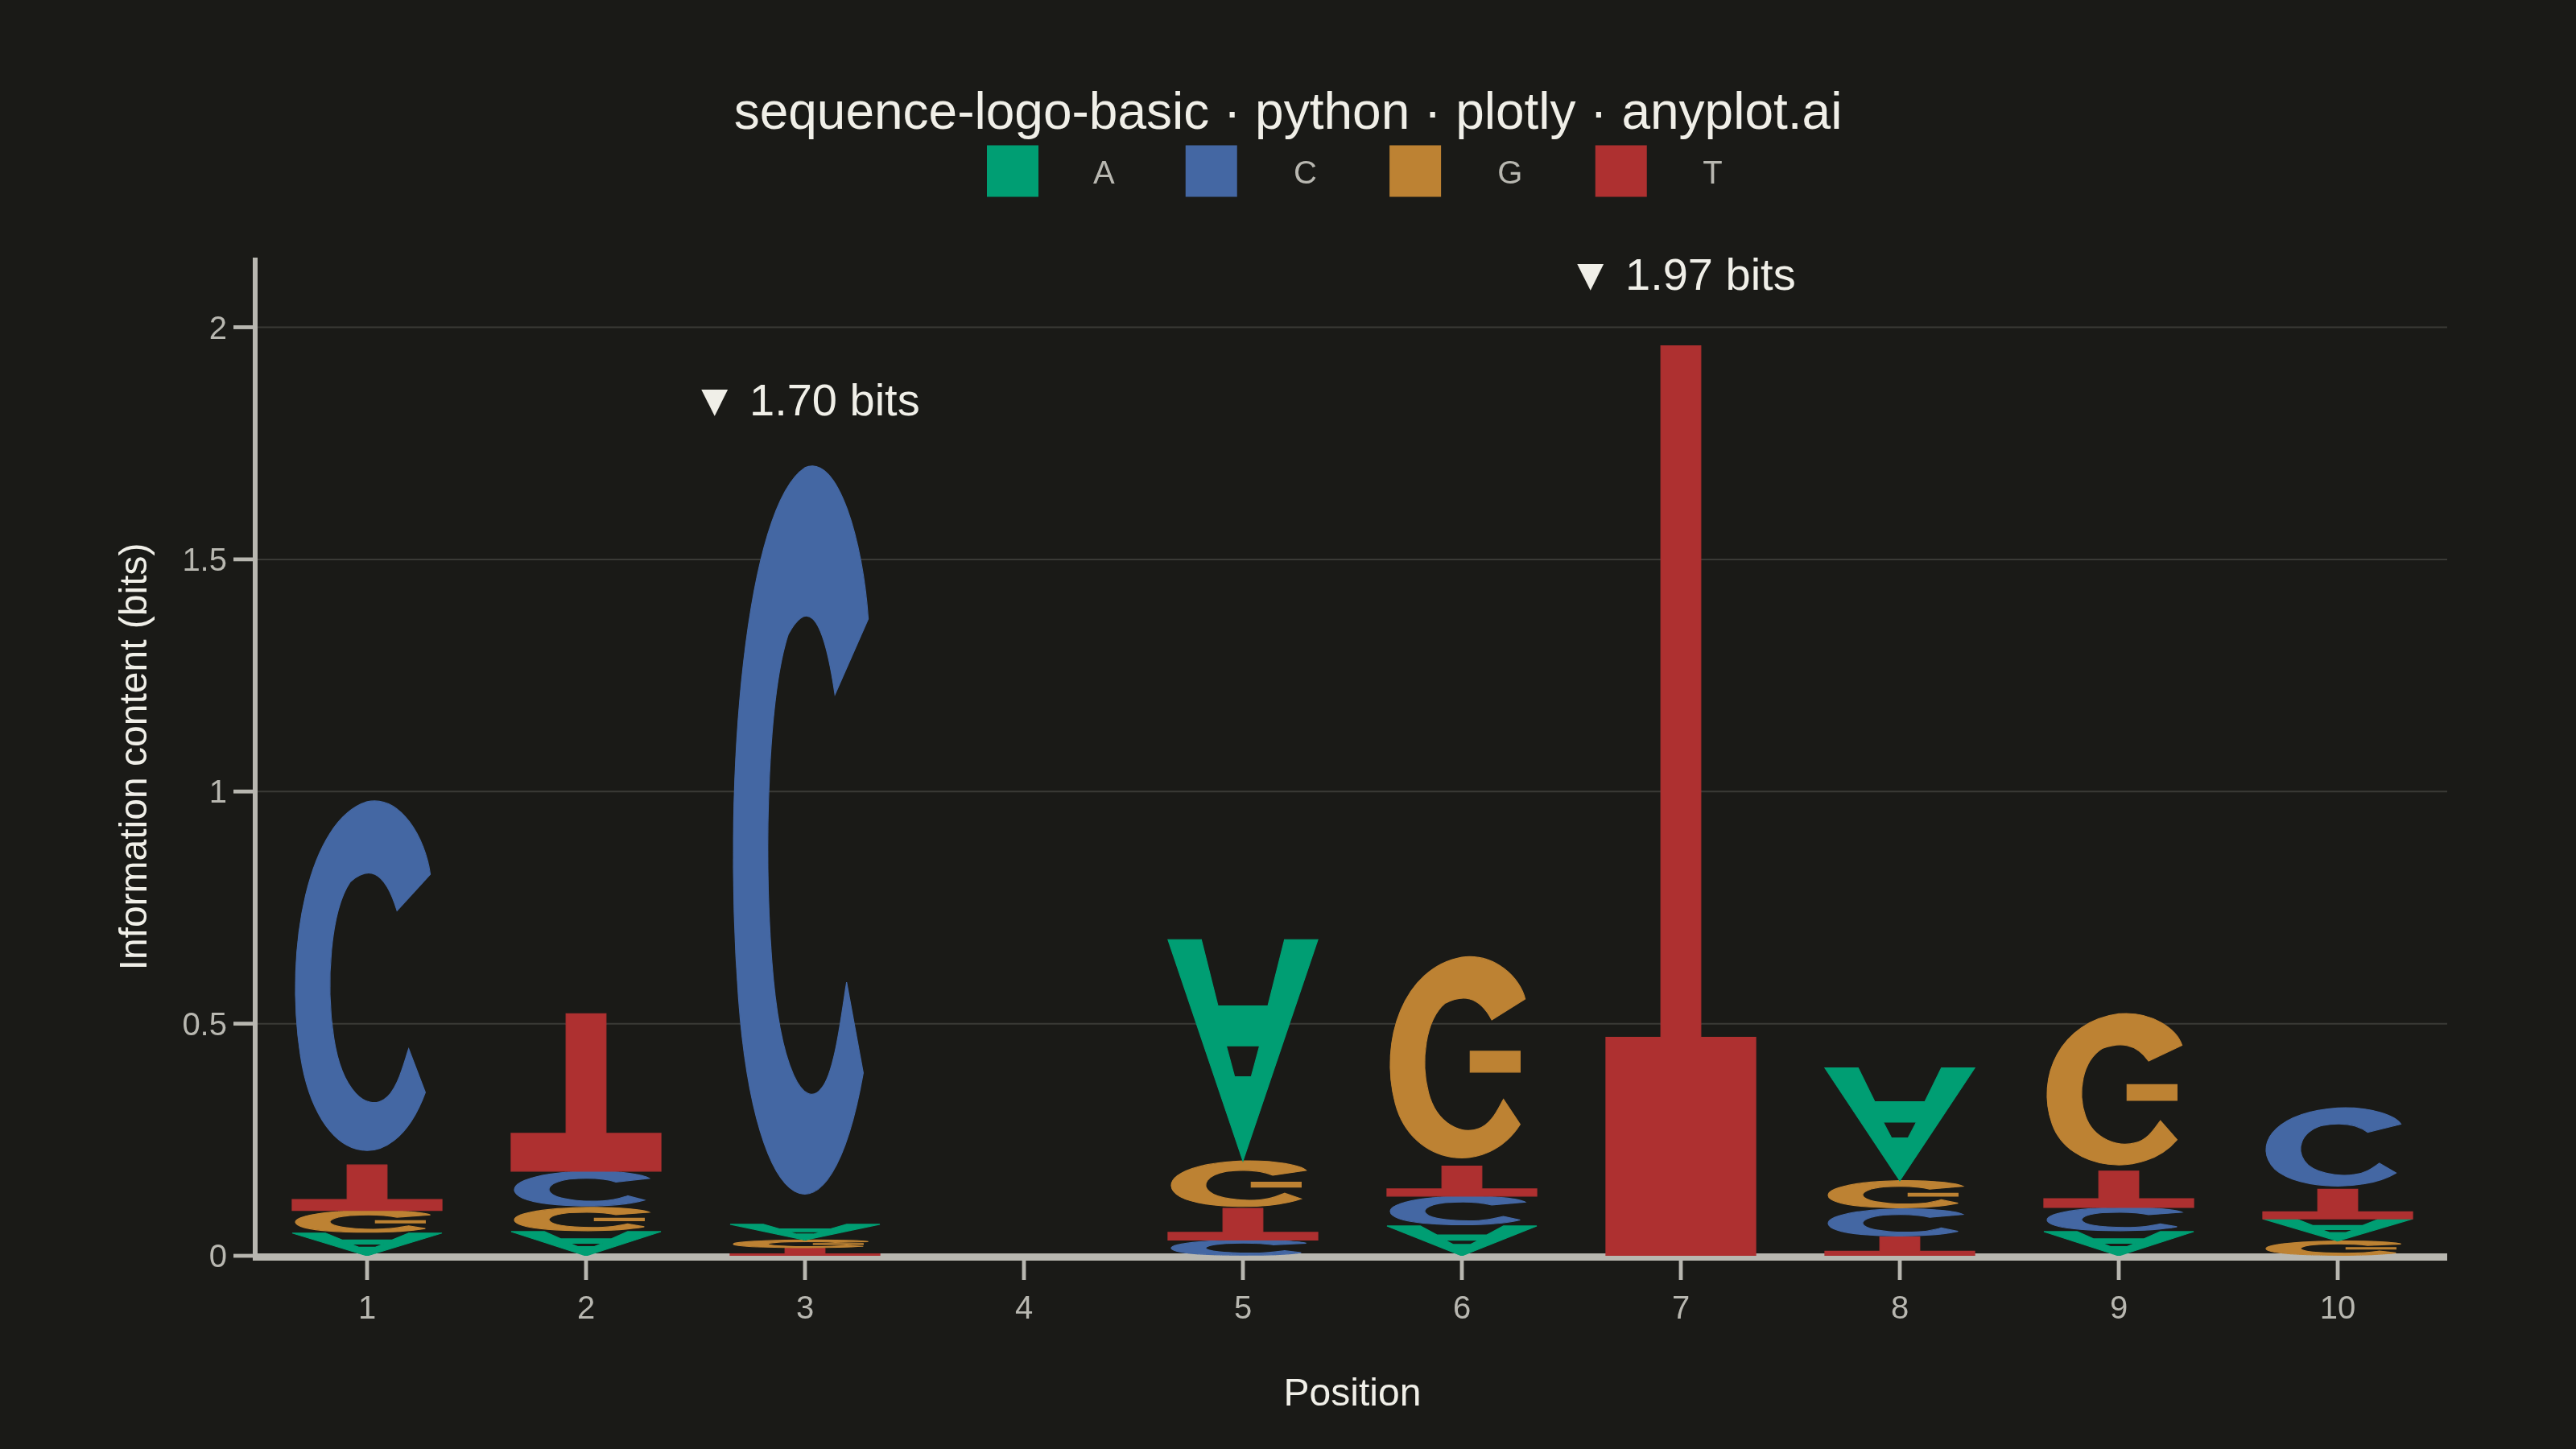
A sequence logo visualizes the consensus of multiple aligned DNA, RNA, or protein sequences. At each position, letters are stacked vertically with height proportional to information content (measured in bits), and individual letter heights within the stack reflect their relative frequency. This is the standard visualization for identifying conserved positions in transcription factor binding sites, splice sites, and protein domains.
""" anyplot.ai
sequence-logo-basic: Sequence Logo for Motif Visualization
Library: plotly 6.7.0 | Python 3.13.13
Quality: 88/100 | Updated: 2026-06-02
"""

import os

import numpy as np
import plotly.graph_objects as go


# Theme tokens
THEME = os.getenv("ANYPLOT_THEME", "light")
PAGE_BG = "#FAF8F1" if THEME == "light" else "#1A1A17"
ELEVATED_BG = "#FFFDF6" if THEME == "light" else "#242420"
INK = "#1A1A17" if THEME == "light" else "#F0EFE8"
INK_SOFT = "#4A4A44" if THEME == "light" else "#B8B7B0"
INK_MUTED = "#6B6A63" if THEME == "light" else "#A8A79F"
GRID = "rgba(26,26,23,0.15)" if THEME == "light" else "rgba(240,239,232,0.15)"

# DNA sequence logo colors — Imprint palette, matching biological convention
# A=green (#009E73), C=blue (#4467A3), G=ochre (#BD8233), T=red (#AE3030)
DNA_COLORS = {"A": "#009E73", "C": "#4467A3", "G": "#BD8233", "T": "#AE3030"}

# Data — transcription factor binding site motif (10-position DNA)
# Each row: [A, C, G, T] frequencies summing to 1
pwm = np.array(
    [
        [0.05, 0.80, 0.05, 0.10],  # pos 1: C dominant
        [0.10, 0.15, 0.10, 0.65],  # pos 2: T dominant
        [0.02, 0.96, 0.01, 0.01],  # pos 3: C highly conserved (~1.8 bits)
        [0.25, 0.25, 0.25, 0.25],  # pos 4: uniform (0 bits)
        [0.70, 0.05, 0.15, 0.10],  # pos 5: A dominant
        [0.10, 0.10, 0.70, 0.10],  # pos 6: G dominant
        [0.001, 0.001, 0.001, 0.997],  # pos 7: T near-perfect conservation (~1.97 bits)
        [0.60, 0.15, 0.15, 0.10],  # pos 8: A dominant
        [0.10, 0.10, 0.65, 0.15],  # pos 9: G dominant
        [0.15, 0.55, 0.10, 0.20],  # pos 10: C dominant
    ]
)

letters = ["A", "C", "G", "T"]
n_positions = len(pwm)

# Information content: IC = 2 + sum(f * log2(f)) bits (max 2 bits for DNA)
info_content = np.array([max(0.0, 2.0 + sum(f * np.log2(f) for f in row if f > 0)) for row in pwm])

# Letter heights = frequency * information content at each position
letter_heights = pwm * info_content[:, np.newaxis]

# SVG glyph paths in normalized 0-1 unit square (x: 0=left, 1=right; y: 0=bottom, 1=top)
GLYPH_PATHS = {
    # A: apex at top (y=1), legs at bottom (y=0), crossbar at y≈0.3, inner hole above crossbar
    "A": "M 0.5 1 L 0.05 0 L 0.25 0 L 0.35 0.3 L 0.65 0.3 L 0.75 0 L 0.95 0 L 0.5 1 Z M 0.4 0.48 L 0.6 0.48 L 0.55 0.62 L 0.45 0.62 Z",
    "C": "M 0.85 0.2 C 0.65 -0.05 0.2 0 0.1 0.3 C 0 0.6 0.15 0.95 0.5 1 C 0.7 1.02 0.85 0.9 0.88 0.8 L 0.68 0.7 C 0.6 0.82 0.5 0.82 0.4 0.78 C 0.28 0.7 0.25 0.5 0.3 0.35 C 0.35 0.2 0.5 0.15 0.6 0.18 C 0.68 0.2 0.72 0.28 0.75 0.32 Z",
    "G": "M 0.85 0.2 C 0.65 -0.05 0.2 0 0.1 0.3 C 0 0.6 0.15 0.95 0.5 1 C 0.7 1.02 0.85 0.9 0.88 0.8 L 0.68 0.7 C 0.6 0.82 0.5 0.82 0.4 0.78 C 0.28 0.7 0.25 0.5 0.3 0.35 C 0.35 0.2 0.5 0.15 0.6 0.18 C 0.68 0.2 0.72 0.28 0.75 0.32 L 0.85 0.2 Z M 0.55 0.45 L 0.85 0.45 L 0.85 0.55 L 0.55 0.55 Z",
    # T: crossbar at top (y=0.76–1), stem extends down to y=0
    "T": "M 0.05 1 L 0.05 0.76 L 0.38 0.76 L 0.38 0 L 0.62 0 L 0.62 0.76 L 0.95 0.76 L 0.95 1 Z",
}

# Plot
fig = go.Figure()
BAR_HALF_W = 0.38

for pos in range(n_positions):
    sorted_idx = np.argsort(letter_heights[pos])
    y_bottom = 0.0

    for idx in sorted_idx:
        h = float(letter_heights[pos][idx])
        if h < 0.005:
            continue
        letter = letters[idx]

        # Invisible bar carries hover tooltip for the nucleotide at this position
        fig.add_trace(
            go.Bar(
                x=[pos + 1],
                y=[h],
                base=y_bottom,
                width=BAR_HALF_W * 2,
                marker={"color": "rgba(0,0,0,0)", "line": {"width": 0}},
                showlegend=False,
                hovertemplate=(
                    f"<b>Position {pos + 1}</b><br>"
                    f"Nucleotide: {letter}<br>"
                    f"Frequency: {pwm[pos][idx]:.0%}<br>"
                    f"Height: {h:.3f} bits<extra></extra>"
                ),
            )
        )

        # Transform normalized glyph path into data coordinates
        tokens = GLYPH_PATHS[letter].split()
        out, i, x0 = [], 0, (pos + 1) - BAR_HALF_W
        while i < len(tokens):
            cmd = tokens[i]
            if cmd == "Z":
                out.append("Z")
                i += 1
            elif cmd in ("M", "L"):
                out += [
                    cmd,
                    f"{x0 + float(tokens[i + 1]) * 2 * BAR_HALF_W:.4f}",
                    f"{y_bottom + float(tokens[i + 2]) * h:.4f}",
                ]
                i += 3
            elif cmd == "C":
                out.append("C")
                for j in range(3):
                    out += [
                        f"{x0 + float(tokens[i + 1 + j * 2]) * 2 * BAR_HALF_W:.4f}",
                        f"{y_bottom + float(tokens[i + 2 + j * 2]) * h:.4f}",
                    ]
                i += 7
            else:
                i += 1

        fig.add_shape(
            type="path",
            path=" ".join(out),
            fillcolor=DNA_COLORS[letter],
            line={"width": 0.3, "color": DNA_COLORS[letter]},
            layer="above",
            xref="x",
            yref="y",
        )
        y_bottom += h

# Legend entries (one square marker per nucleotide)
for letter in letters:
    fig.add_trace(
        go.Scatter(
            x=[None],
            y=[None],
            mode="markers",
            marker={"size": 18, "color": DNA_COLORS[letter], "symbol": "square"},
            name=f"  {letter}  ",
            showlegend=True,
        )
    )

# Annotate highly conserved positions
for pos_idx in [2, 6]:
    ic_val = info_content[pos_idx]
    fig.add_annotation(
        x=pos_idx + 1,
        y=ic_val + 0.08,
        text=f"▼ {ic_val:.2f} bits",
        font={"size": 14, "color": INK, "family": "Arial, sans-serif"},
        showarrow=False,
        yanchor="bottom",
        xanchor="center",
    )

# Mark zero-information position
fig.add_annotation(
    x=4,
    y=-0.08,
    text="no signal",
    font={"size": 12, "color": INK_MUTED, "family": "Arial, sans-serif"},
    showarrow=False,
    yanchor="top",
    xanchor="center",
)

title_text = "sequence-logo-basic · python · plotly · anyplot.ai"
n = len(title_text)
title_size = max(11, round(16 * (67 / n if n > 67 else 1.0)))

# Style
fig.update_layout(
    autosize=False,
    paper_bgcolor=PAGE_BG,
    plot_bgcolor=PAGE_BG,
    template=None,
    barmode="overlay",
    bargap=0,
    title={
        "text": title_text,
        "font": {"size": title_size, "family": "Arial, Helvetica, sans-serif", "color": INK},
        "x": 0.5,
        "xanchor": "center",
    },
    xaxis={
        "title": {"text": "Position", "font": {"size": 12, "color": INK}},
        "tickfont": {"size": 10, "color": INK_SOFT},
        "tickvals": list(range(1, n_positions + 1)),
        "showline": True,
        "linewidth": 1.5,
        "linecolor": INK_SOFT,
        "mirror": False,
        "showgrid": False,
        "zeroline": False,
        "ticks": "outside",
        "ticklen": 6,
        "tickwidth": 1.2,
        "tickcolor": INK_SOFT,
    },
    yaxis={
        "title": {"text": "Information content (bits)", "font": {"size": 12, "color": INK}},
        "tickfont": {"size": 10, "color": INK_SOFT},
        "range": [0, 2.15],
        "showline": True,
        "linewidth": 1.5,
        "linecolor": INK_SOFT,
        "mirror": False,
        "gridwidth": 0.5,
        "gridcolor": GRID,
        "zeroline": True,
        "zerolinewidth": 1.5,
        "zerolinecolor": INK_SOFT,
        "ticks": "outside",
        "ticklen": 6,
        "tickwidth": 1.2,
        "tickcolor": INK_SOFT,
        "dtick": 0.5,
    },
    legend={
        "font": {"size": 10, "family": "Arial Black, Impact, sans-serif", "color": INK_SOFT},
        "orientation": "h",
        "yanchor": "bottom",
        "y": 1.04,
        "xanchor": "center",
        "x": 0.5,
        "bgcolor": "rgba(0,0,0,0)",
        "tracegroupgap": 20,
    },
    margin={"l": 80, "r": 40, "t": 80, "b": 60},
    hoverlabel={
        "bgcolor": ELEVATED_BG,
        "bordercolor": INK_SOFT,
        "font": {"size": 12, "family": "Arial, sans-serif", "color": INK},
    },
)

# Save
fig.write_image(f"plot-{THEME}.png", width=800, height=450, scale=4)
fig.write_html(f"plot-{THEME}.html", include_plotlyjs="cdn")
Runnable source as JSON, for any HTTP client: https://api.anyplot.ai/specs/sequence-logo-basic/plotly/code. Any spec id and library id listed in llms-full.txt fit the same URL shape; every URL below is complete and callable.
{
  "spec_id": "sequence-logo-basic",
  "language": "python",
  "library": "plotly",
  "page": "https://anyplot.ai/sequence-logo-basic/python/plotly",
  "hub": "https://anyplot.ai/sequence-logo-basic",
  "code_json": "https://api.anyplot.ai/specs/sequence-logo-basic/plotly/code",
  "spec_json": "https://api.anyplot.ai/specs/sequence-logo-basic",
  "render_light_png": "https://storage.googleapis.com/anyplot-images/plots/sequence-logo-basic/python/plotly/plot-light.png",
  "render_dark_png": "https://storage.googleapis.com/anyplot-images/plots/sequence-logo-basic/python/plotly/plot-dark.png",
  "interactive_light_html": "https://storage.googleapis.com/anyplot-images/plots/sequence-logo-basic/python/plotly/plot-light.html",
  "interactive_dark_html": "https://storage.googleapis.com/anyplot-images/plots/sequence-logo-basic/python/plotly/plot-dark.html",
  "quality_score": 88.0,
  "license": "MIT",
  "guide": "https://anyplot.ai/llms.txt"
}
Part of Sequence Logo for Motif Visualization on anyplot.ai.