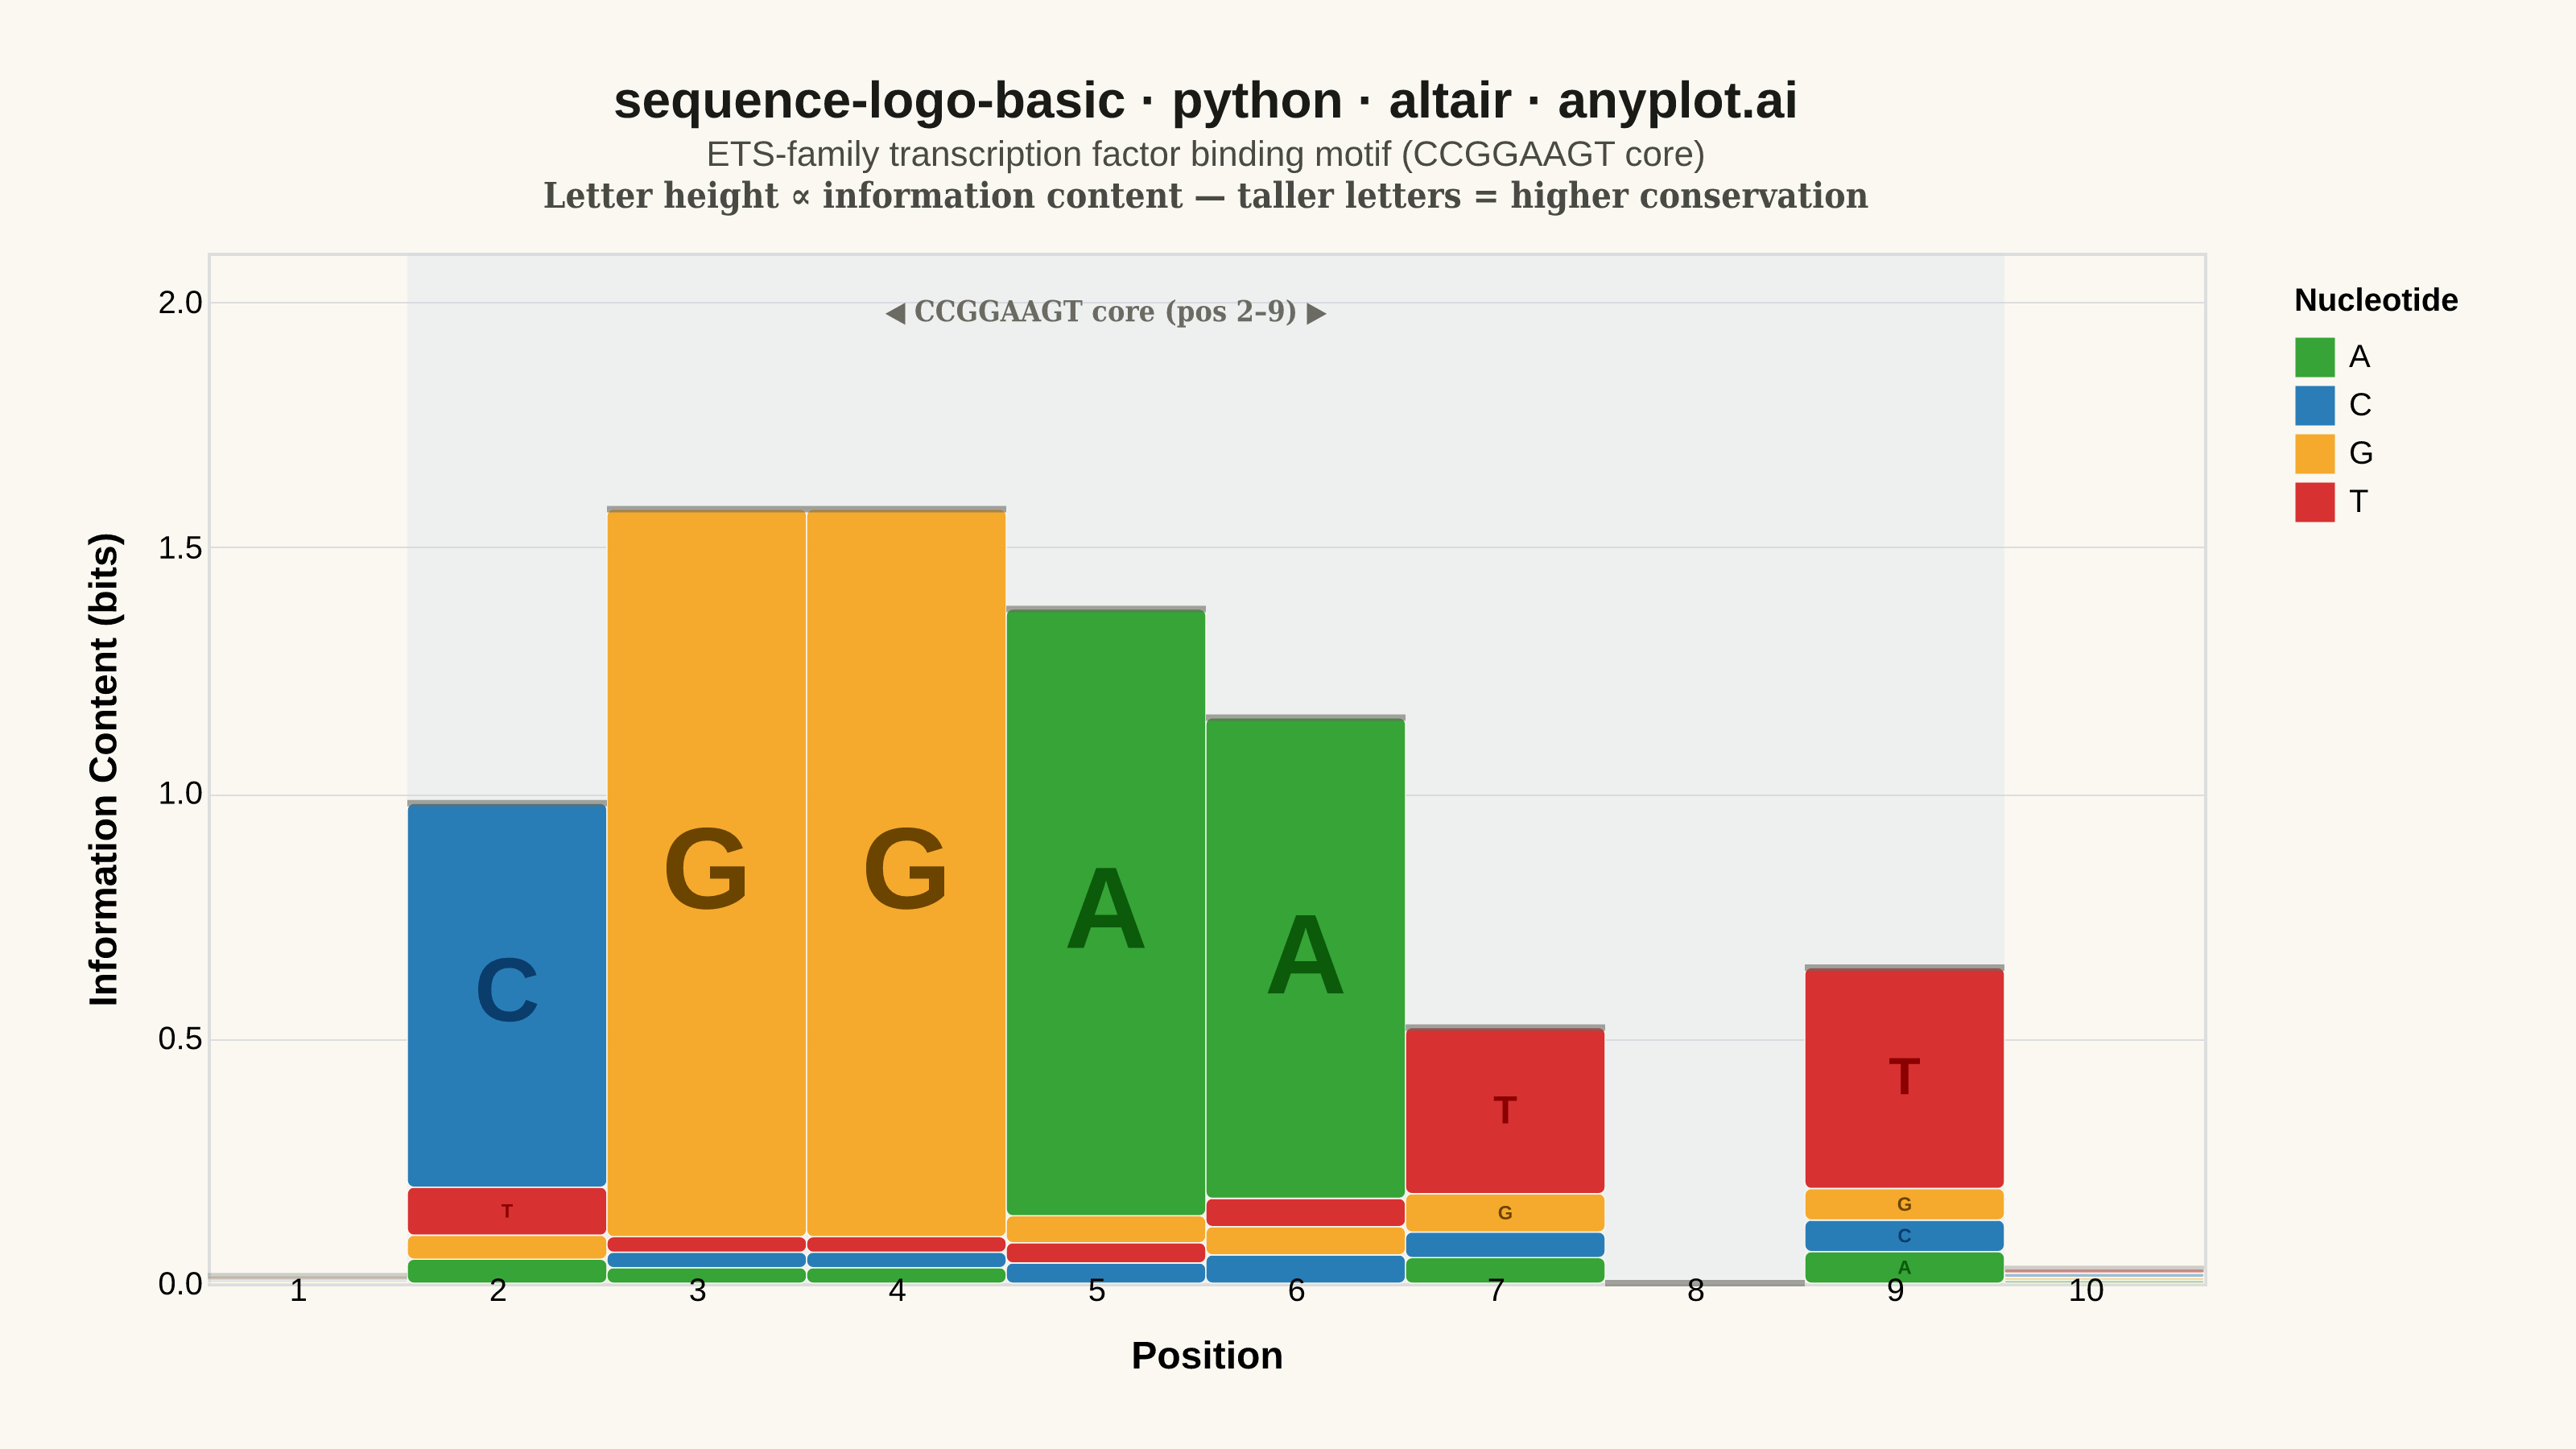
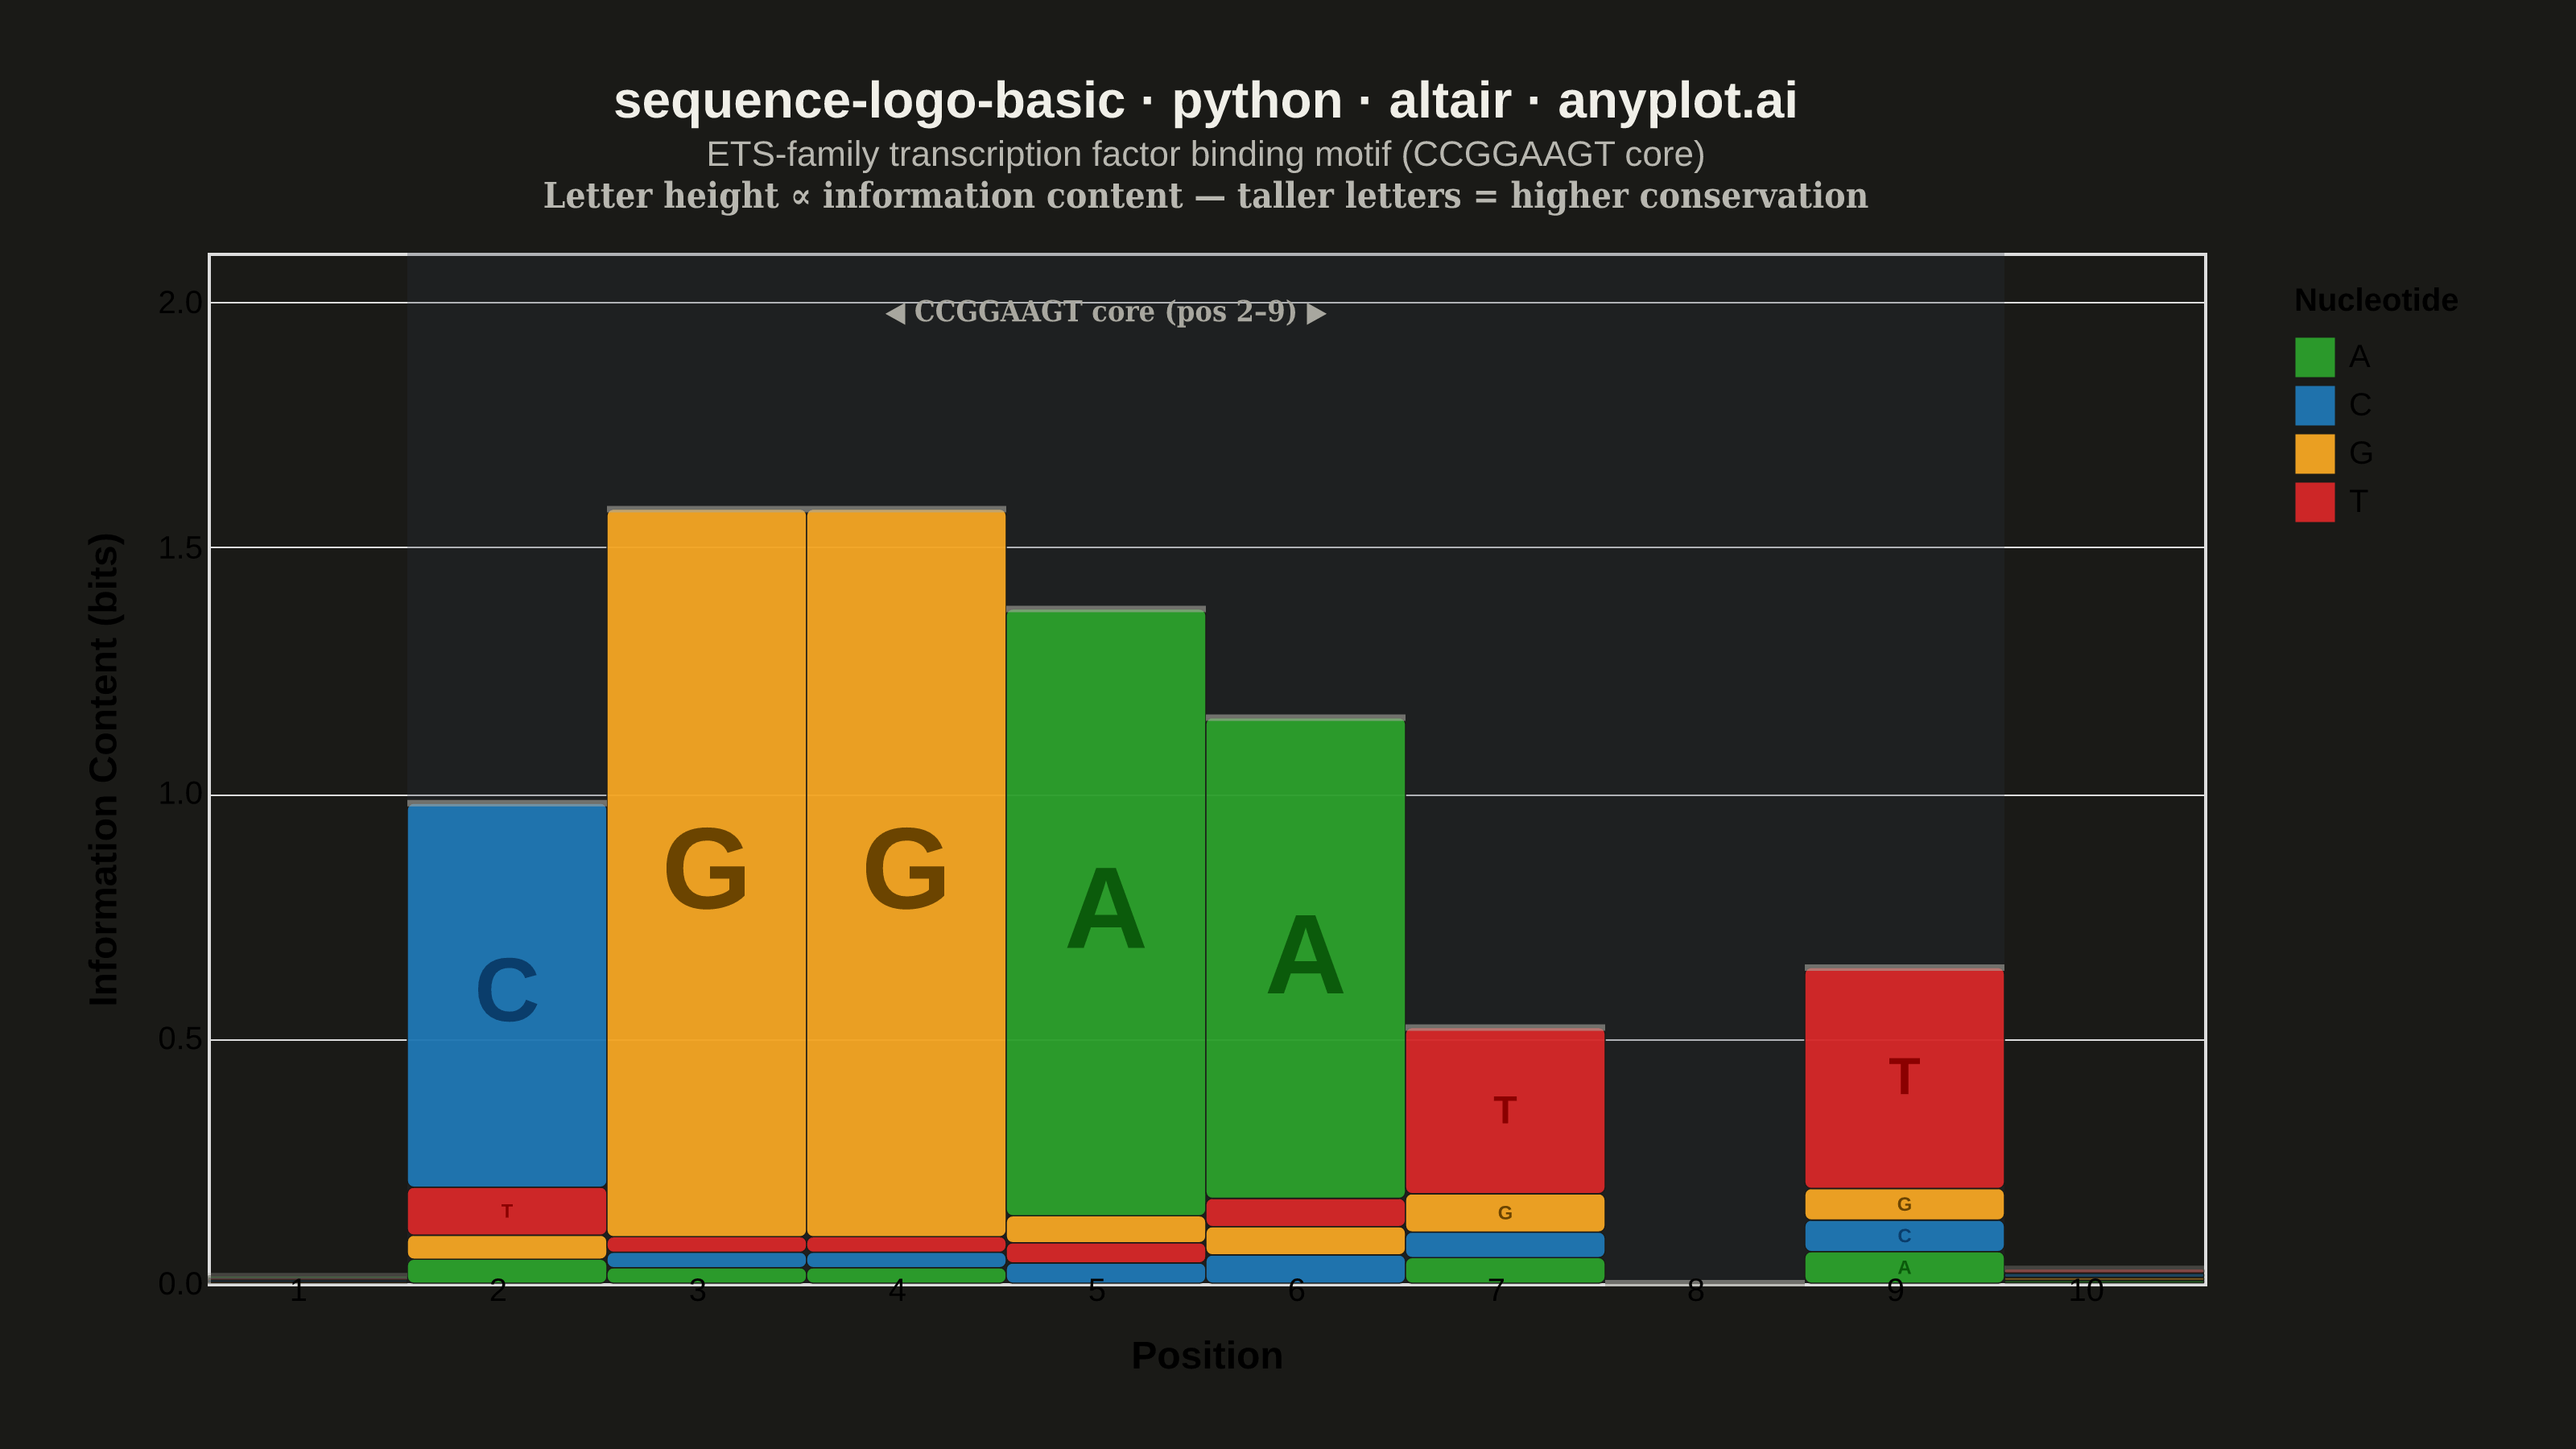
A sequence logo visualizes the consensus of multiple aligned DNA, RNA, or protein sequences. At each position, letters are stacked vertically with height proportional to information content (measured in bits), and individual letter heights within the stack reflect their relative frequency. This is the standard visualization for identifying conserved positions in transcription factor binding sites, splice sites, and protein domains.
""" anyplot.ai
sequence-logo-basic: Sequence Logo for Motif Visualization
Library: altair 6.1.0 | Python 3.13.13
Quality: 90/100 | Updated: 2026-06-02
"""

import os

import altair as alt
import numpy as np
import pandas as pd
from PIL import Image


# Imprint palette — theme-adaptive chrome
THEME = os.getenv("ANYPLOT_THEME", "light")
PAGE_BG = "#FAF8F1" if THEME == "light" else "#1A1A17"
ELEVATED_BG = "#FFFDF6" if THEME == "light" else "#242420"
INK = "#1A1A17" if THEME == "light" else "#F0EFE8"
INK_SOFT = "#4A4A44" if THEME == "light" else "#B8B7B0"
INK_MUTED = "#6B6A63" if THEME == "light" else "#A8A79F"

# Data - ETS-family transcription factor binding motif (CCGGAAGT core)
np.random.seed(42)

frequencies = [
    {"A": 0.30, "C": 0.25, "G": 0.20, "T": 0.25},  # pos 1: low conservation
    {"A": 0.05, "C": 0.80, "G": 0.05, "T": 0.10},  # pos 2: C dominant
    {"A": 0.02, "C": 0.02, "G": 0.94, "T": 0.02},  # pos 3: G highly conserved
    {"A": 0.02, "C": 0.02, "G": 0.94, "T": 0.02},  # pos 4: G highly conserved
    {"A": 0.90, "C": 0.03, "G": 0.04, "T": 0.03},  # pos 5: A dominant
    {"A": 0.85, "C": 0.05, "G": 0.05, "T": 0.05},  # pos 6: A dominant
    {"A": 0.10, "C": 0.10, "G": 0.15, "T": 0.65},  # pos 7: T dominant
    {"A": 0.25, "C": 0.25, "G": 0.25, "T": 0.25},  # pos 8: no conservation
    {"A": 0.10, "C": 0.10, "G": 0.10, "T": 0.70},  # pos 9: T dominant
    {"A": 0.20, "C": 0.30, "G": 0.20, "T": 0.30},  # pos 10: slight C/T bias
]

rows = []
for pos_idx, freqs in enumerate(frequencies):
    position = pos_idx + 1
    entropy = -sum(f * np.log2(f) for f in freqs.values() if f > 0)
    ic = 2.0 - entropy
    sorted_letters = sorted(freqs.items(), key=lambda x: x[1])
    y_start = 0.0
    for letter, freq in sorted_letters:
        height = ic * freq
        rows.append(
            {
                "position": position,
                "letter": letter,
                "height": round(height, 6),
                "y_start": round(y_start, 6),
                "y_end": round(y_start + height, 6),
                "y_mid": round(y_start + height / 2, 6),
                "ic": round(ic, 4),
                "freq": round(freq, 4),
                "is_core": 2 <= position <= 9,
            }
        )
        y_start += height

df = pd.DataFrame(rows)

# Standard DNA colors (semantic exception: domain-standard nucleotide convention per spec)
# A=green, C=blue, G=orange/yellow, T=red
nuc_colors = {"A": "#2ca02c", "C": "#1f77b4", "G": "#F5A623", "T": "#d62728"}
color_scale = alt.Scale(domain=["A", "C", "G", "T"], range=list(nuc_colors.values()))

# Hover selection for interactive column highlighting
position_hover = alt.selection_point(fields=["position"], on="pointerover", empty=False)

y_scale = alt.Scale(domain=[0, 2.1])

# Stacked colored bars per nucleotide segment
bars = (
    alt.Chart(df)
    .mark_rect(cornerRadius=2)
    .encode(
        x=alt.X(
            "position:O",
            title="Position",
            axis=alt.Axis(labelFontSize=10, titleFontSize=12, labelAngle=0, tickSize=0, domainWidth=0, titlePadding=10),
        ),
        y=alt.Y(
            "y_start:Q",
            title="Information Content (bits)",
            scale=y_scale,
            axis=alt.Axis(
                labelFontSize=10,
                titleFontSize=12,
                grid=True,
                gridWidth=0.5,
                tickSize=0,
                domainWidth=0,
                titlePadding=10,
                values=[0, 0.5, 1.0, 1.5, 2.0],
            ),
        ),
        y2="y_end:Q",
        color=alt.Color(
            "letter:N",
            scale=color_scale,
            legend=alt.Legend(
                title="Nucleotide",
                titleFontSize=10,
                labelFontSize=10,
                orient="right",
                symbolSize=150,
                symbolStrokeWidth=0,
                titlePadding=6,
                padding=10,
            ),
        ),
        opacity=alt.condition(alt.datum.is_core, alt.value(0.95), alt.value(0.45)),
        stroke=alt.condition(position_hover, alt.value(INK), alt.value(PAGE_BG)),
        strokeWidth=alt.condition(position_hover, alt.value(1.5), alt.value(0.4)),
        tooltip=[
            alt.Tooltip("position:O", title="Position"),
            alt.Tooltip("letter:N", title="Nucleotide"),
            alt.Tooltip("freq:Q", title="Frequency", format=".0%"),
            alt.Tooltip("height:Q", title="Height (bits)", format=".3f"),
            alt.Tooltip("ic:Q", title="Total IC (bits)", format=".3f"),
        ],
    )
    .add_params(position_hover)
)

# Letter glyphs scaled proportional to information height
letters = (
    alt.Chart(df)
    .transform_filter(alt.datum.height > 0.06)
    .transform_calculate(
        font_size="max(6, min(36, datum.height * 36))",
        letter_color="datum.letter == 'G' ? '#6B4400' : datum.letter == 'A' ? '#0B5B0B' : datum.letter == 'C' ? '#0A3D6B' : '#8B0000'",
    )
    .mark_text(fontWeight="bold", font="Arial Black, Impact, sans-serif", baseline="middle")
    .encode(
        x="position:O",
        y=alt.Y("y_mid:Q", scale=y_scale),
        text="letter:N",
        size=alt.Size("font_size:Q", scale=None, legend=None),
        color=alt.Color("letter_color:N", scale=None, legend=None),
        opacity=alt.condition(alt.datum.is_core, alt.value(1.0), alt.value(0.6)),
    )
)

# Core region label annotation
core_annotation_df = pd.DataFrame([{"position": 5, "y_val": 1.98, "label": "◀ CCGGAAGT core (pos 2–9) ▶"}])
core_annotation = (
    alt.Chart(core_annotation_df)
    .mark_text(fontSize=9, fontWeight="bold", color=INK_MUTED, fontStyle="italic")
    .encode(x="position:O", y=alt.Y("y_val:Q", scale=y_scale), text="label:N")
)

# Subtle background shading for core region
core_bg_color = "#C8D8E8" if THEME == "light" else "#2A3040"
core_bg_df = pd.DataFrame([{"position": p, "y0": 0.0, "y1": 2.1} for p in range(2, 10)])
core_bg = (
    alt.Chart(core_bg_df)
    .mark_rect(color=core_bg_color, opacity=0.25)
    .encode(x="position:O", y=alt.Y("y0:Q", scale=y_scale), y2="y1:Q")
)

# IC summary ticks showing total information content per position
ic_summary_df = df.drop_duplicates(subset=["position"])[["position", "ic", "is_core"]].copy()
ic_ticks = (
    alt.Chart(ic_summary_df)
    .mark_tick(thickness=2, color=INK_MUTED)
    .encode(
        x="position:O",
        y=alt.Y("ic:Q", scale=y_scale),
        opacity=alt.condition(alt.datum.is_core, alt.value(0.6), alt.value(0.3)),
    )
)

# Assemble layered chart — background shading first, then bars, letters, annotations
chart = (
    alt.layer(core_bg, bars, letters, ic_ticks, core_annotation)
    .properties(
        width=620,
        height=320,
        background=PAGE_BG,
        title=alt.Title(
            "sequence-logo-basic · python · altair · anyplot.ai",
            fontSize=16,
            fontWeight="bold",
            anchor="middle",
            color=INK,
            subtitle=[
                "ETS-family transcription factor binding motif (CCGGAAGT core)",
                "Letter height ∝ information content — taller letters = higher conservation",
            ],
            subtitleFontSize=11,
            subtitleFontWeight="normal",
            subtitleColor=INK_SOFT,
            offset=12,
        ),
    )
    .configure_view(strokeWidth=0, fill=PAGE_BG)
    .configure_axis(
        domainColor=INK_SOFT, tickColor=INK_SOFT, labelColor=INK_SOFT, titleColor=INK, gridColor=INK, gridOpacity=0.15
    )
    .configure_title(color=INK)
    .configure_legend(fillColor=ELEVATED_BG, strokeColor=INK_SOFT, labelColor=INK_SOFT, titleColor=INK)
    .configure(padding={"left": 20, "right": 20, "top": 16, "bottom": 16})
)

# Save — pad PNG to exact 3200×1800 target (canvas hard rule — landscape)
TW, TH = 3200, 1800
chart.save(f"plot-{THEME}.png", scale_factor=4.0)
_img = Image.open(f"plot-{THEME}.png").convert("RGB")
_w, _h = _img.size
if _w > TW or _h > TH:
    raise SystemExit(
        f"altair vl-convert produced {_w}×{_h}, exceeds target {TW}×{TH}. "
        f"Shrink chart .properties(width=, height=) values and re-render."
    )
if _w < TW or _h < TH:
    _canvas = Image.new("RGB", (TW, TH), PAGE_BG)
    _canvas.paste(_img, ((TW - _w) // 2, (TH - _h) // 2))
    _canvas.save(f"plot-{THEME}.png")
chart.save(f"plot-{THEME}.html")
Runnable source as JSON, for any HTTP client: https://api.anyplot.ai/specs/sequence-logo-basic/altair/code. Any spec id and library id listed in llms-full.txt fit the same URL shape; every URL below is complete and callable.
{
  "spec_id": "sequence-logo-basic",
  "language": "python",
  "library": "altair",
  "page": "https://anyplot.ai/sequence-logo-basic/python/altair",
  "hub": "https://anyplot.ai/sequence-logo-basic",
  "code_json": "https://api.anyplot.ai/specs/sequence-logo-basic/altair/code",
  "spec_json": "https://api.anyplot.ai/specs/sequence-logo-basic",
  "render_light_png": "https://storage.googleapis.com/anyplot-images/plots/sequence-logo-basic/python/altair/plot-light.png",
  "render_dark_png": "https://storage.googleapis.com/anyplot-images/plots/sequence-logo-basic/python/altair/plot-dark.png",
  "interactive_light_html": "https://storage.googleapis.com/anyplot-images/plots/sequence-logo-basic/python/altair/plot-light.html",
  "interactive_dark_html": "https://storage.googleapis.com/anyplot-images/plots/sequence-logo-basic/python/altair/plot-dark.html",
  "quality_score": 90.0,
  "license": "MIT",
  "guide": "https://anyplot.ai/llms.txt"
}
Part of Sequence Logo for Motif Visualization on anyplot.ai.