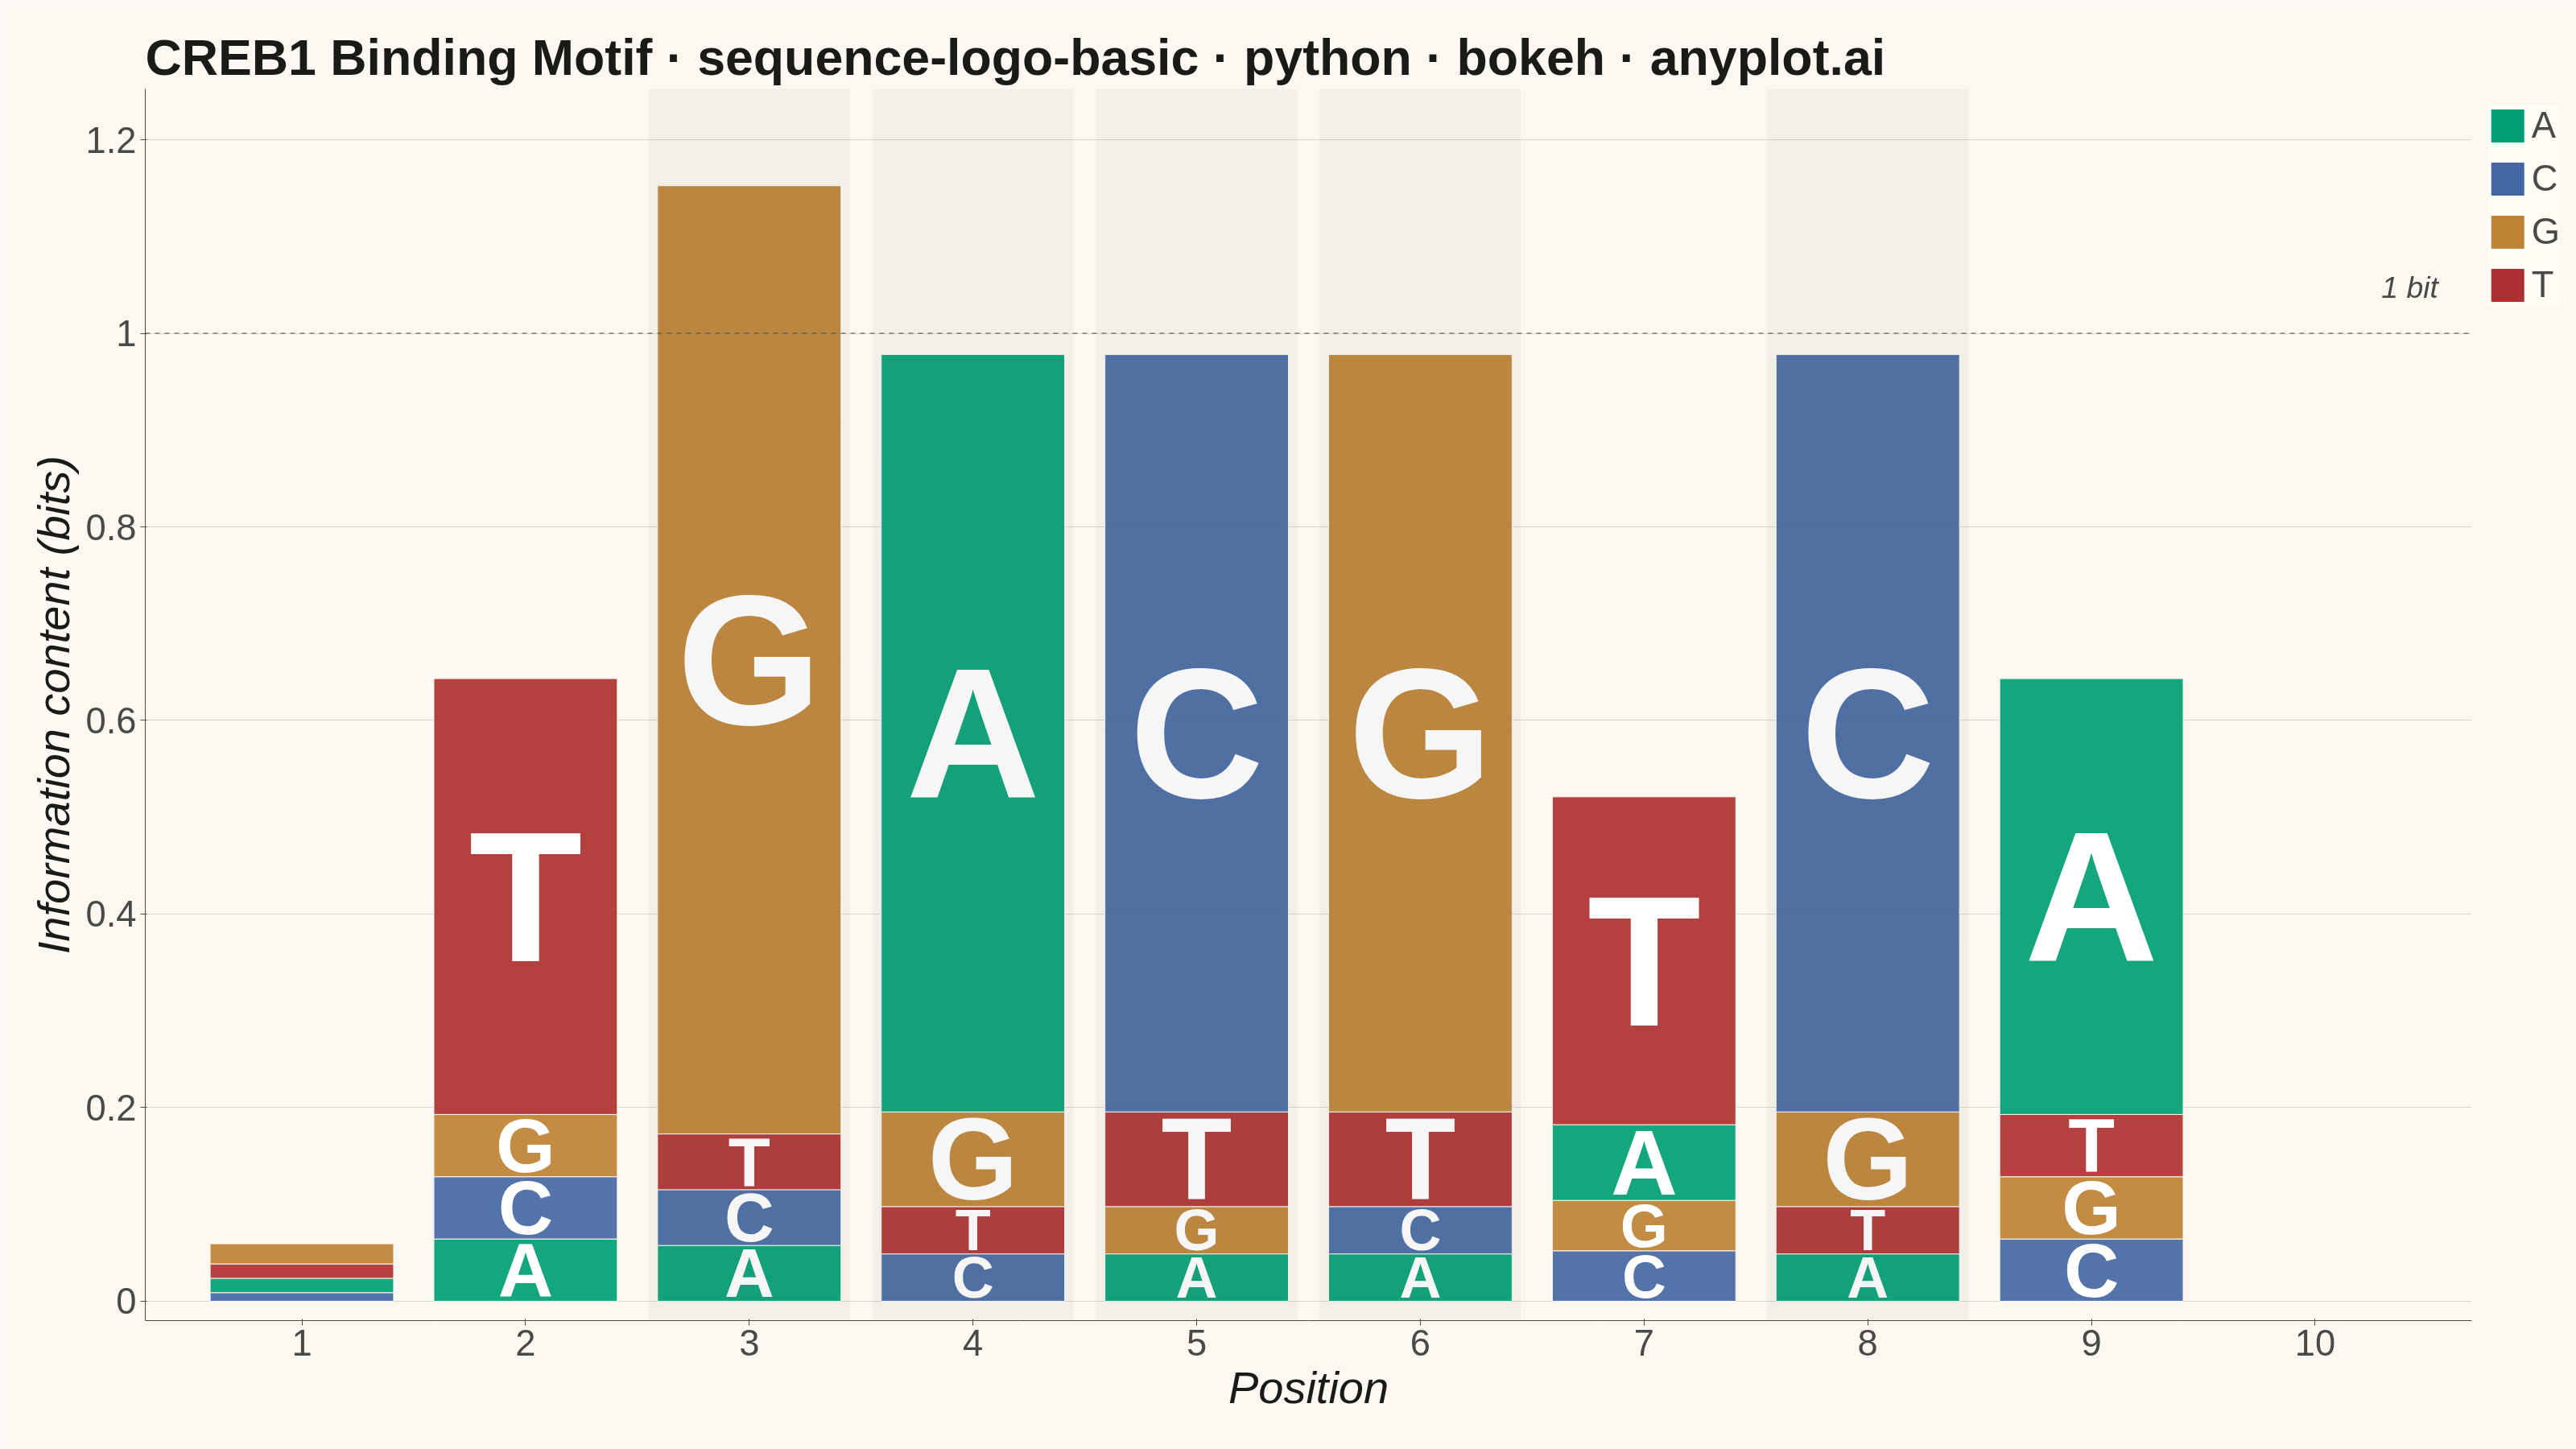
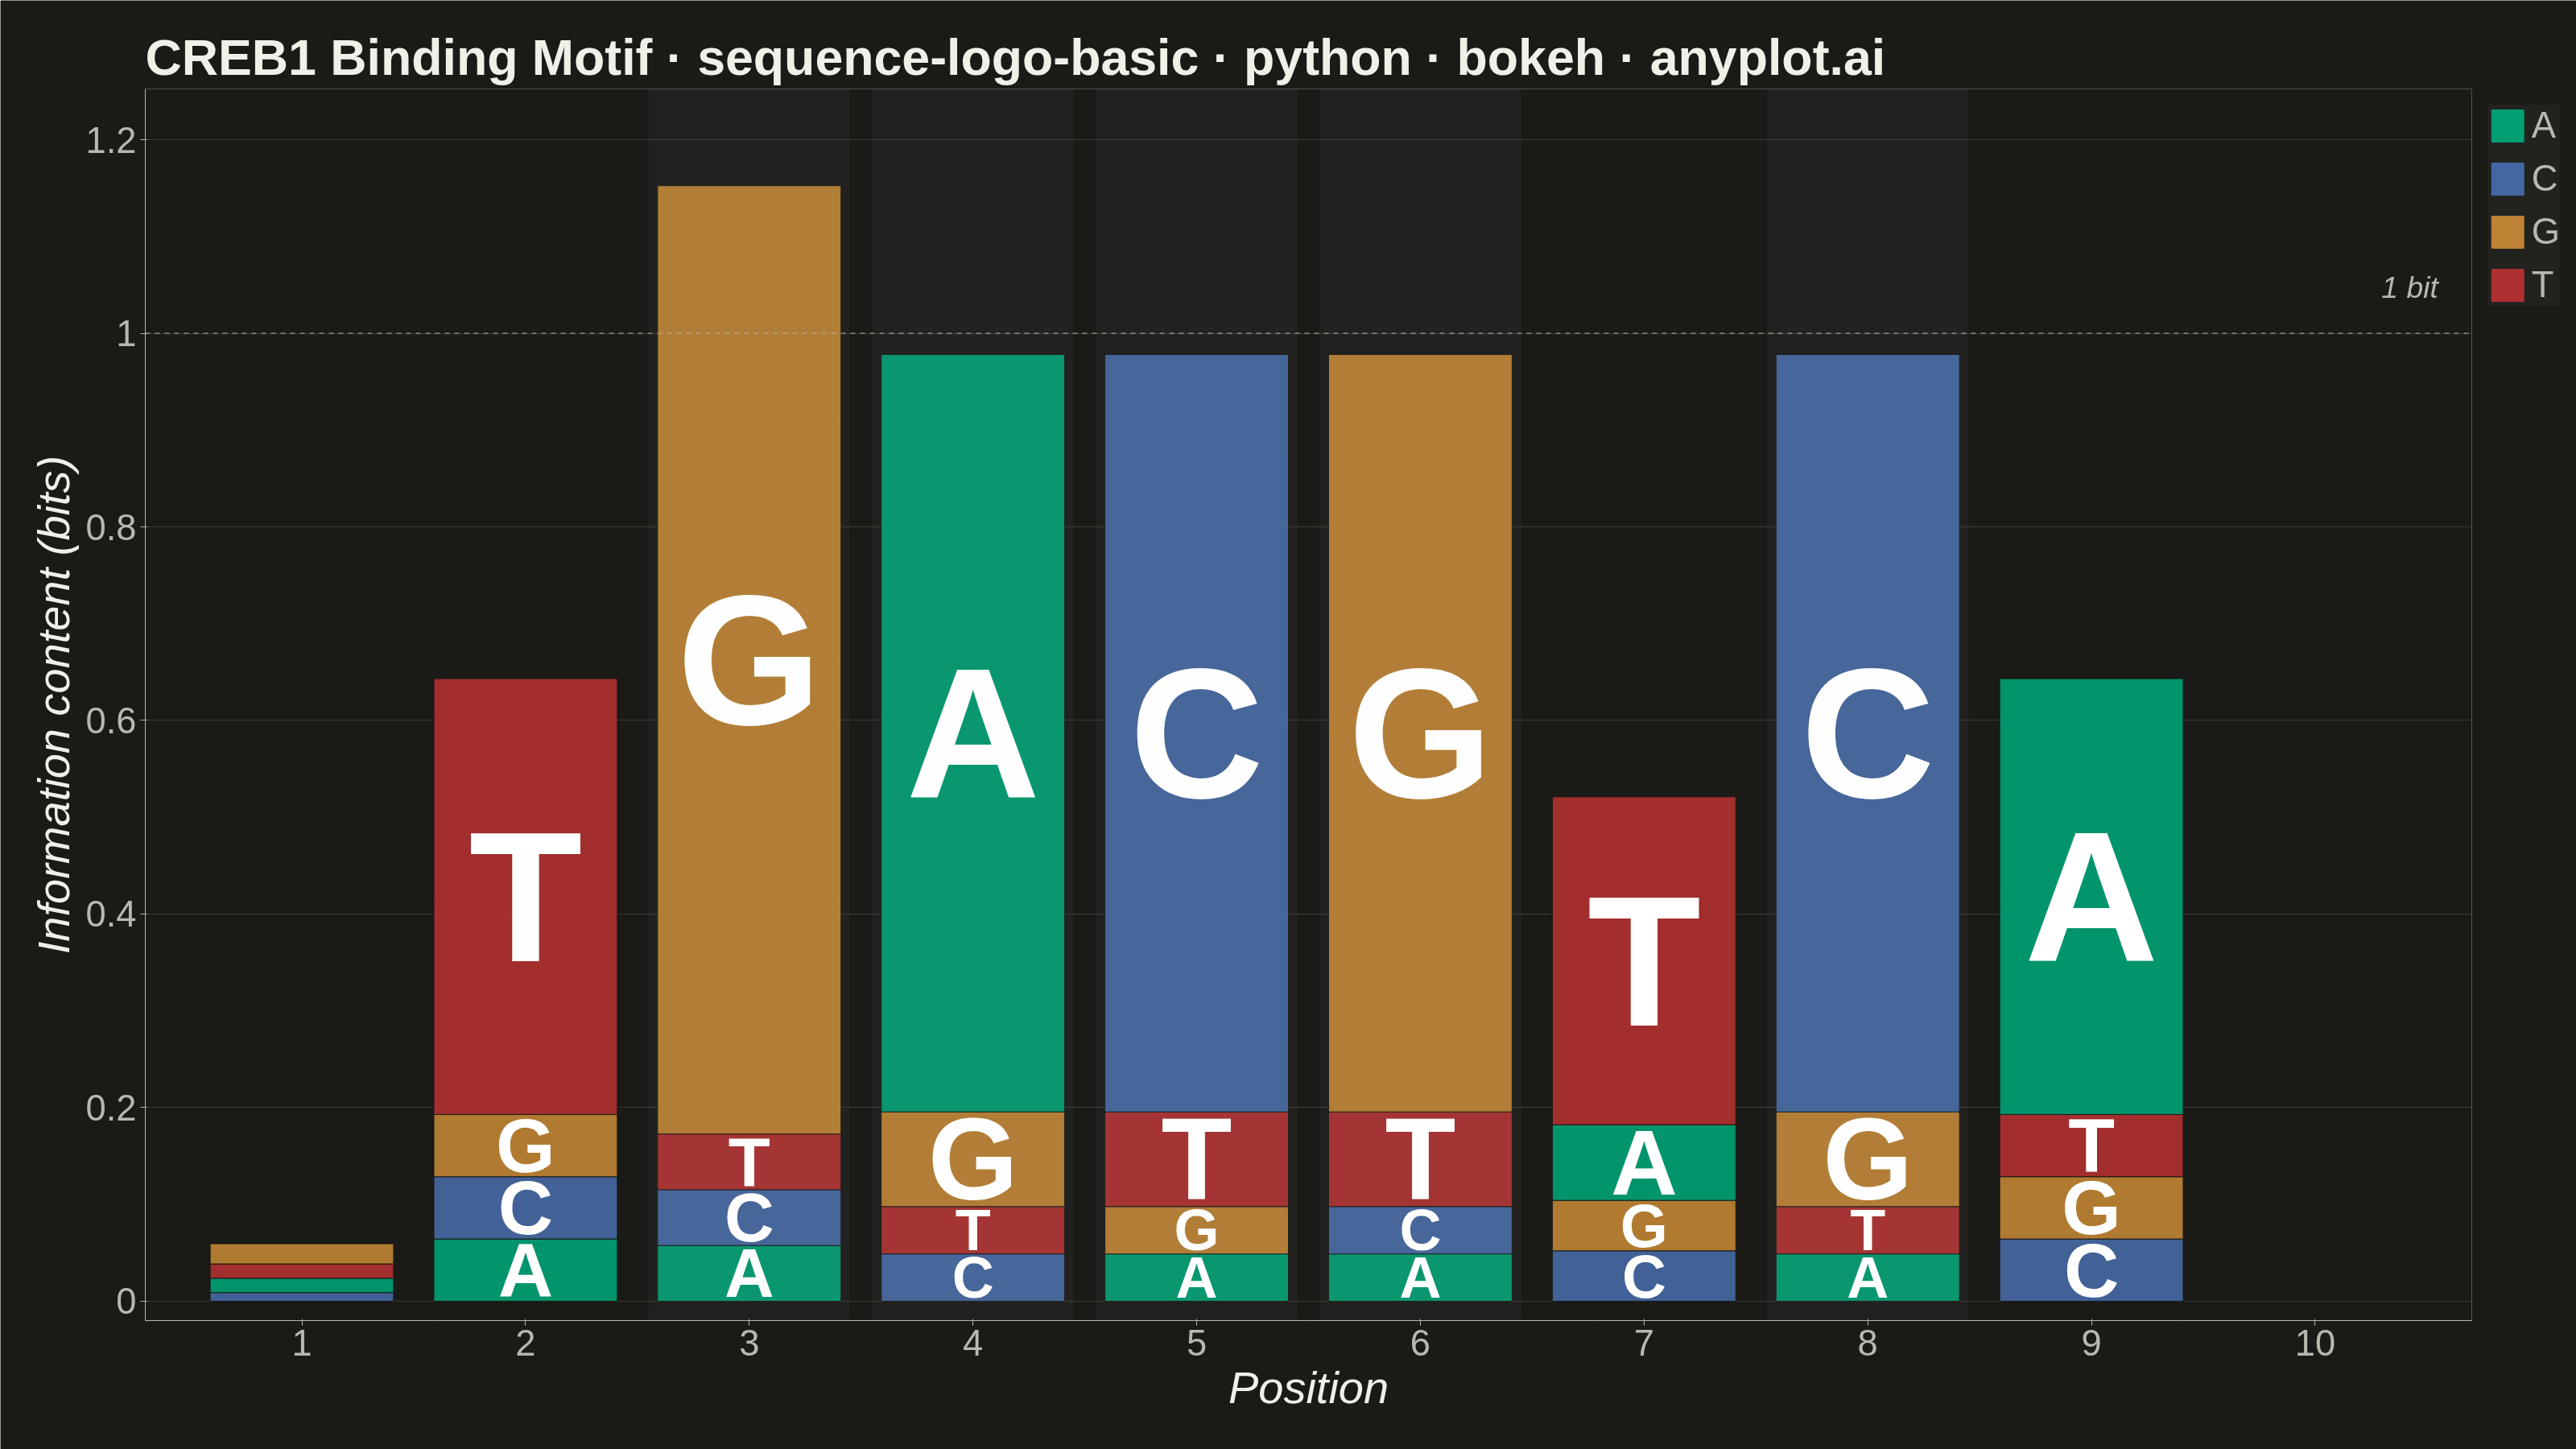
A sequence logo visualizes the consensus of multiple aligned DNA, RNA, or protein sequences. At each position, letters are stacked vertically with height proportional to information content (measured in bits), and individual letter heights within the stack reflect their relative frequency. This is the standard visualization for identifying conserved positions in transcription factor binding sites, splice sites, and protein domains.
""" anyplot.ai
sequence-logo-basic: Sequence Logo for Motif Visualization
Library: bokeh 3.9.0 | Python 3.13.13
Quality: 88/100 | Updated: 2026-06-02
"""

import sys


# Script is named bokeh.py; move its directory to end of path so the
# real bokeh package in site-packages is found first.
if sys.path and sys.path[0] != "":
    sys.path.append(sys.path.pop(0))

import os
import time
from pathlib import Path

import numpy as np
from bokeh.io import output_file, save
from bokeh.models import BoxAnnotation, ColumnDataSource, HoverTool, Label, Legend, LegendItem, Range1d, Span
from bokeh.plotting import figure
from selenium import webdriver
from selenium.webdriver.chrome.options import Options


# Theme tokens
THEME = os.getenv("ANYPLOT_THEME", "light")
PAGE_BG = "#FAF8F1" if THEME == "light" else "#1A1A17"
ELEVATED_BG = "#FFFDF6" if THEME == "light" else "#242420"
INK = "#1A1A17" if THEME == "light" else "#F0EFE8"
INK_SOFT = "#4A4A44" if THEME == "light" else "#B8B7B0"

# DNA base colors — Imprint palette, semantic mapping (A=green, C=blue, G=ochre, T=red)
BASE_COLORS = {
    "A": "#009E73",  # Imprint green (brand)
    "C": "#4467A3",  # Imprint blue
    "G": "#BD8233",  # Imprint ochre
    "T": "#AE3030",  # Imprint matte red
}

# Data: CREB1 transcription factor binding site motif (10 positions)
positions = list(range(1, 11))
bases = ["A", "C", "G", "T"]

frequencies = np.array(
    [
        [0.25, 0.15, 0.35, 0.25],  # Pos 1: weak preference
        [0.10, 0.10, 0.10, 0.70],  # Pos 2: strong T
        [0.05, 0.05, 0.85, 0.05],  # Pos 3: strong G
        [0.80, 0.05, 0.10, 0.05],  # Pos 4: strong A
        [0.05, 0.80, 0.05, 0.10],  # Pos 5: strong C
        [0.05, 0.05, 0.80, 0.10],  # Pos 6: strong G
        [0.15, 0.10, 0.10, 0.65],  # Pos 7: strong T
        [0.05, 0.80, 0.10, 0.05],  # Pos 8: strong C
        [0.70, 0.10, 0.10, 0.10],  # Pos 9: strong A
        [0.30, 0.20, 0.25, 0.25],  # Pos 10: weak preference
    ]
)

# Information content per position: IC = log2(4) - Shannon_entropy
max_bits = np.log2(len(bases))
entropy = np.array([-np.sum(f * np.log2(np.where(f > 0, f, 1))) for f in frequencies])
information_content = max_bits - entropy

# Build glyph data for colored rectangles and letter overlays
rect_x, rect_y, rect_w, rect_h, rect_color = [], [], [], [], []
rect_base, rect_freq, rect_ic, rect_pos = [], [], [], []
text_x, text_y, text_letter, text_size = [], [], [], []

max_ic = float(np.max(information_content))
y_top = max_ic + 0.10

# Canvas: 3200×1800, borders: top=110, bottom=160 → effective plot height ≈ 1530 px
PLOT_PX_HEIGHT = 1530.0
PX_PER_UNIT = PLOT_PX_HEIGHT / y_top
# CSS 1pt ≈ 1.333 px; cap-height ≈ 70% of em; fill_factor=0.85 for visual fit
PT_SCALE = PX_PER_UNIT / (1.333 * 0.70)
# Show letter glyphs only for rectangle heights large enough to be legible
MIN_RECT_HEIGHT = 0.005
MIN_TEXT_HEIGHT = 0.04
COLUMN_WIDTH = 0.82
# Width-based cap: letters must not overflow column boundaries
# X inner width: 3200 - 180(left) - 80(right) = 2940 px; x range = 10.7 - 0.3 = 10.4 units
X_INNER_PX = 3200 - 180 - 80
X_DATA_RANGE = 10.7 - 0.3
X_PX_PER_UNIT = X_INNER_PX / X_DATA_RANGE
WIDTH_BASED_PT = int(COLUMN_WIDTH * X_PX_PER_UNIT / 1.333)

for i, pos in enumerate(positions):
    ic = information_content[i]
    freqs = frequencies[i]
    # Ascending sort: least frequent letter at bottom of stack
    sorted_indices = np.argsort(freqs)
    y_bottom = 0.0

    for idx in sorted_indices:
        letter = bases[idx]
        height = freqs[idx] * ic
        if height < MIN_RECT_HEIGHT:
            y_bottom += height
            continue

        center_y = y_bottom + height / 2

        rect_x.append(pos)
        rect_y.append(center_y)
        rect_w.append(COLUMN_WIDTH)
        rect_h.append(height)
        rect_color.append(BASE_COLORS[letter])
        rect_base.append(letter)
        rect_freq.append(f"{freqs[idx]:.0%}")
        rect_ic.append(f"{height:.3f}")
        rect_pos.append(str(pos))

        # Only overlay letter text when the bar is tall enough to read
        if height >= MIN_TEXT_HEIGHT:
            text_x.append(pos)
            text_y.append(center_y)
            text_letter.append(letter)
            font_pt = max(14, min(int(height * PT_SCALE * 0.85), WIDTH_BASED_PT))
            text_size.append(f"{font_pt}pt")

        y_bottom += height

# Title — scale fontsize down for 71-char title (floor 34pt per bokeh prompt)
title_text = "CREB1 Binding Motif · sequence-logo-basic · python · bokeh · anyplot.ai"
title_n = len(title_text)
title_fontsize = f"{max(34, round(50 * 67 / title_n))}pt"

# Plot
p = figure(
    width=3200,
    height=1800,
    title=title_text,
    x_axis_label="Position",
    y_axis_label="Information content (bits)",
    toolbar_location=None,
    x_range=Range1d(0.3, 10.7),
    y_range=Range1d(-0.02, y_top),
    min_border_bottom=160,
    min_border_left=180,
    min_border_top=110,
    min_border_right=80,
)

# Colored rectangles — the primary visual element of the sequence logo
rect_source = ColumnDataSource(
    data={
        "x": rect_x,
        "y": rect_y,
        "width": rect_w,
        "height": rect_h,
        "color": rect_color,
        "base": rect_base,
        "freq": rect_freq,
        "ic": rect_ic,
        "pos": rect_pos,
    }
)
rects = p.rect(
    x="x",
    y="y",
    width="width",
    height="height",
    source=rect_source,
    fill_color="color",
    fill_alpha=0.92,
    line_color=PAGE_BG,
    line_width=1.0,
)

# HoverTool — interactive tooltips for the HTML artifact
hover_tool = HoverTool(
    renderers=[rects],
    tooltips=[("Position", "@pos"), ("Base", "@base"), ("Frequency", "@freq"), ("IC contribution", "@ic bits")],
)
p.add_tools(hover_tool)

# White letter glyphs centered on each visible rectangle
text_source = ColumnDataSource(data={"x": text_x, "y": text_y, "text": text_letter, "size": text_size})
p.text(
    x="x",
    y="y",
    text="text",
    source=text_source,
    text_color="white",
    text_font_size="size",
    text_font_style="bold",
    text_align="center",
    text_baseline="middle",
)

# Legend — off-screen dummy glyphs map each base to its color
legend_items = []
for base in bases:
    src = ColumnDataSource(data={"x": [-9999], "y": [-9999]})
    r = p.rect(
        x="x", y="y", width=0.01, height=0.01, source=src, fill_color=BASE_COLORS[base], line_color=BASE_COLORS[base]
    )
    legend_items.append(LegendItem(label=base, renderers=[r]))

legend = Legend(
    items=legend_items,
    location="top_right",
    label_text_font_size="34pt",
    label_text_color=INK_SOFT,
    glyph_width=50,
    glyph_height=50,
    spacing=14,
    padding=20,
    margin=20,
    background_fill_color=ELEVATED_BG,
    background_fill_alpha=0.9,
    border_line_color=None,
)
p.add_layout(legend, "right")

# Theme-adaptive chrome
p.background_fill_color = PAGE_BG
p.border_fill_color = PAGE_BG
p.outline_line_color = None

p.title.text_font_size = title_fontsize
p.title.text_font_style = "bold"
p.title.text_color = INK

p.xaxis.axis_label_text_font_size = "42pt"
p.yaxis.axis_label_text_font_size = "42pt"
p.xaxis.axis_label_text_color = INK
p.yaxis.axis_label_text_color = INK

p.xaxis.major_label_text_font_size = "34pt"
p.yaxis.major_label_text_font_size = "34pt"
p.xaxis.major_label_text_color = INK_SOFT
p.yaxis.major_label_text_color = INK_SOFT

p.xaxis.axis_line_color = INK_SOFT
p.yaxis.axis_line_color = INK_SOFT
p.xaxis.major_tick_line_color = INK_SOFT
p.yaxis.major_tick_line_color = INK_SOFT
p.xaxis.minor_tick_line_color = None
p.yaxis.minor_tick_line_color = None

p.xaxis.ticker = positions
p.xgrid.grid_line_color = None
p.ygrid.grid_line_color = INK
p.ygrid.grid_line_alpha = 0.15

# Reference line at IC=1 bit — helps readers interpret the conservation scale
ref_line = Span(location=1.0, dimension="width", line_color=INK_SOFT, line_alpha=0.5, line_width=2, line_dash="dashed")
p.add_layout(ref_line)
ref_label = Label(
    x=10.55,
    y=1.03,
    text="1 bit",
    text_color=INK_SOFT,
    text_font_size="28pt",
    text_font_style="italic",
    text_align="right",
)
p.add_layout(ref_label)

# Subtle highlight for the conserved core positions (IC ≥ 0.9)
for i, pos in enumerate(positions):
    if information_content[i] >= 0.9:
        p.add_layout(BoxAnnotation(left=pos - 0.45, right=pos + 0.45, fill_color=INK, fill_alpha=0.04, line_color=None))

# Save interactive HTML (catalog artifact)
output_file(f"plot-{THEME}.html")
save(p)

# Screenshot with headless Chrome — Selenium 4 auto-resolves driver
W, H = 3200, 1800
opts = Options()
for arg in (
    "--headless=new",
    "--no-sandbox",
    "--disable-dev-shm-usage",
    "--disable-gpu",
    f"--window-size={W},{H}",
    "--hide-scrollbars",
):
    opts.add_argument(arg)
driver = webdriver.Chrome(options=opts)
driver.set_window_size(W, H)
driver.get(f"file://{Path(f'plot-{THEME}.html').resolve()}")
time.sleep(3)

# Headless Chrome reserves ~139 px for internal UI even with no visible toolbar.
# Measure the actual viewport height and compensate so the rendered figure
# fills exactly W × H pixels before taking the screenshot.
inner_h = driver.execute_script("return window.innerHeight")
if inner_h != H:
    driver.set_window_size(W, H + (H - inner_h))
    time.sleep(1)

driver.save_screenshot(f"plot-{THEME}.png")
driver.quit()
Runnable source as JSON, for any HTTP client: https://api.anyplot.ai/specs/sequence-logo-basic/bokeh/code. Any spec id and library id listed in llms-full.txt fit the same URL shape; every URL below is complete and callable.
{
  "spec_id": "sequence-logo-basic",
  "language": "python",
  "library": "bokeh",
  "page": "https://anyplot.ai/sequence-logo-basic/python/bokeh",
  "hub": "https://anyplot.ai/sequence-logo-basic",
  "code_json": "https://api.anyplot.ai/specs/sequence-logo-basic/bokeh/code",
  "spec_json": "https://api.anyplot.ai/specs/sequence-logo-basic",
  "render_light_png": "https://storage.googleapis.com/anyplot-images/plots/sequence-logo-basic/python/bokeh/plot-light.png",
  "render_dark_png": "https://storage.googleapis.com/anyplot-images/plots/sequence-logo-basic/python/bokeh/plot-dark.png",
  "interactive_light_html": "https://storage.googleapis.com/anyplot-images/plots/sequence-logo-basic/python/bokeh/plot-light.html",
  "interactive_dark_html": "https://storage.googleapis.com/anyplot-images/plots/sequence-logo-basic/python/bokeh/plot-dark.html",
  "quality_score": 88.0,
  "license": "MIT",
  "guide": "https://anyplot.ai/llms.txt"
}
Part of Sequence Logo for Motif Visualization on anyplot.ai.