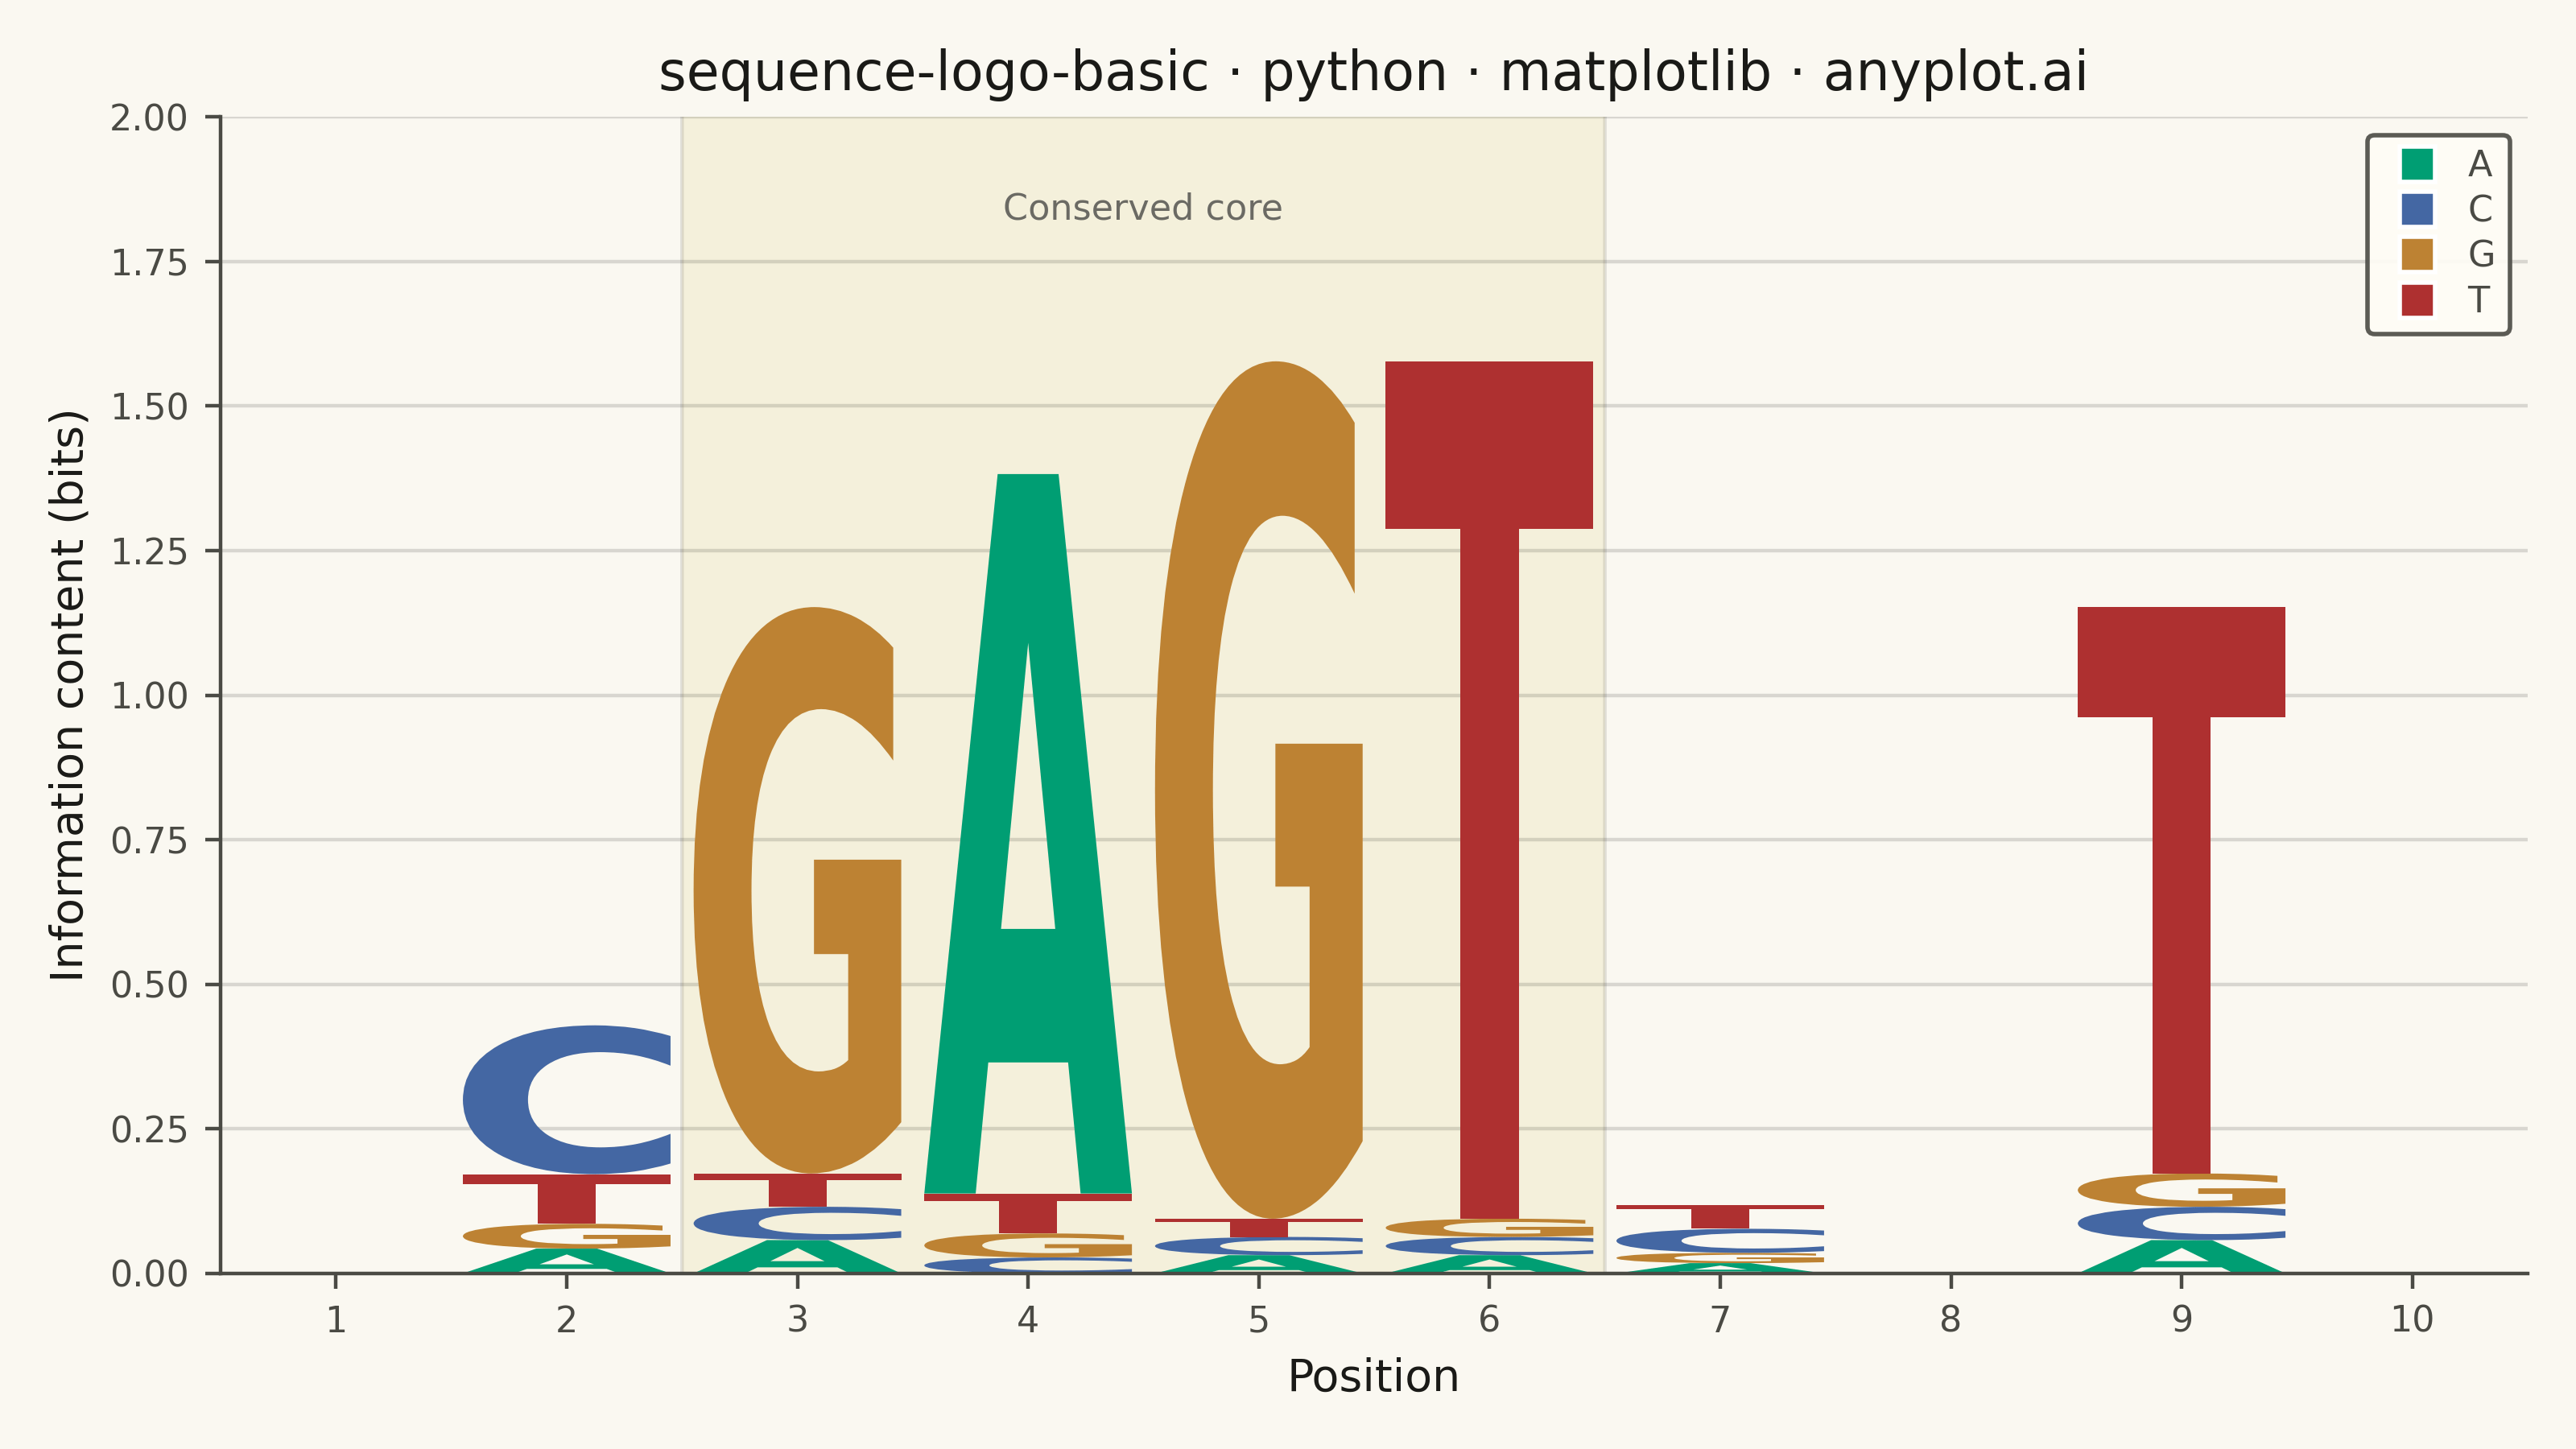
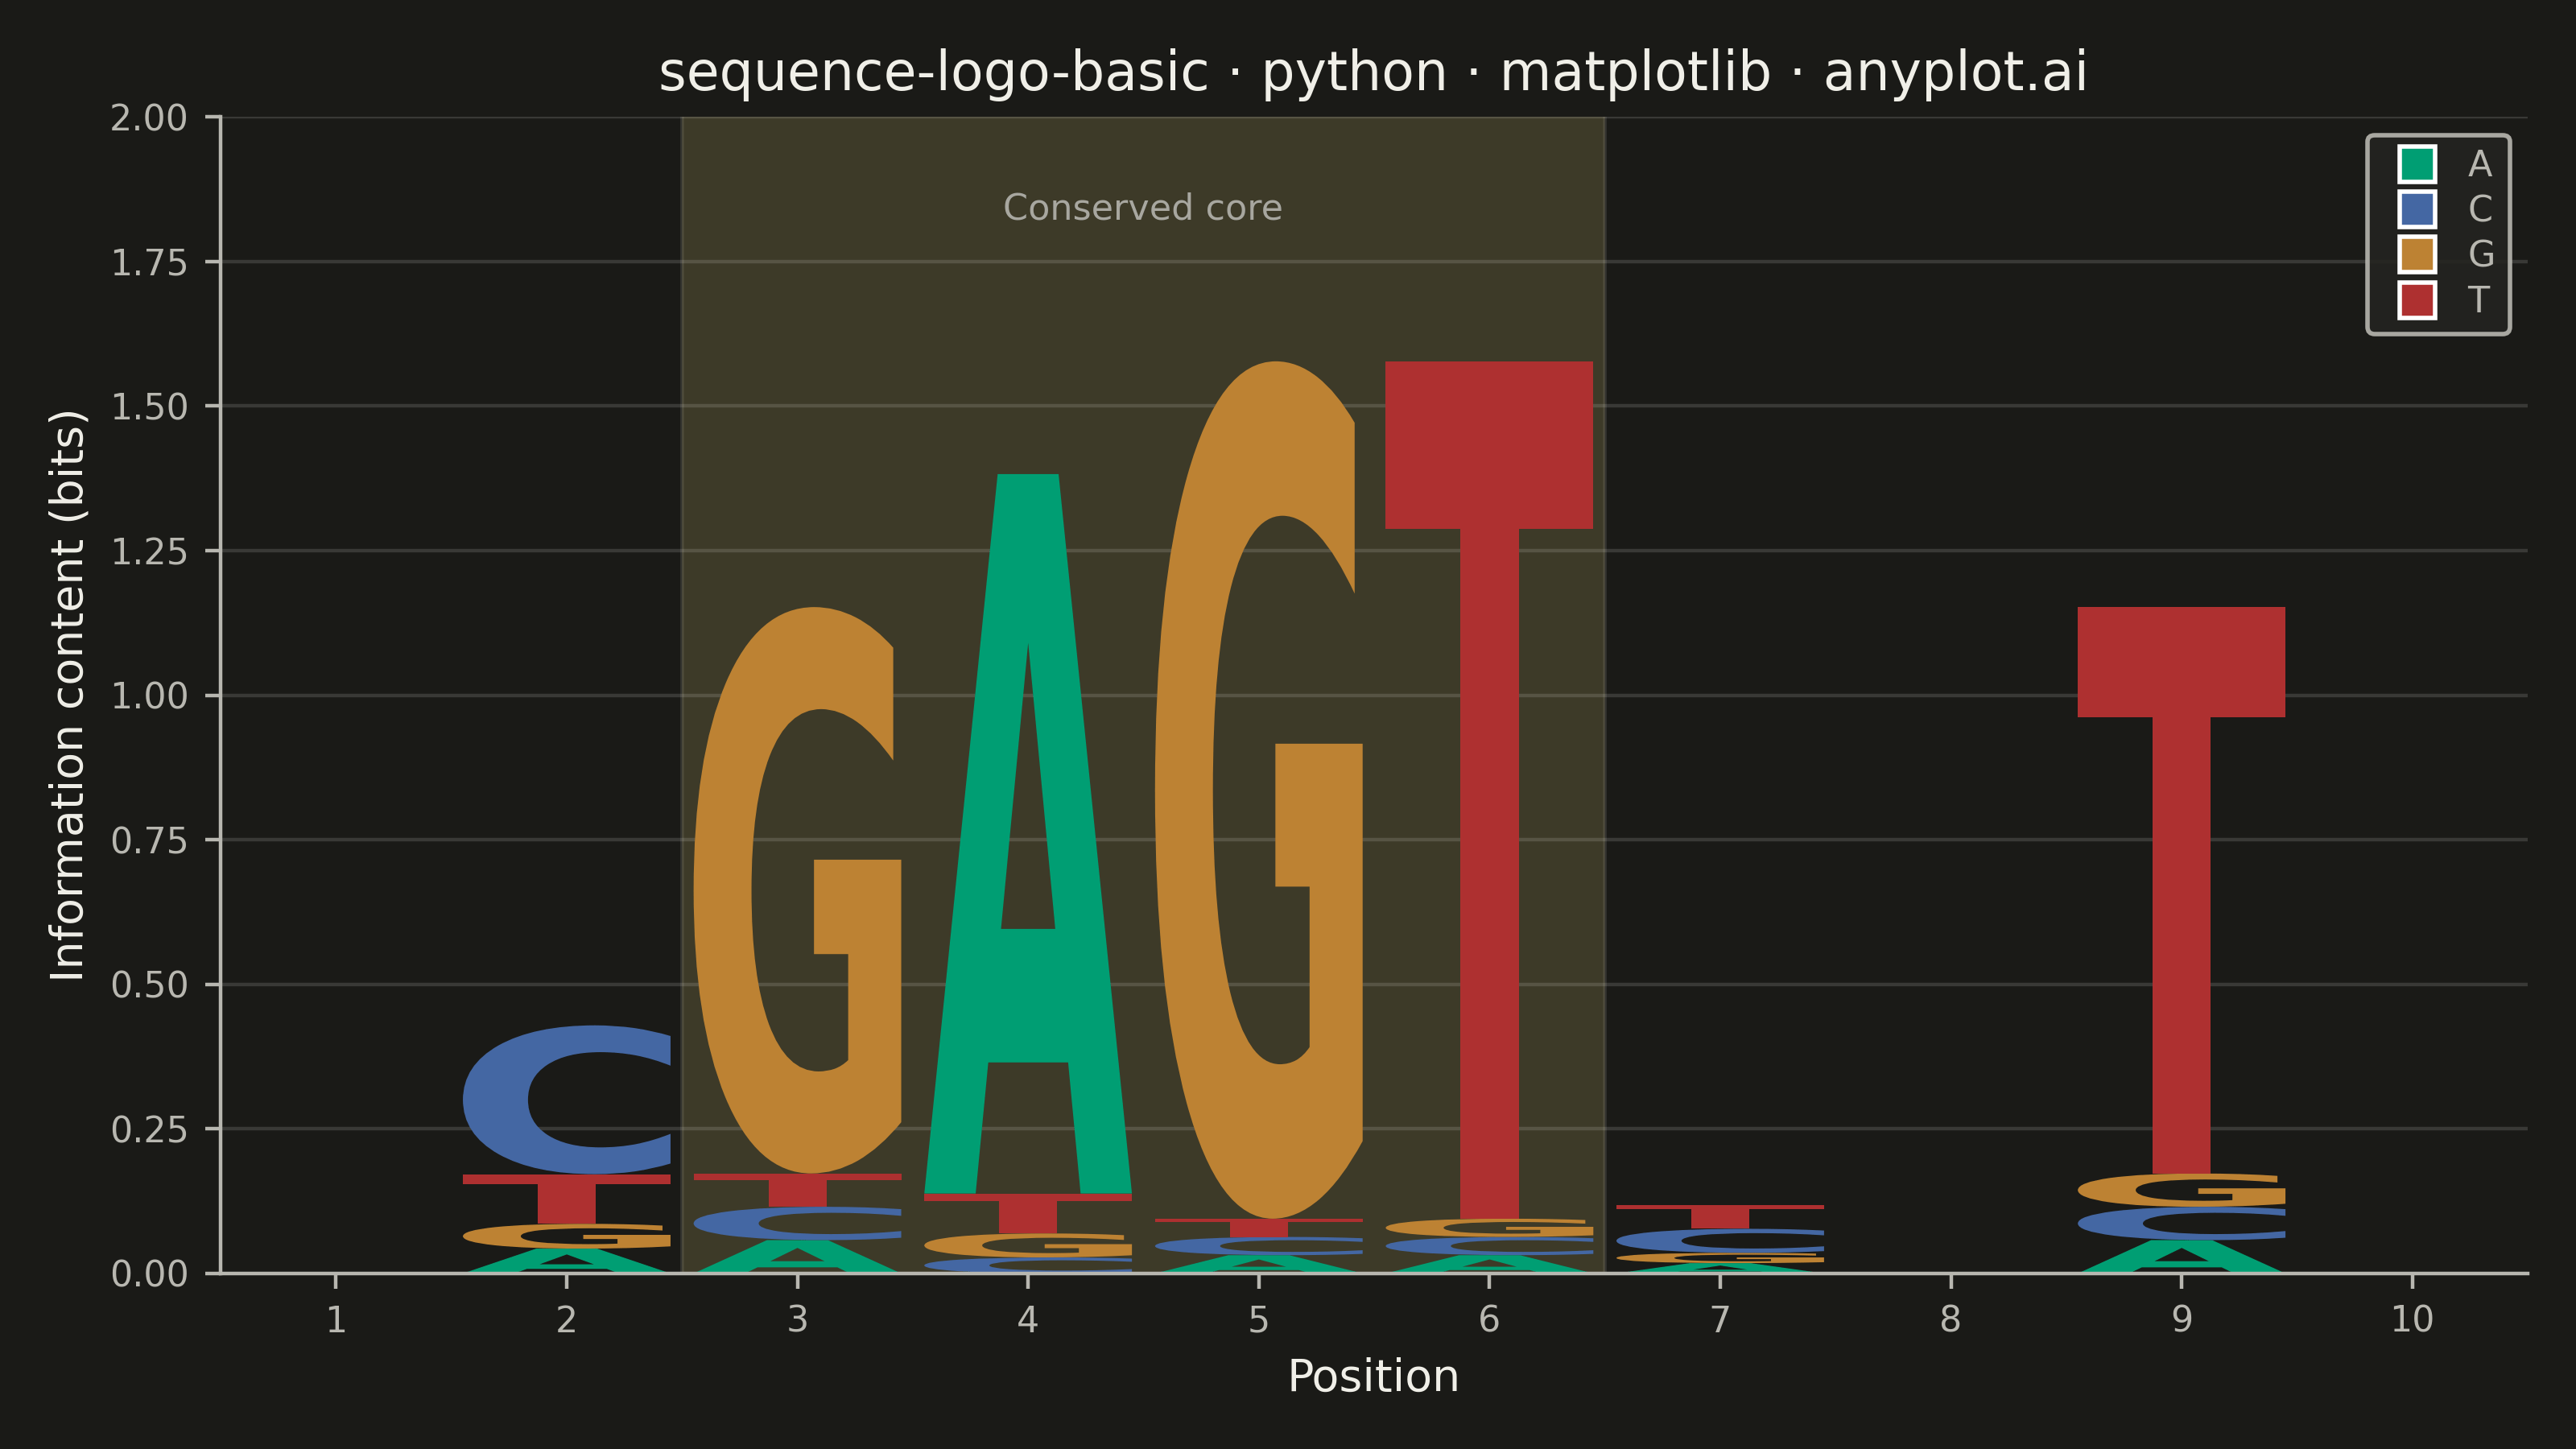
A sequence logo visualizes the consensus of multiple aligned DNA, RNA, or protein sequences. At each position, letters are stacked vertically with height proportional to information content (measured in bits), and individual letter heights within the stack reflect their relative frequency. This is the standard visualization for identifying conserved positions in transcription factor binding sites, splice sites, and protein domains.
""" anyplot.ai
sequence-logo-basic: Sequence Logo for Motif Visualization
Library: matplotlib 3.10.9 | Python 3.13.13
Quality: 91/100 | Updated: 2026-06-02
"""

import os

import matplotlib.pyplot as plt
import matplotlib.transforms as transforms
import numpy as np
from matplotlib.font_manager import FontProperties
from matplotlib.lines import Line2D
from matplotlib.patches import FancyBboxPatch, PathPatch
from matplotlib.textpath import TextPath


# Theme tokens — Imprint palette, theme-adaptive chrome
THEME = os.getenv("ANYPLOT_THEME", "light")
PAGE_BG = "#FAF8F1" if THEME == "light" else "#1A1A17"
ELEVATED_BG = "#FFFDF6" if THEME == "light" else "#242420"
INK = "#1A1A17" if THEME == "light" else "#F0EFE8"
INK_SOFT = "#4A4A44" if THEME == "light" else "#B8B7B0"
INK_MUTED = "#6B6A63" if THEME == "light" else "#A8A79F"
ANYPLOT_AMBER = "#DDCC77"  # warning / caution anchor — used for conserved core highlight

# DNA colors — semantic exception: standard ACGT associations map to Imprint palette
# A=green → #009E73, C=blue → #4467A3, G=orange/ochre → #BD8233, T=red → #AE3030
dna_colors = {"A": "#009E73", "C": "#4467A3", "G": "#BD8233", "T": "#AE3030"}

# Data — 10-position ETS-family DNA transcription factor binding site motif
position_freqs = [
    {"A": 0.25, "C": 0.25, "G": 0.25, "T": 0.25},
    {"A": 0.10, "C": 0.60, "G": 0.10, "T": 0.20},
    {"A": 0.05, "C": 0.05, "G": 0.85, "T": 0.05},
    {"A": 0.90, "C": 0.02, "G": 0.03, "T": 0.05},
    {"A": 0.02, "C": 0.02, "G": 0.94, "T": 0.02},
    {"A": 0.02, "C": 0.02, "G": 0.02, "T": 0.94},
    {"A": 0.15, "C": 0.35, "G": 0.15, "T": 0.35},
    {"A": 0.30, "C": 0.20, "G": 0.30, "T": 0.20},
    {"A": 0.05, "C": 0.05, "G": 0.05, "T": 0.85},
    {"A": 0.25, "C": 0.25, "G": 0.25, "T": 0.25},
]

letters = ["A", "C", "G", "T"]
n_positions = len(position_freqs)
max_bits = 2.0

# Compute information content per position (Shannon entropy method)
info_contents = []
for freqs in position_freqs:
    entropy = sum(-f * np.log2(f) for f in freqs.values() if f > 0)
    info_contents.append(max_bits - entropy)

# Plot
fig, ax = plt.subplots(figsize=(8, 4.5), dpi=400, facecolor=PAGE_BG)
ax.set_facecolor(PAGE_BG)
fp = FontProperties(family="DejaVu Sans", weight="bold")
bar_width = 0.9

# Highlight conserved core region (positions 3-6) using amber caution anchor
core_start, core_end = 3, 6
highlight = FancyBboxPatch(
    (core_start - 0.48, -0.02),
    core_end - core_start + 0.96,
    max_bits + 0.04,
    boxstyle="round,pad=0.02",
    facecolor=ANYPLOT_AMBER,
    edgecolor=INK_MUTED,
    alpha=0.18,
    linewidth=0.8,
    zorder=0,
)
ax.add_patch(highlight)

for pos_idx, freqs in enumerate(position_freqs):
    ic = info_contents[pos_idx]
    letter_heights = {lt: freqs[lt] * ic for lt in letters}
    sorted_letters = sorted(letters, key=lambda lt: letter_heights[lt])

    y_offset = 0.0
    x_start = pos_idx + 1 - bar_width / 2
    for letter in sorted_letters:
        h = letter_heights[letter]
        if h < 0.01:
            continue
        tp = TextPath((0, 0), letter, size=1, prop=fp)
        bbox = tp.get_extents()
        if bbox.width == 0 or bbox.height == 0:
            continue
        sx = bar_width / bbox.width
        sy = h / bbox.height
        t = transforms.Affine2D().translate(-bbox.x0, -bbox.y0).scale(sx, sy).translate(x_start, y_offset)
        patch = PathPatch(tp.transformed(t), facecolor=dna_colors[letter], edgecolor="none", linewidth=0, zorder=2)
        ax.add_patch(patch)
        y_offset += h

# Annotate conserved core region
ax.annotate(
    "Conserved core",
    xy=((core_start + core_end) / 2, max_bits * 0.92),
    fontsize=8,
    fontweight="medium",
    color=INK_MUTED,
    ha="center",
    va="center",
    zorder=3,
)

# Nucleotide color legend
legend_handles = [
    Line2D([0], [0], marker="s", color="w", markerfacecolor=dna_colors[lt], markersize=8, label=lt, linewidth=0)
    for lt in letters
]
leg = ax.legend(
    handles=legend_handles,
    loc="upper right",
    fontsize=8,
    framealpha=0.9,
    edgecolor=INK_SOFT,
    handletextpad=0.4,
    labelspacing=0.3,
)
if leg:
    leg.get_frame().set_facecolor(ELEVATED_BG)
    plt.setp(leg.get_texts(), color=INK_SOFT)

# Style
title = "sequence-logo-basic · python · matplotlib · anyplot.ai"
title_fontsize = max(8, round(12 * 67 / len(title))) if len(title) > 67 else 12
ax.set_xlim(0.5, n_positions + 0.5)
ax.set_ylim(0, max_bits)
ax.set_xticks(range(1, n_positions + 1))
ax.set_xticklabels(range(1, n_positions + 1))
ax.set_xlabel("Position", fontsize=10, color=INK)
ax.set_ylabel("Information content (bits)", fontsize=10, color=INK)
ax.set_title(title, fontsize=title_fontsize, fontweight="medium", color=INK)
ax.tick_params(axis="both", labelsize=8, colors=INK_SOFT, labelcolor=INK_SOFT)
ax.spines["top"].set_visible(False)
ax.spines["right"].set_visible(False)
for s in ("left", "bottom"):
    ax.spines[s].set_color(INK_SOFT)
ax.yaxis.grid(True, alpha=0.15, linewidth=0.8, color=INK, zorder=0)

# Save
plt.tight_layout()
plt.savefig(f"plot-{THEME}.png", dpi=400, facecolor=PAGE_BG)
Runnable source as JSON, for any HTTP client: https://api.anyplot.ai/specs/sequence-logo-basic/matplotlib/code. Any spec id and library id listed in llms-full.txt fit the same URL shape; every URL below is complete and callable.
{
  "spec_id": "sequence-logo-basic",
  "language": "python",
  "library": "matplotlib",
  "page": "https://anyplot.ai/sequence-logo-basic/python/matplotlib",
  "hub": "https://anyplot.ai/sequence-logo-basic",
  "code_json": "https://api.anyplot.ai/specs/sequence-logo-basic/matplotlib/code",
  "spec_json": "https://api.anyplot.ai/specs/sequence-logo-basic",
  "render_light_png": "https://storage.googleapis.com/anyplot-images/plots/sequence-logo-basic/python/matplotlib/plot-light.png",
  "render_dark_png": "https://storage.googleapis.com/anyplot-images/plots/sequence-logo-basic/python/matplotlib/plot-dark.png",
  "quality_score": 91.0,
  "license": "MIT",
  "guide": "https://anyplot.ai/llms.txt"
}
Part of Sequence Logo for Motif Visualization on anyplot.ai.