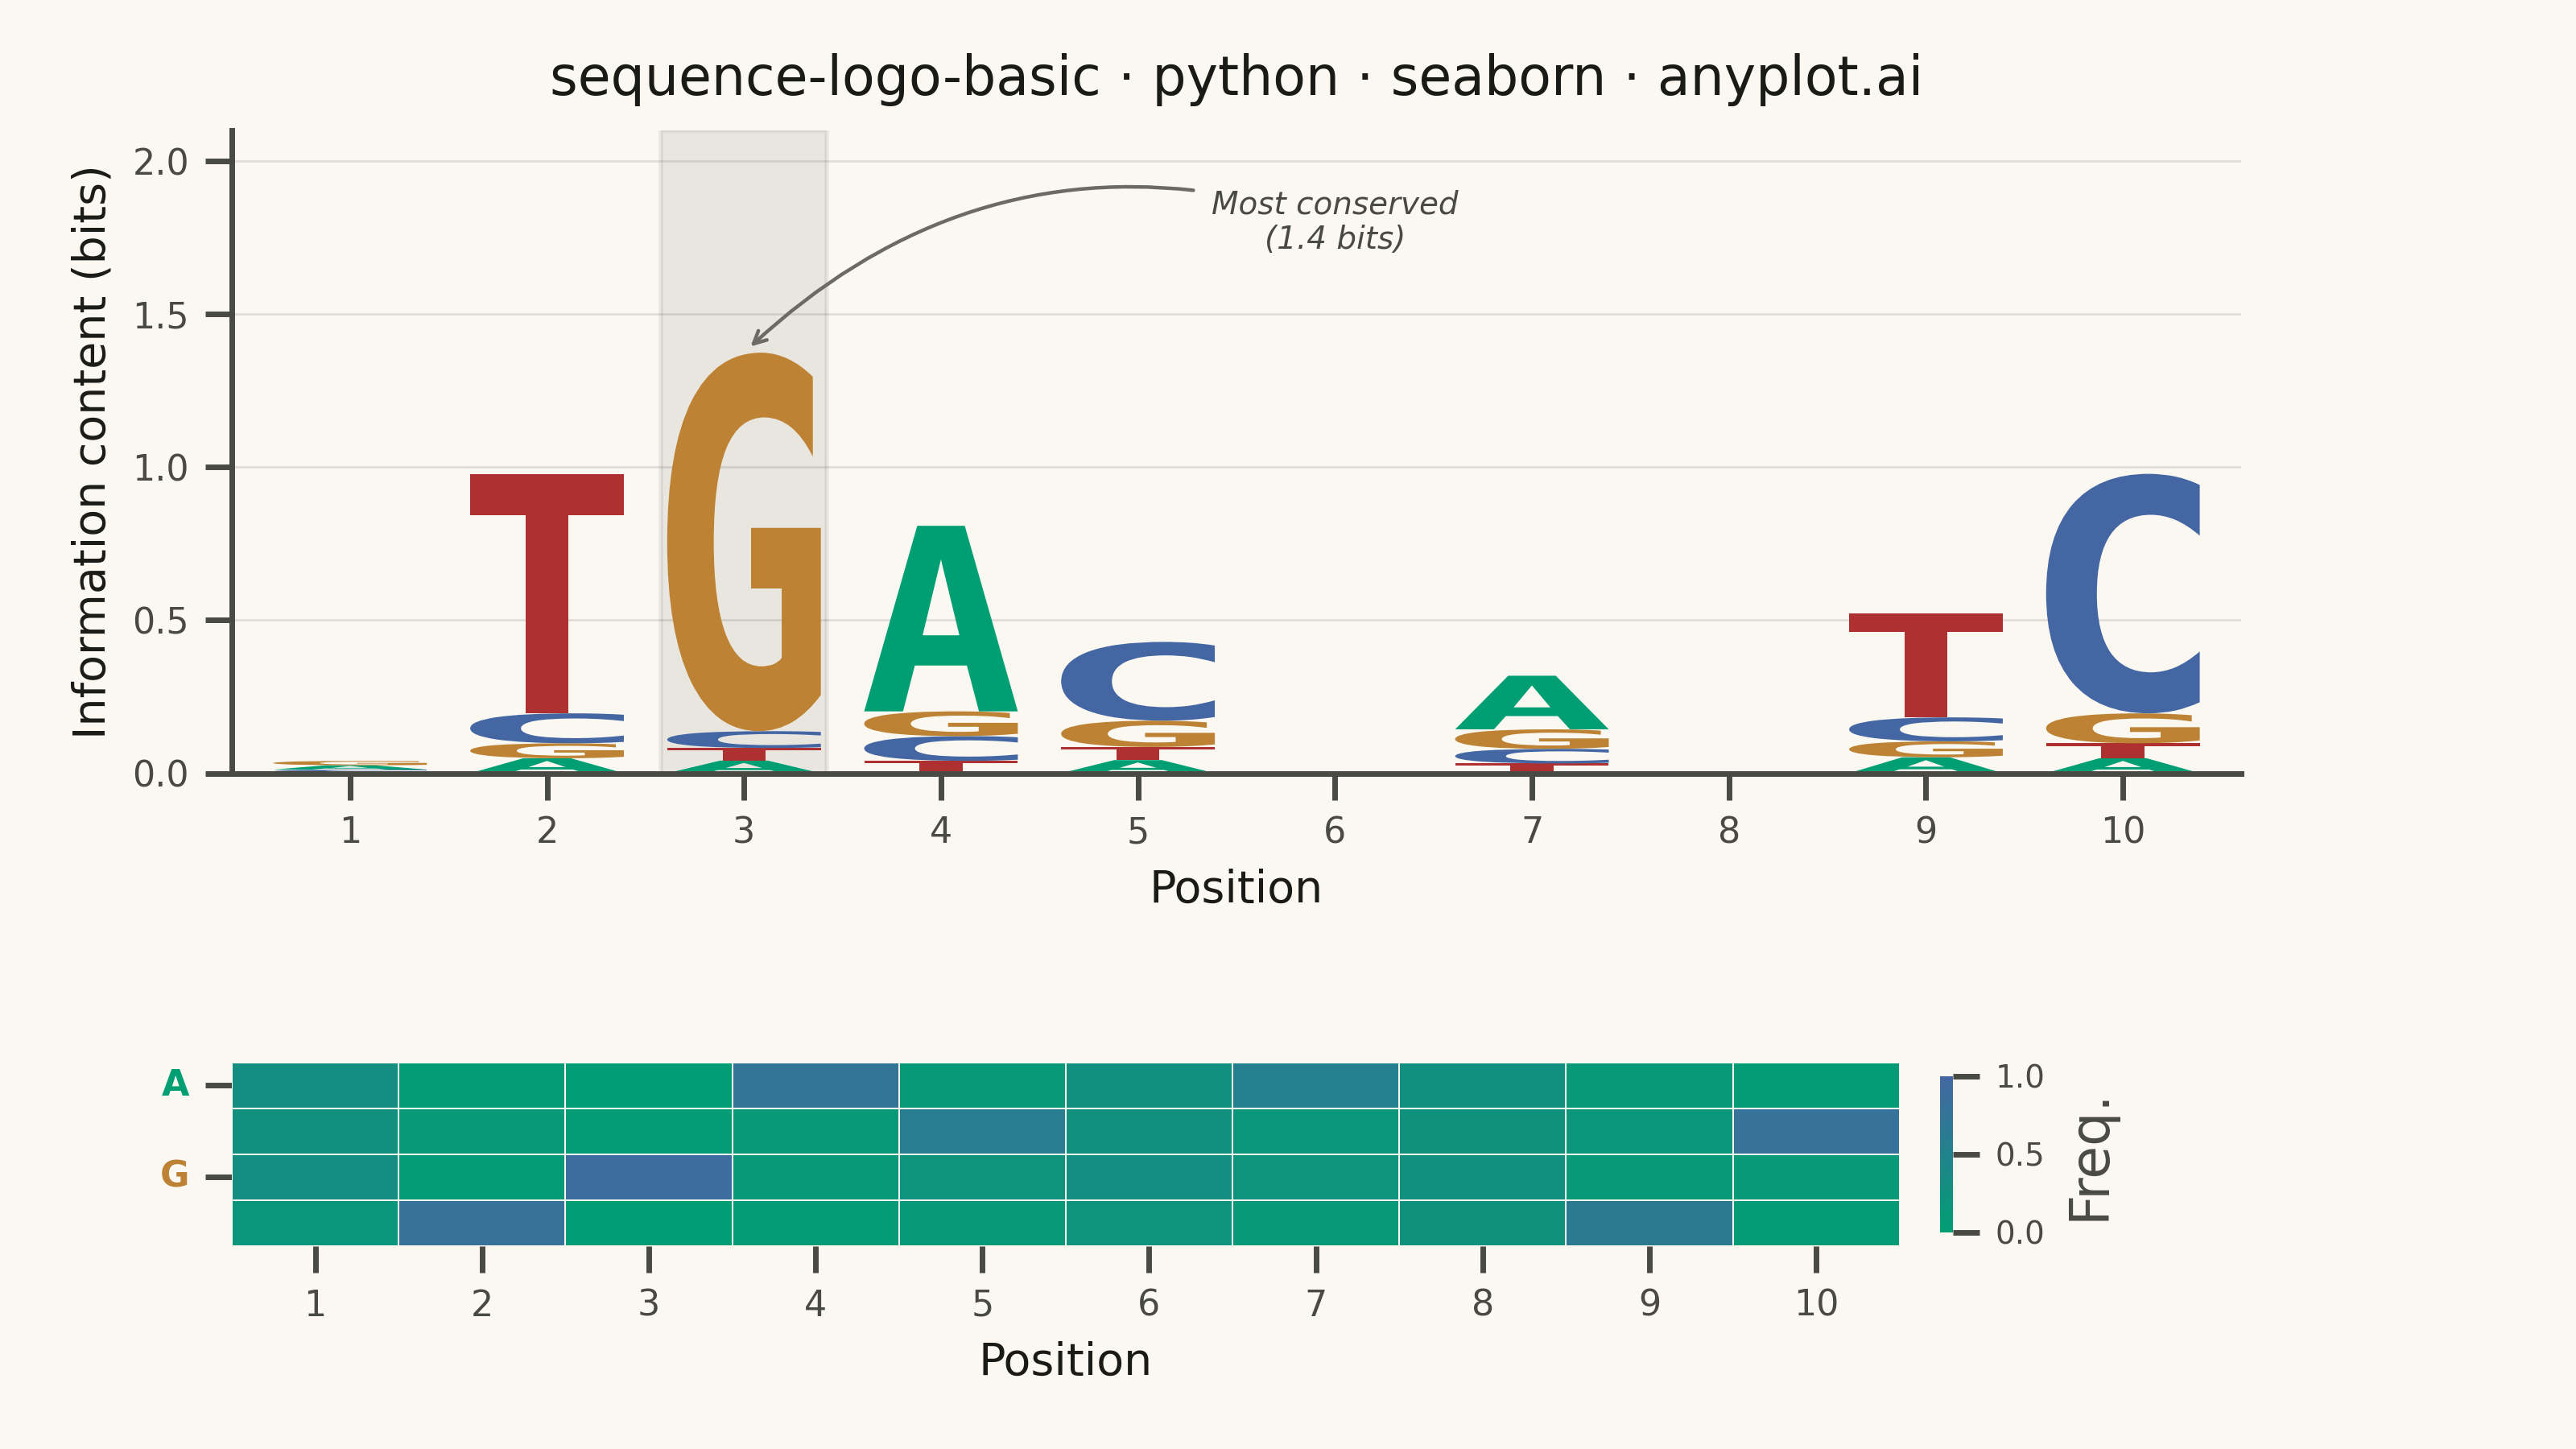
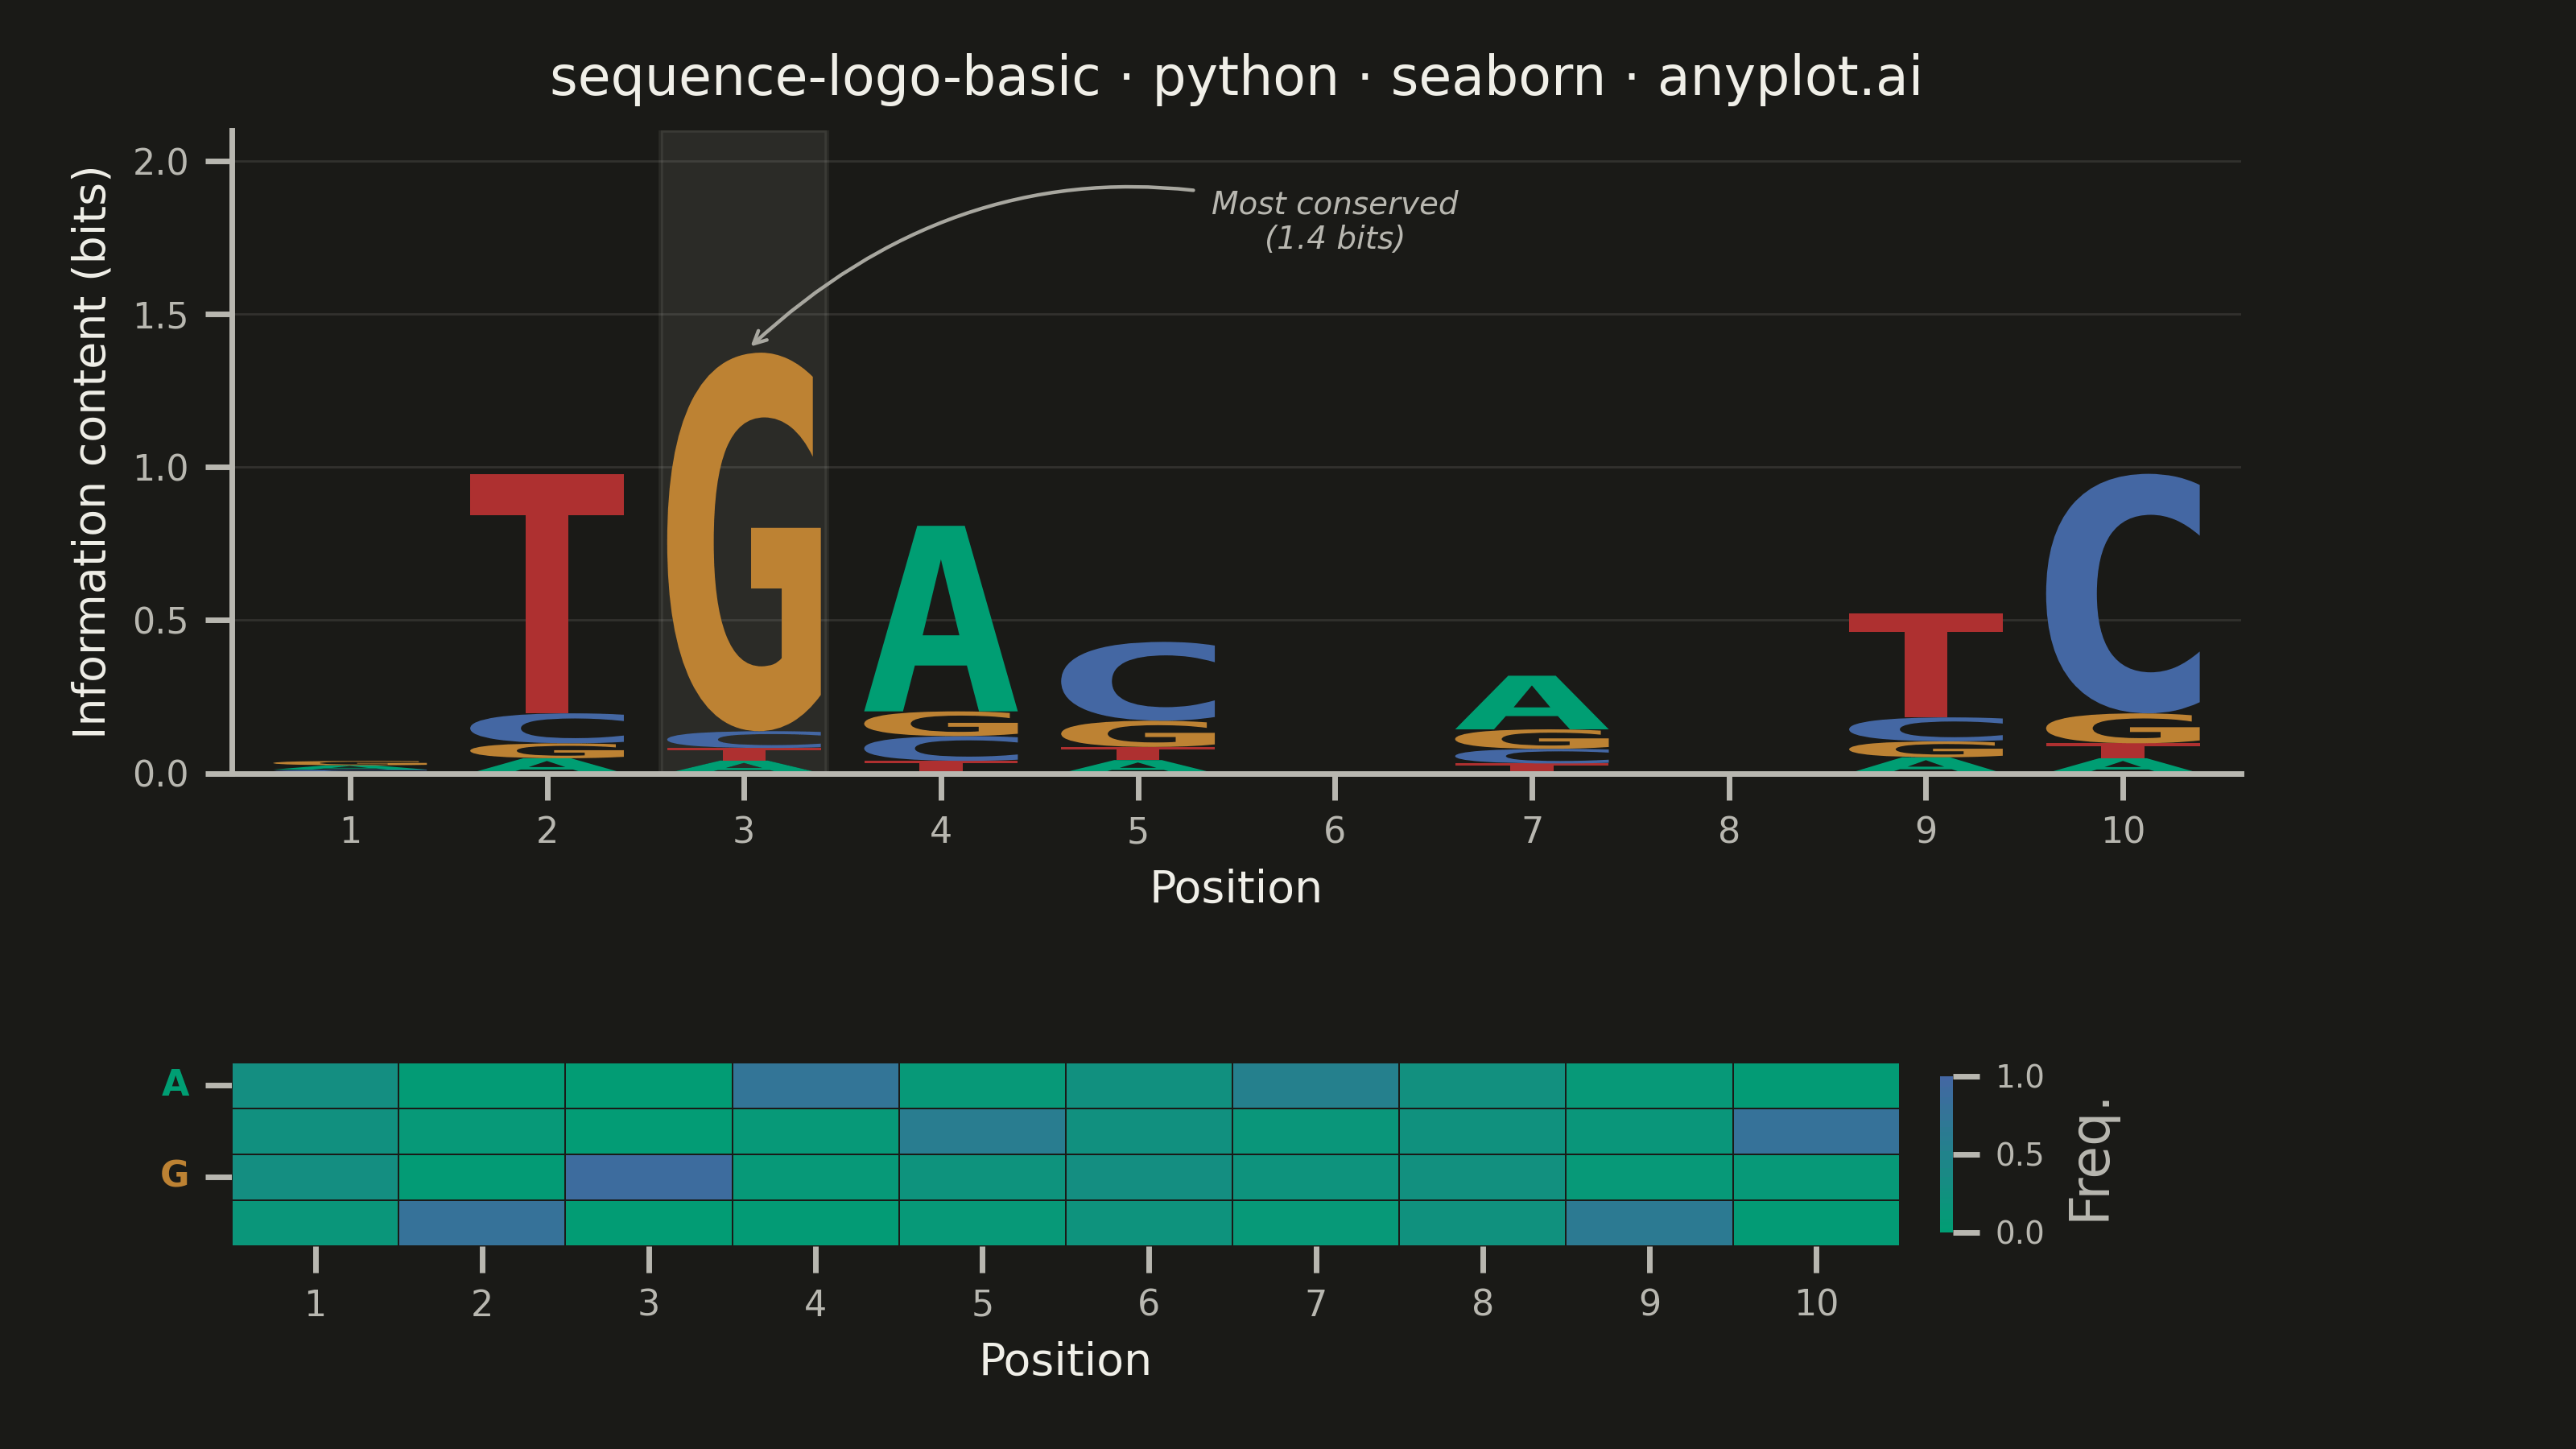
A sequence logo visualizes the consensus of multiple aligned DNA, RNA, or protein sequences. At each position, letters are stacked vertically with height proportional to information content (measured in bits), and individual letter heights within the stack reflect their relative frequency. This is the standard visualization for identifying conserved positions in transcription factor binding sites, splice sites, and protein domains.
""" anyplot.ai
sequence-logo-basic: Sequence Logo for Motif Visualization
Library: seaborn 0.13.2 | Python 3.13.13
Quality: 88/100 | Updated: 2026-06-02
"""

import os

import matplotlib.pyplot as plt
import matplotlib.transforms as mtransforms
import numpy as np
import pandas as pd
import seaborn as sns
from matplotlib.colors import LinearSegmentedColormap
from matplotlib.font_manager import FontProperties
from matplotlib.patches import PathPatch
from matplotlib.textpath import TextPath


# Theme tokens
THEME = os.getenv("ANYPLOT_THEME", "light")
PAGE_BG = "#FAF8F1" if THEME == "light" else "#1A1A17"
ELEVATED_BG = "#FFFDF6" if THEME == "light" else "#242420"
INK = "#1A1A17" if THEME == "light" else "#F0EFE8"
INK_SOFT = "#4A4A44" if THEME == "light" else "#B8B7B0"
INK_MUTED = "#6B6A63" if THEME == "light" else "#A8A79F"

sns.set_theme(
    style="ticks",
    rc={
        "figure.facecolor": PAGE_BG,
        "axes.facecolor": PAGE_BG,
        "axes.edgecolor": INK_SOFT,
        "axes.labelcolor": INK,
        "text.color": INK,
        "xtick.color": INK_SOFT,
        "ytick.color": INK_SOFT,
        "grid.color": INK_SOFT,
        "grid.alpha": 0.15,
        "legend.facecolor": ELEVATED_BG,
        "legend.edgecolor": INK_SOFT,
    },
)

# Data — 10-position DNA motif; conserved core at positions 2–5, peak at position 3 (strong G)
bases = ["A", "C", "G", "T"]
frequencies = np.array(
    [
        [0.30, 0.25, 0.30, 0.15],  # pos 1: moderate spread
        [0.05, 0.10, 0.05, 0.80],  # pos 2: strong T — core start
        [0.03, 0.04, 0.90, 0.03],  # pos 3: very strong G — core peak
        [0.75, 0.10, 0.10, 0.05],  # pos 4: strong A — core
        [0.10, 0.60, 0.20, 0.10],  # pos 5: moderate C — core end
        [0.25, 0.25, 0.30, 0.20],  # pos 6: low conservation
        [0.55, 0.15, 0.20, 0.10],  # pos 7: moderate A
        [0.26, 0.24, 0.26, 0.24],  # pos 8: near uniform
        [0.10, 0.15, 0.10, 0.65],  # pos 9: moderate T
        [0.05, 0.80, 0.10, 0.05],  # pos 10: strong C
    ]
)
n_positions = frequencies.shape[0]

# Information content (bits) per position: IC = 2 + sum(f * log2(f))
info_content = np.zeros(n_positions)
for i in range(n_positions):
    entropy = sum(f * np.log2(f) for f in frequencies[i] if f > 0)
    info_content[i] = 2.0 + entropy

# Imprint palette for DNA bases (semantic mapping: A=green, C=blue, G=ochre, T=red)
base_colors = {"A": "#009E73", "C": "#4467A3", "G": "#BD8233", "T": "#AE3030"}

# Imprint sequential colormap for frequency heatmap
imprint_seq = LinearSegmentedColormap.from_list("imprint_seq", ["#009E73", "#4467A3"])

# Frequency DataFrame for heatmap panel
freq_df = pd.DataFrame(frequencies.T, index=bases, columns=range(1, n_positions + 1))

# Canvas: 3200×1800 px (landscape), two-panel layout
fig, (ax_logo, ax_heat) = plt.subplots(2, 1, figsize=(8, 4.5), dpi=400, height_ratios=[3.5, 1], facecolor=PAGE_BG)
fig.subplots_adjust(left=0.09, right=0.87, top=0.91, bottom=0.14, hspace=0.70)
ax_logo.set_facecolor(PAGE_BG)
ax_heat.set_facecolor(PAGE_BG)

# Sequence logo — letter glyphs via TextPath/PathPatch
fp = FontProperties(family="monospace", weight="bold")
letter_width = 0.78

for pos in range(n_positions):
    ic = info_content[pos]
    letter_heights = frequencies[pos] * ic
    sorted_indices = np.argsort(letter_heights)
    y_offset = 0.0

    for idx in sorted_indices:
        height = letter_heights[idx]
        if height < 0.01:
            continue
        letter = bases[idx]
        color = base_colors[letter]
        x_center = pos
        x_left = x_center - letter_width / 2

        tp = TextPath((0, 0), letter, size=1, prop=fp)
        bbox = tp.get_extents()
        if bbox.width == 0 or bbox.height == 0:
            continue

        scale_x = letter_width / bbox.width
        scale_y = height / bbox.height
        tx = x_left - bbox.x0 * scale_x
        ty = y_offset - bbox.y0 * scale_y

        transform = mtransforms.Affine2D().scale(scale_x, scale_y).translate(tx, ty) + ax_logo.transData
        patch = PathPatch(tp, facecolor=color, edgecolor="none", transform=transform)
        ax_logo.add_patch(patch)
        y_offset += height

# Logo axis styling
ax_logo.set_xlim(-0.6, n_positions - 0.4)
ax_logo.set_ylim(0, 2.1)
ax_logo.set_xticks(range(n_positions))
ax_logo.set_xticklabels(range(1, n_positions + 1))
ax_logo.set_title(
    "sequence-logo-basic · python · seaborn · anyplot.ai", fontsize=12, fontweight="medium", color=INK, pad=8
)
ax_logo.set_xlabel("Position", fontsize=10, color=INK)
ax_logo.set_ylabel("Information content (bits)", fontsize=10, color=INK)
ax_logo.tick_params(axis="both", labelsize=8, colors=INK_SOFT)
sns.despine(ax=ax_logo, top=True, right=True)
ax_logo.yaxis.grid(True, alpha=0.15, linewidth=0.5, color=INK_SOFT)
ax_logo.set_axisbelow(True)

# Highlight the most conserved position (position 3 — strong G)
max_ic_pos = int(np.argmax(info_content))
ax_logo.axvspan(max_ic_pos - 0.42, max_ic_pos + 0.42, color=INK_MUTED, alpha=0.12, zorder=0)
ax_logo.annotate(
    f"Most conserved\n({info_content[max_ic_pos]:.1f} bits)",
    xy=(max_ic_pos, info_content[max_ic_pos]),
    xytext=(max_ic_pos + 3.0, 1.80),
    fontsize=7,
    fontstyle="italic",
    color=INK_SOFT,
    arrowprops={"arrowstyle": "->", "color": INK_MUTED, "lw": 0.8, "connectionstyle": "arc3,rad=0.3"},
    ha="center",
    va="center",
)

# Frequency heatmap (seaborn panel — Imprint sequential colormap)
sns.heatmap(
    freq_df,
    ax=ax_heat,
    cmap=imprint_seq,
    annot=True,
    fmt=".2f",
    annot_kws={"size": 5, "color": INK_SOFT},
    linewidths=0.3,
    linecolor=PAGE_BG,
    cbar_kws={"label": "Freq.", "shrink": 0.85, "aspect": 12, "pad": 0.02},
    vmin=0,
    vmax=1,
)
ax_heat.set_xlabel("Position", fontsize=10, color=INK)
ax_heat.set_ylabel("", fontsize=10)
ax_heat.tick_params(axis="both", labelsize=8, colors=INK_SOFT)
ax_heat.tick_params(axis="y", rotation=0)
sns.despine(ax=ax_heat, top=True, right=True, left=True, bottom=True)

# Color y-axis labels to match DNA color scheme
# In dark theme, #4467A3 (C=blue) has ~3:1 contrast against #1A1A17 — use INK_SOFT instead
for tick_label in ax_heat.get_yticklabels():
    base = tick_label.get_text()
    if base in base_colors:
        if THEME == "dark" and base == "C":
            tick_label.set_color(INK_SOFT)
        else:
            tick_label.set_color(base_colors[base])
        tick_label.set_fontweight("bold")

# Theme-adaptive colorbar text
cbar = ax_heat.collections[0].colorbar
if cbar is not None:
    cbar.ax.yaxis.label.set_color(INK_SOFT)
    cbar.ax.tick_params(colors=INK_SOFT, labelsize=7)

plt.savefig(f"plot-{THEME}.png", dpi=400, facecolor=PAGE_BG)
Runnable source as JSON, for any HTTP client: https://api.anyplot.ai/specs/sequence-logo-basic/seaborn/code. Any spec id and library id listed in llms-full.txt fit the same URL shape; every URL below is complete and callable.
{
  "spec_id": "sequence-logo-basic",
  "language": "python",
  "library": "seaborn",
  "page": "https://anyplot.ai/sequence-logo-basic/python/seaborn",
  "hub": "https://anyplot.ai/sequence-logo-basic",
  "code_json": "https://api.anyplot.ai/specs/sequence-logo-basic/seaborn/code",
  "spec_json": "https://api.anyplot.ai/specs/sequence-logo-basic",
  "render_light_png": "https://storage.googleapis.com/anyplot-images/plots/sequence-logo-basic/python/seaborn/plot-light.png",
  "render_dark_png": "https://storage.googleapis.com/anyplot-images/plots/sequence-logo-basic/python/seaborn/plot-dark.png",
  "quality_score": 88.0,
  "license": "MIT",
  "guide": "https://anyplot.ai/llms.txt"
}
Part of Sequence Logo for Motif Visualization on anyplot.ai.