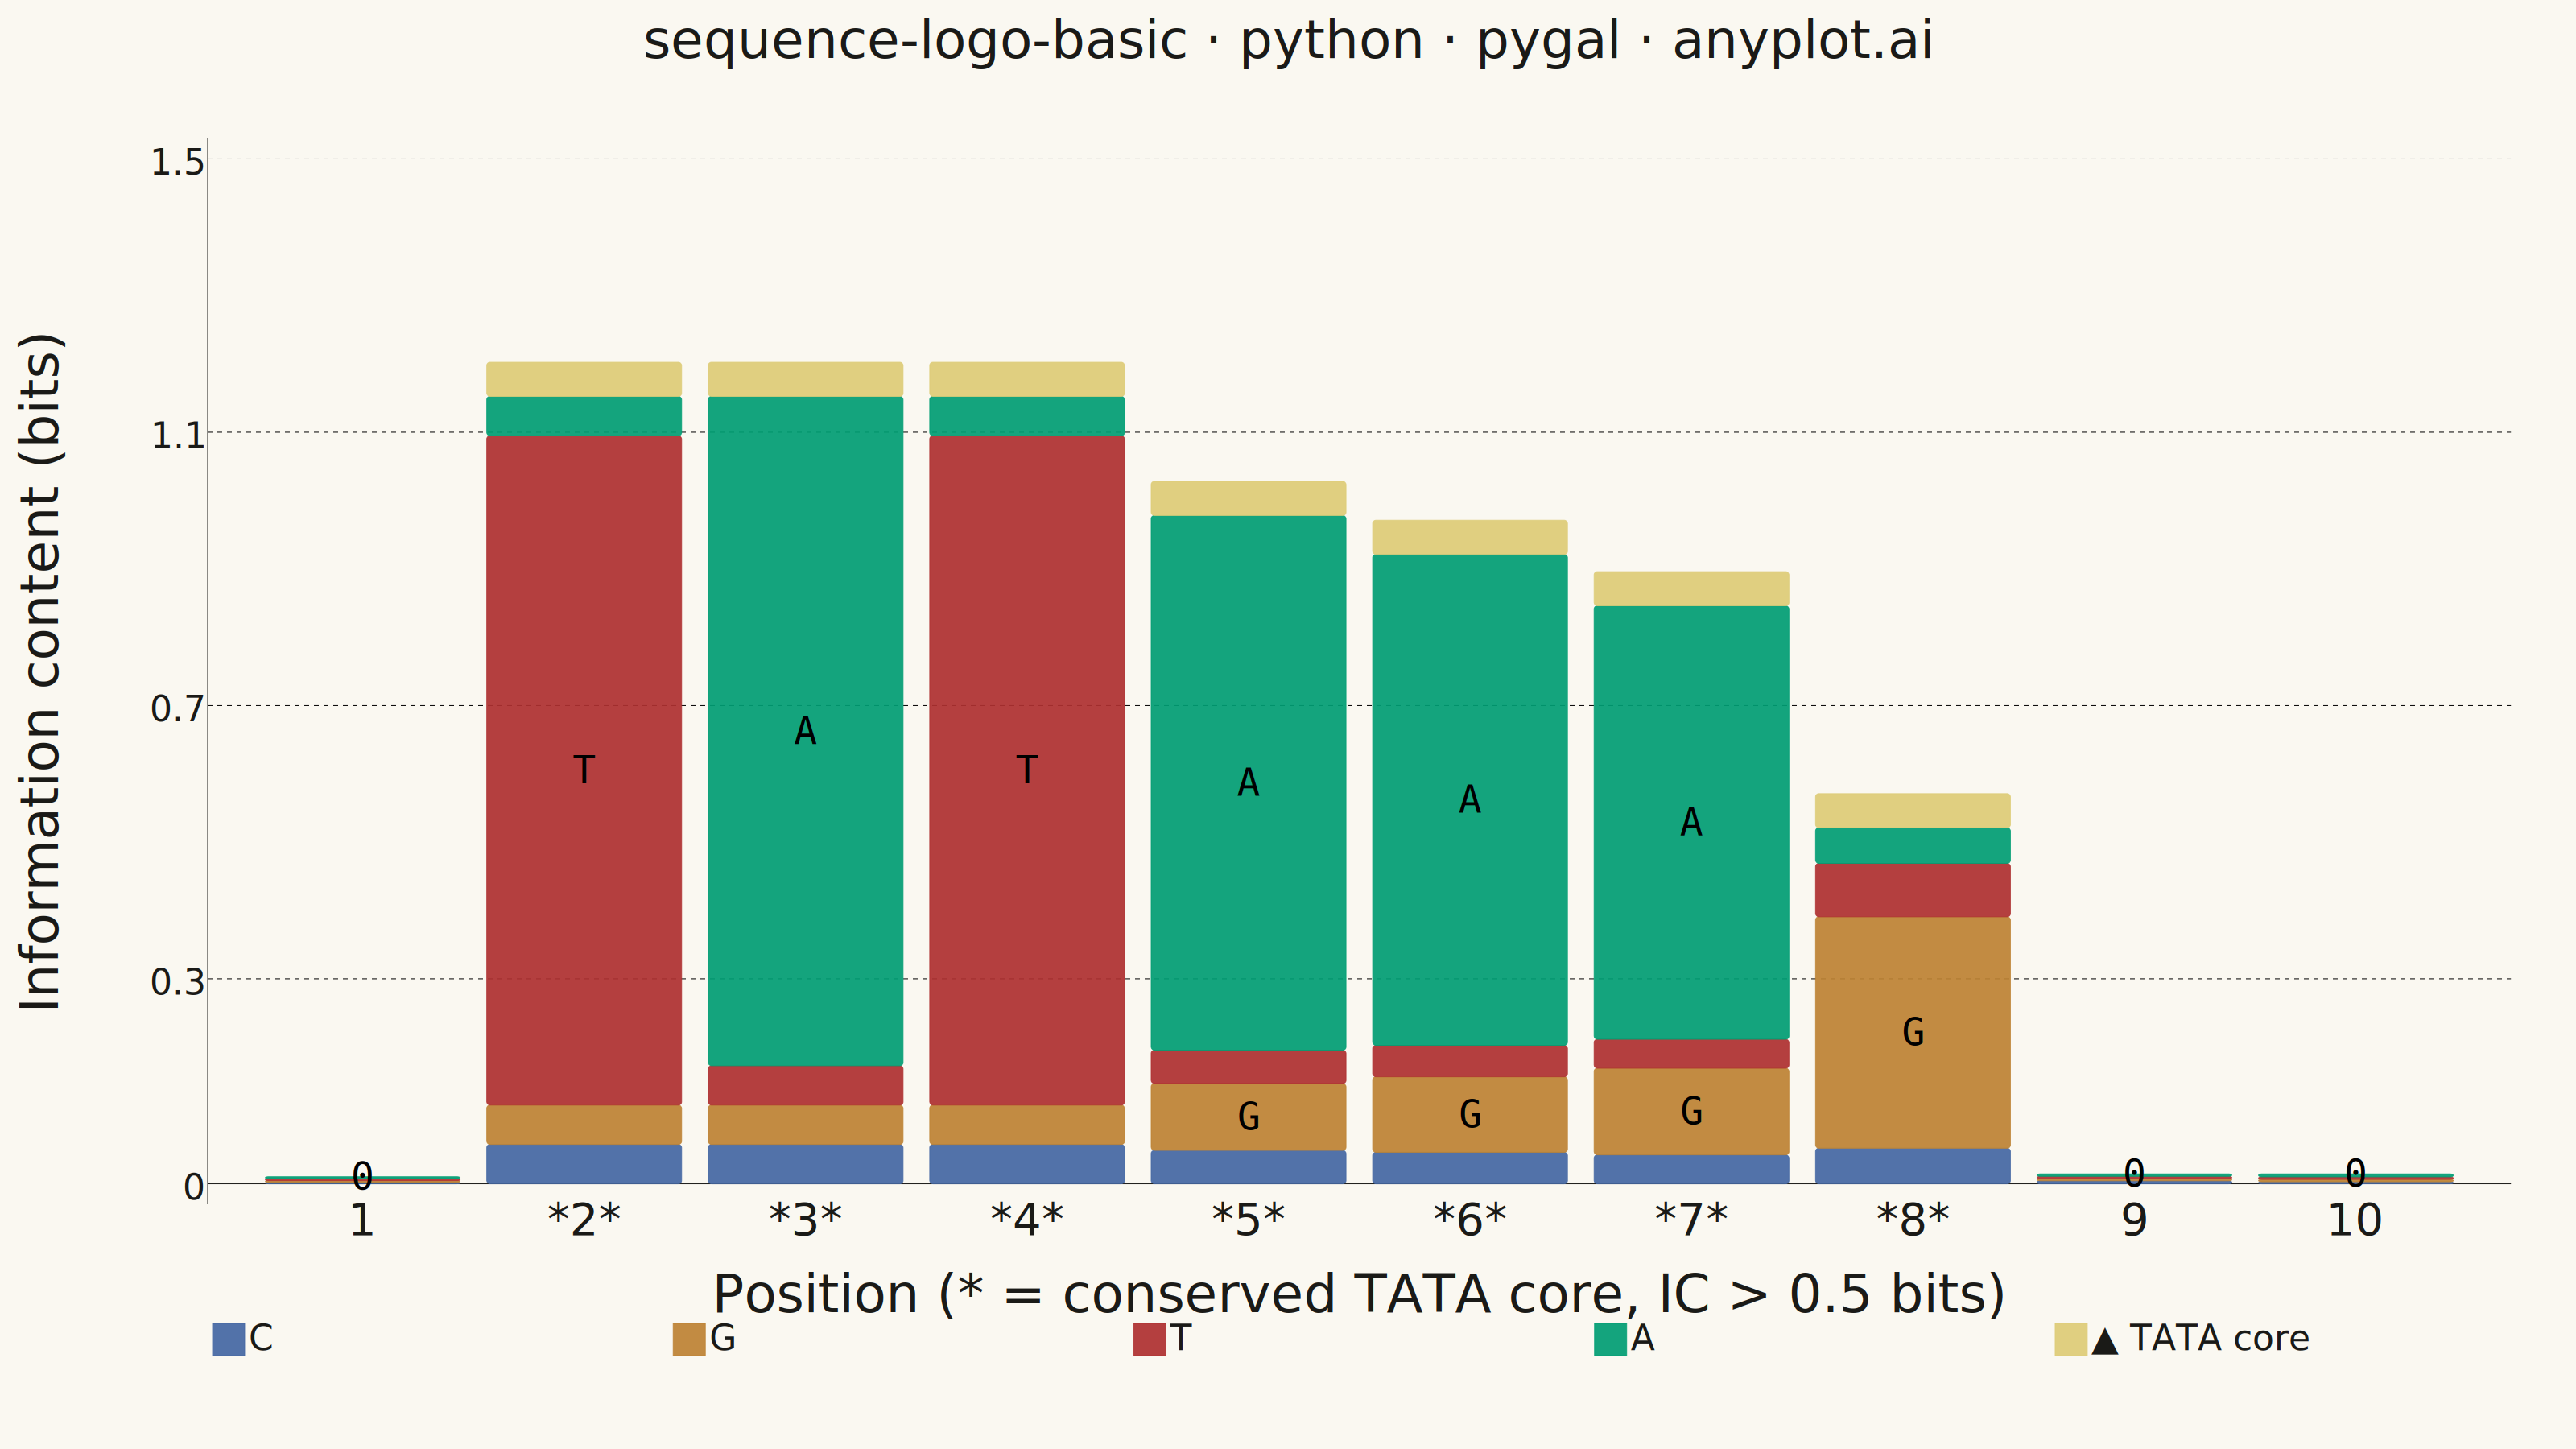
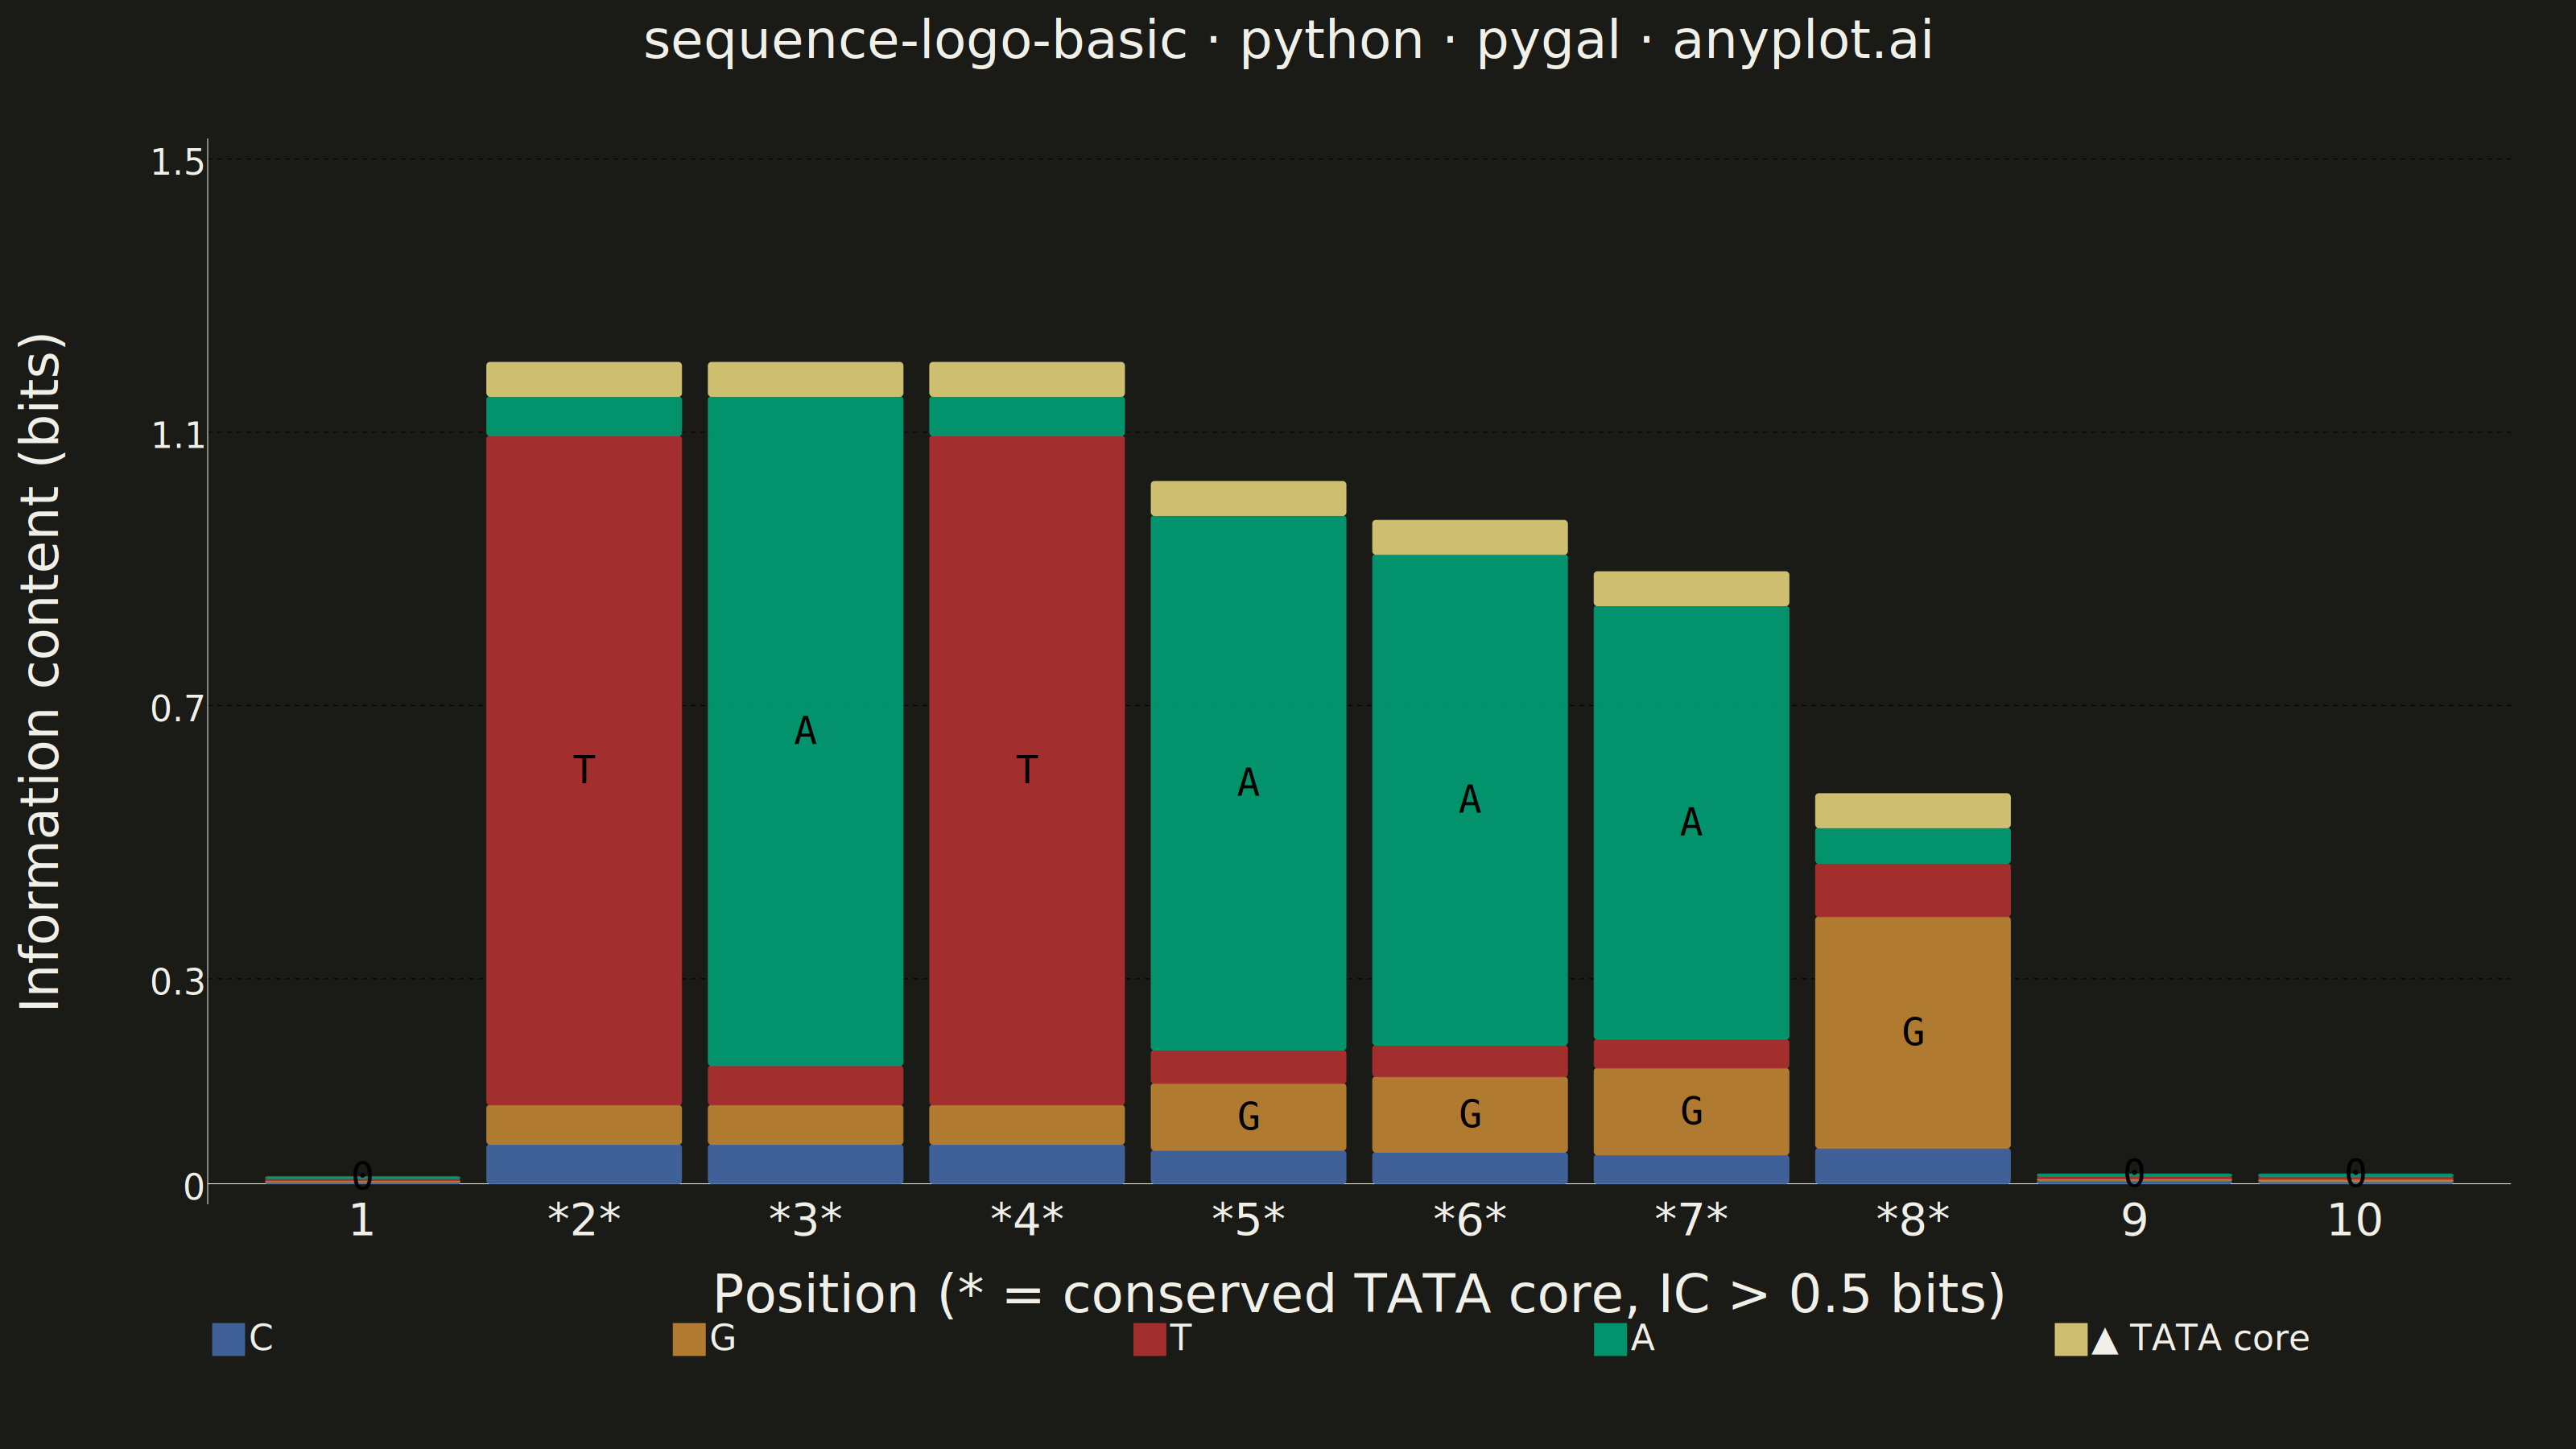
A sequence logo visualizes the consensus of multiple aligned DNA, RNA, or protein sequences. At each position, letters are stacked vertically with height proportional to information content (measured in bits), and individual letter heights within the stack reflect their relative frequency. This is the standard visualization for identifying conserved positions in transcription factor binding sites, splice sites, and protein domains.
""" anyplot.ai
sequence-logo-basic: Sequence Logo for Motif Visualization
Library: pygal 3.1.0 | Python 3.13.13
Quality: 85/100 | Updated: 2026-06-02
"""

import os
import sys


# Remove the script's directory from sys.path so `import pygal` finds the
# installed package rather than this file (which shares the package name).
_this_dir = os.path.dirname(os.path.abspath(__file__))
sys.path = [p for p in sys.path if os.path.abspath(p or os.getcwd()) != _this_dir]

import numpy as np
import pygal
from pygal.style import Style


# Theme tokens (Imprint palette — default-style-guide.md)
THEME = os.getenv("ANYPLOT_THEME", "light")
PAGE_BG = "#FAF8F1" if THEME == "light" else "#1A1A17"
INK = "#1A1A17" if THEME == "light" else "#F0EFE8"
INK_MUTED = "#6B6A63" if THEME == "light" else "#A8A79F"

# DNA nucleotide colors — semantic exception: standard bioinformatics DNA color
# convention maps exactly to Imprint palette members
DNA_COLORS = {
    "A": "#009E73",  # Imprint palette pos 1 (brand green) — adenine
    "C": "#4467A3",  # Imprint palette pos 3 (blue) — cytosine
    "G": "#BD8233",  # Imprint palette pos 4 (ochre) — guanine
    "T": "#AE3030",  # Imprint palette pos 5 (matte red) — thymine
}
ANYPLOT_AMBER = "#DDCC77"  # caution/highlight — TATA core marker (outside categorical pool)

# Data — TATA-box promoter element, 10-position motif
# Positions 2-7 form the conserved TATAAA core recognized by TATA-binding protein (TBP)
frequencies = {
    1: {"A": 0.28, "C": 0.22, "G": 0.22, "T": 0.28},
    2: {"A": 0.05, "C": 0.05, "G": 0.05, "T": 0.85},
    3: {"A": 0.85, "C": 0.05, "G": 0.05, "T": 0.05},
    4: {"A": 0.05, "C": 0.05, "G": 0.05, "T": 0.85},
    5: {"A": 0.80, "C": 0.05, "G": 0.10, "T": 0.05},
    6: {"A": 0.78, "C": 0.05, "G": 0.12, "T": 0.05},
    7: {"A": 0.75, "C": 0.05, "G": 0.15, "T": 0.05},
    8: {"A": 0.10, "C": 0.10, "G": 0.65, "T": 0.15},
    9: {"A": 0.25, "C": 0.30, "G": 0.20, "T": 0.25},
    10: {"A": 0.30, "C": 0.20, "G": 0.25, "T": 0.25},
}

nucleotides = ["A", "C", "G", "T"]
max_entropy = 2.0  # DNA: 4 nucleotides → max 2 bits

# Information content per position (IC = max_entropy - Shannon entropy)
info_content = {}
for pos, freqs in frequencies.items():
    entropy = sum(-f * np.log2(f) for f in freqs.values() if f > 0)
    info_content[pos] = max(0.0, max_entropy - entropy)

# Conserved positions (IC > 0.5 bits)
core_positions = {pos for pos, ic in info_content.items() if ic > 0.5}

# Sort nucleotides ascending by IC-weighted average frequency so the nucleotide
# dominant at high-conservation positions rises to the top of the global stack.
# pygal StackedBar uses one fixed stacking order across all positions — true
# per-position reordering (canonical for sequence logos) requires custom SVG.
total_ic = sum(info_content.values()) or 1.0
ic_weighted_freq = {
    nt: sum(frequencies[pos][nt] * info_content[pos] for pos in frequencies) / total_ic for nt in nucleotides
}
nucleotides_sorted = sorted(nucleotides, key=lambda nt: ic_weighted_freq[nt])

# Build per-nucleotide stacked data (heights scaled by freq × IC)
stacked_data = {nt: [] for nt in nucleotides_sorted}
for pos in sorted(frequencies):
    ic = info_content[pos]
    for nt in nucleotides_sorted:
        height = round(frequencies[pos][nt] * ic, 4)
        show_letter = height >= 0.08
        stacked_data[nt].append(
            {
                "value": height,
                "label": f"Pos {pos}: {nt} = {frequencies[pos][nt]:.0%}, IC={ic:.2f} bits",
                "formatter": (lambda x, letter=nt, show=show_letter: letter if show else ""),
            }
        )

# TATA core visual marker: amber cap on conserved positions highlights the binding site
tata_cap = [
    {
        "value": 0.05,
        "color": ANYPLOT_AMBER,
        "label": "TATA-box core — TBP binding site (IC > 0.5 bits)",
        "formatter": lambda x: "",  # suppress numeric value label on the marker cap
    }
    if pos in core_positions
    else None
    for pos in sorted(frequencies)
]

# X-axis labels — mark conserved positions (IC > 0.5 bits)
x_labels = [f"*{pos}*" if pos in core_positions else str(pos) for pos in sorted(frequencies)]

# Y-axis upper bound with headroom above the tallest bar (including TATA cap)
y_max = round(max(info_content.values()) + 0.35, 1)

# Imprint palette style — theme-adaptive chrome; amber appended for TATA core series
colors_in_order = tuple(DNA_COLORS[nt] for nt in nucleotides_sorted) + (ANYPLOT_AMBER,)
custom_style = Style(
    background=PAGE_BG,
    plot_background=PAGE_BG,
    foreground=INK,
    foreground_strong=INK,
    foreground_subtle=INK_MUTED,
    colors=colors_in_order,
    opacity=0.92,
    opacity_hover=1.0,
    title_font_size=66,
    label_font_size=56,
    major_label_font_size=44,
    legend_font_size=44,
    value_font_size=48,
    title_font_family="sans-serif",
    label_font_family="sans-serif",
    major_label_font_family="sans-serif",
    legend_font_family="sans-serif",
    value_font_family="monospace",
    tooltip_font_size=36,
    tooltip_font_family="monospace",
)

# Plot
title = "sequence-logo-basic · python · pygal · anyplot.ai"
chart = pygal.StackedBar(
    width=3200,
    height=1800,
    style=custom_style,
    title=title,
    x_title="Position (* = conserved TATA core, IC > 0.5 bits)",
    y_title="Information content (bits)",
    show_x_guides=False,
    show_y_guides=True,
    show_minor_y_labels=False,
    margin=80,
    margin_bottom=120,
    margin_top=100,
    spacing=6,
    legend_at_bottom=True,
    legend_at_bottom_columns=5,
    legend_box_size=40,
    print_values=True,
    print_values_position="center",
    rounded_bars=4,
    y_labels_major_count=5,
    truncate_legend=-1,
    tooltip_border_radius=10,
    tooltip_fancy_mode=True,
    min_scale=0,
    range=(0, y_max),
    x_label_rotation=0,
    js=[],
)

chart.x_labels = x_labels

for nt in nucleotides_sorted:
    chart.add(nt, stacked_data[nt])

# Amber cap marks the TATA-box core (positions 2-7) as conserved binding site
chart.add("▲ TATA core", tata_cap)

# Save PNG and HTML
chart.render_to_png(f"plot-{THEME}.png")
chart.render_to_file(f"plot-{THEME}.html")
Runnable source as JSON, for any HTTP client: https://api.anyplot.ai/specs/sequence-logo-basic/pygal/code. Any spec id and library id listed in llms-full.txt fit the same URL shape; every URL below is complete and callable.
{
  "spec_id": "sequence-logo-basic",
  "language": "python",
  "library": "pygal",
  "page": "https://anyplot.ai/sequence-logo-basic/python/pygal",
  "hub": "https://anyplot.ai/sequence-logo-basic",
  "code_json": "https://api.anyplot.ai/specs/sequence-logo-basic/pygal/code",
  "spec_json": "https://api.anyplot.ai/specs/sequence-logo-basic",
  "render_light_png": "https://storage.googleapis.com/anyplot-images/plots/sequence-logo-basic/python/pygal/plot-light.png",
  "render_dark_png": "https://storage.googleapis.com/anyplot-images/plots/sequence-logo-basic/python/pygal/plot-dark.png",
  "interactive_light_html": "https://storage.googleapis.com/anyplot-images/plots/sequence-logo-basic/python/pygal/plot-light.html",
  "interactive_dark_html": "https://storage.googleapis.com/anyplot-images/plots/sequence-logo-basic/python/pygal/plot-dark.html",
  "quality_score": 85.0,
  "license": "MIT",
  "guide": "https://anyplot.ai/llms.txt"
}
Part of Sequence Logo for Motif Visualization on anyplot.ai.