The same plot in 14 other libraries — JavaScript: Chart.js, D3.js, Apache ECharts, Highcharts; Python: Altair, Bokeh, lets-plot, Matplotlib, Plotly, plotnine, Pygal, Seaborn; R: ggplot2; Julia: Makie.jl. Compare all 15 side by side: Sequence Logo for Motif Visualization in Python, R, Julia and JavaScript.
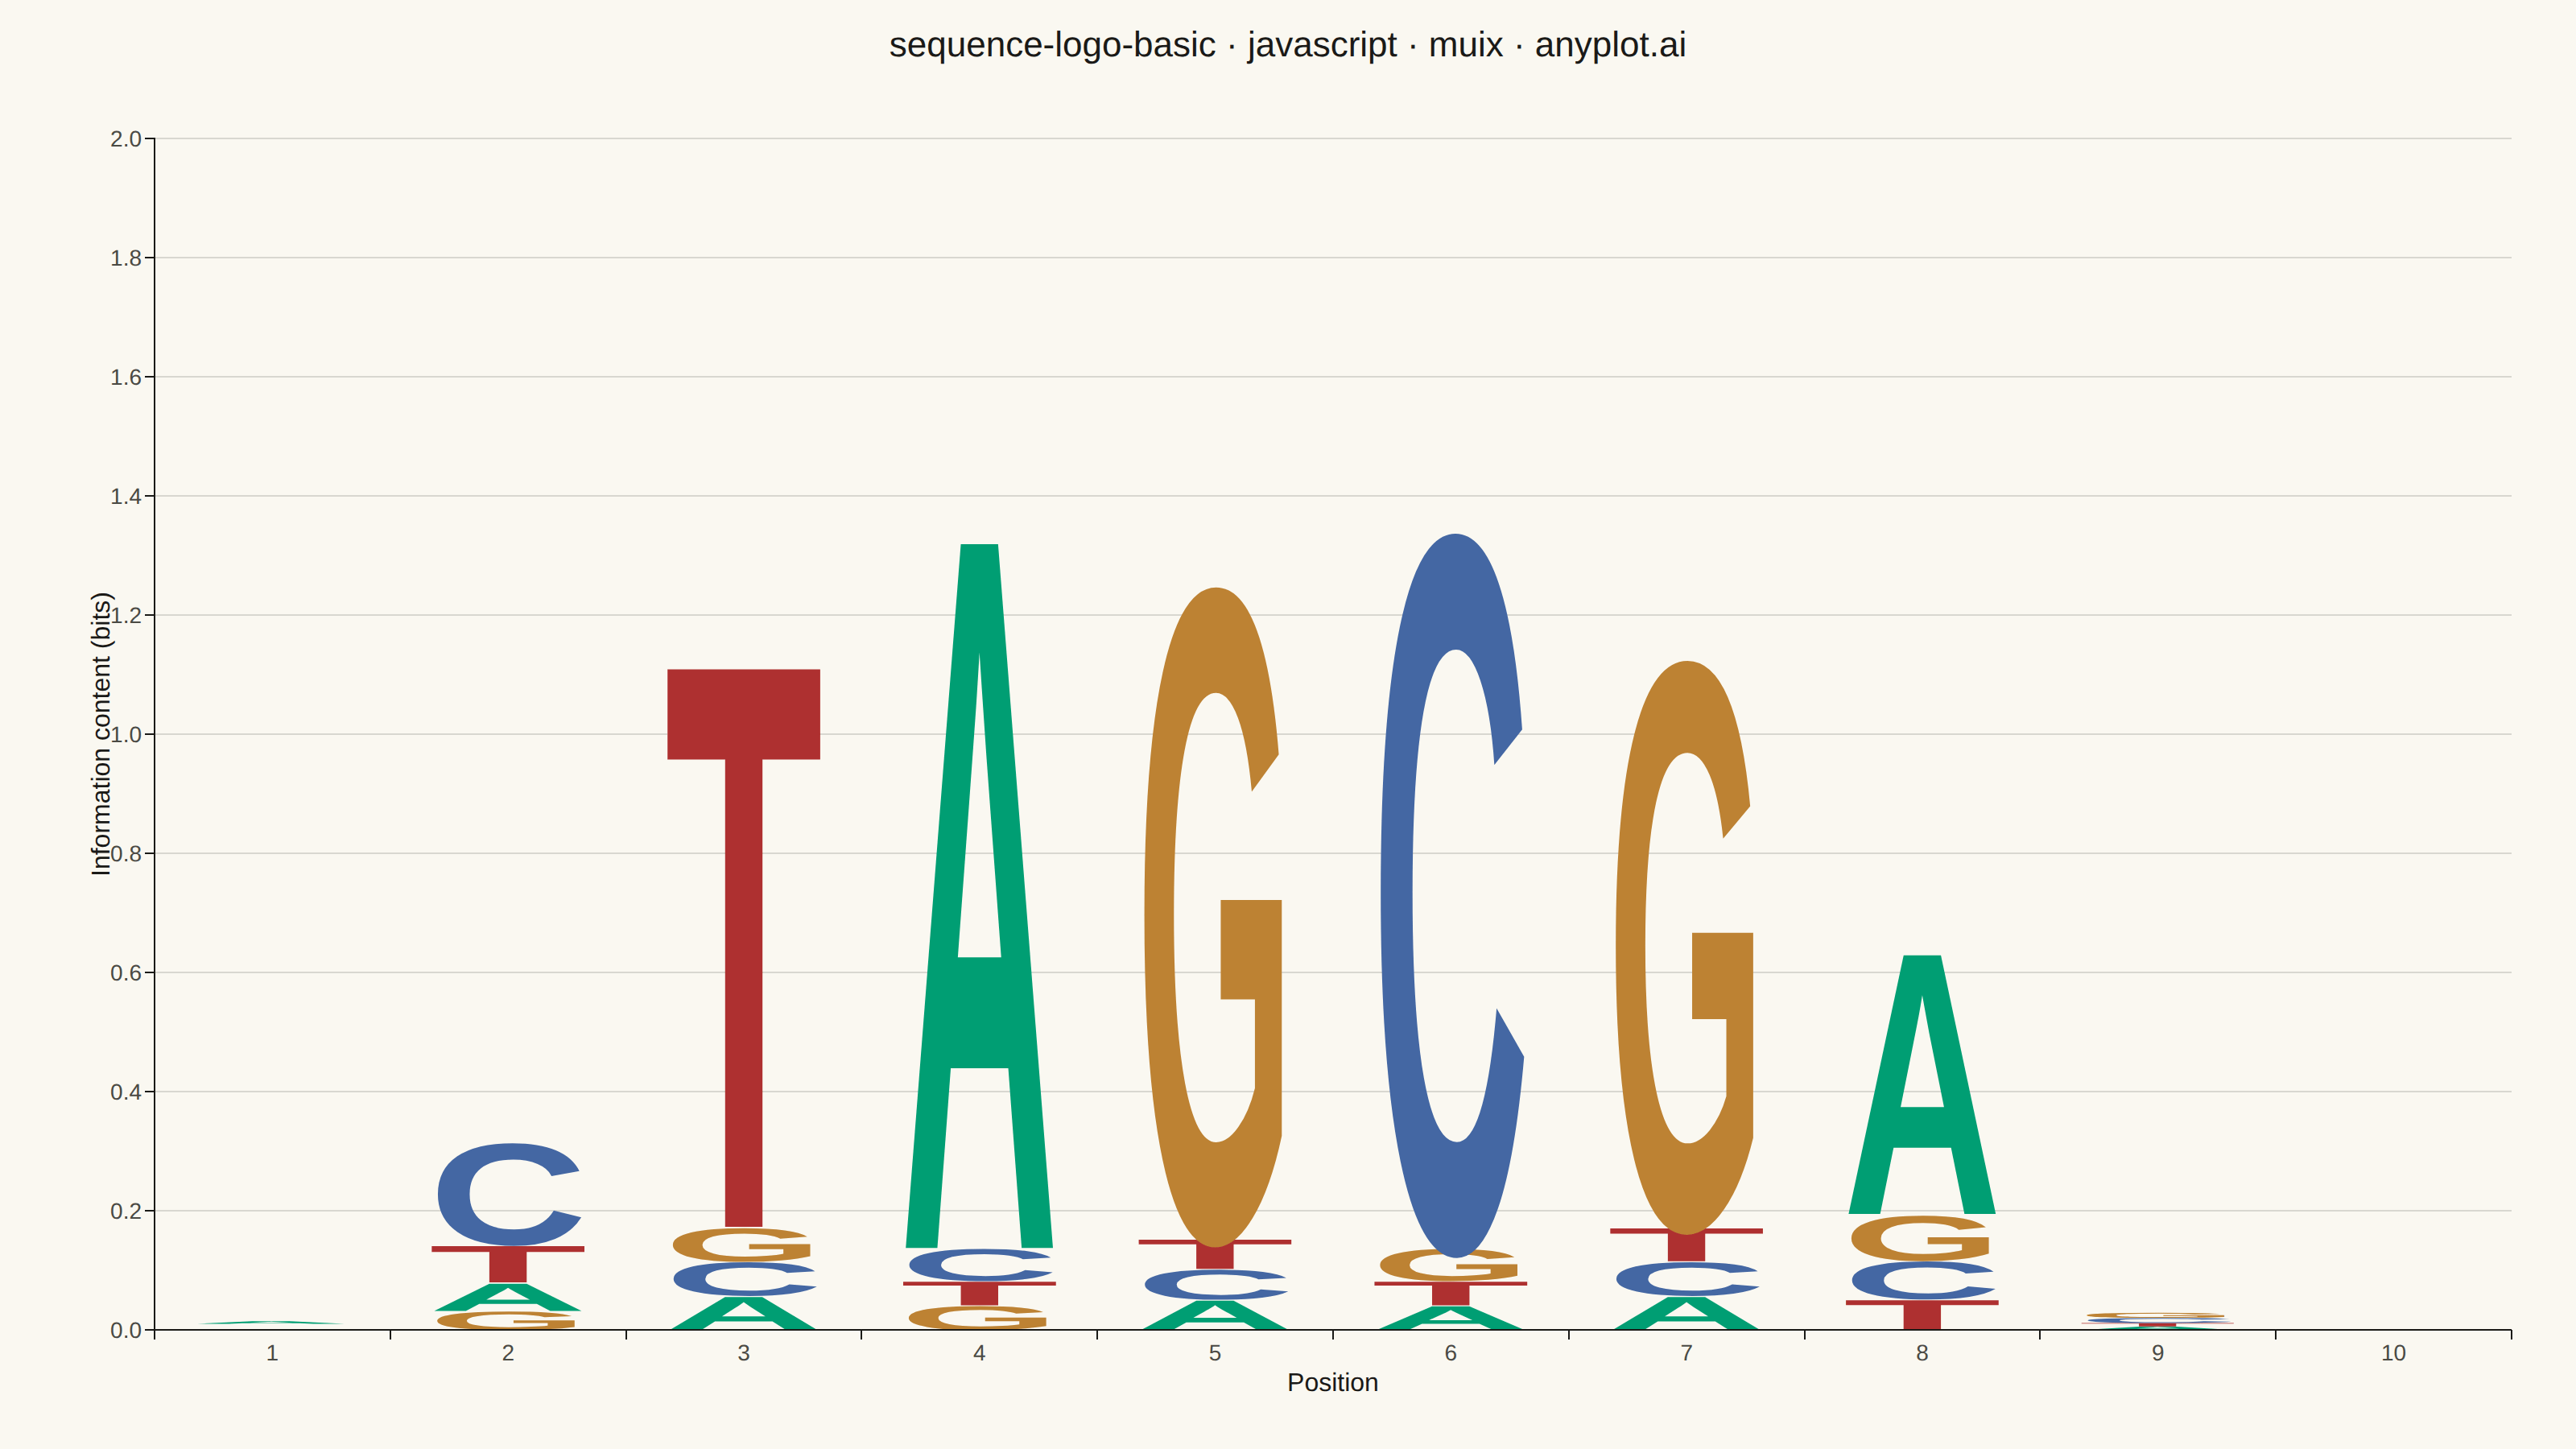
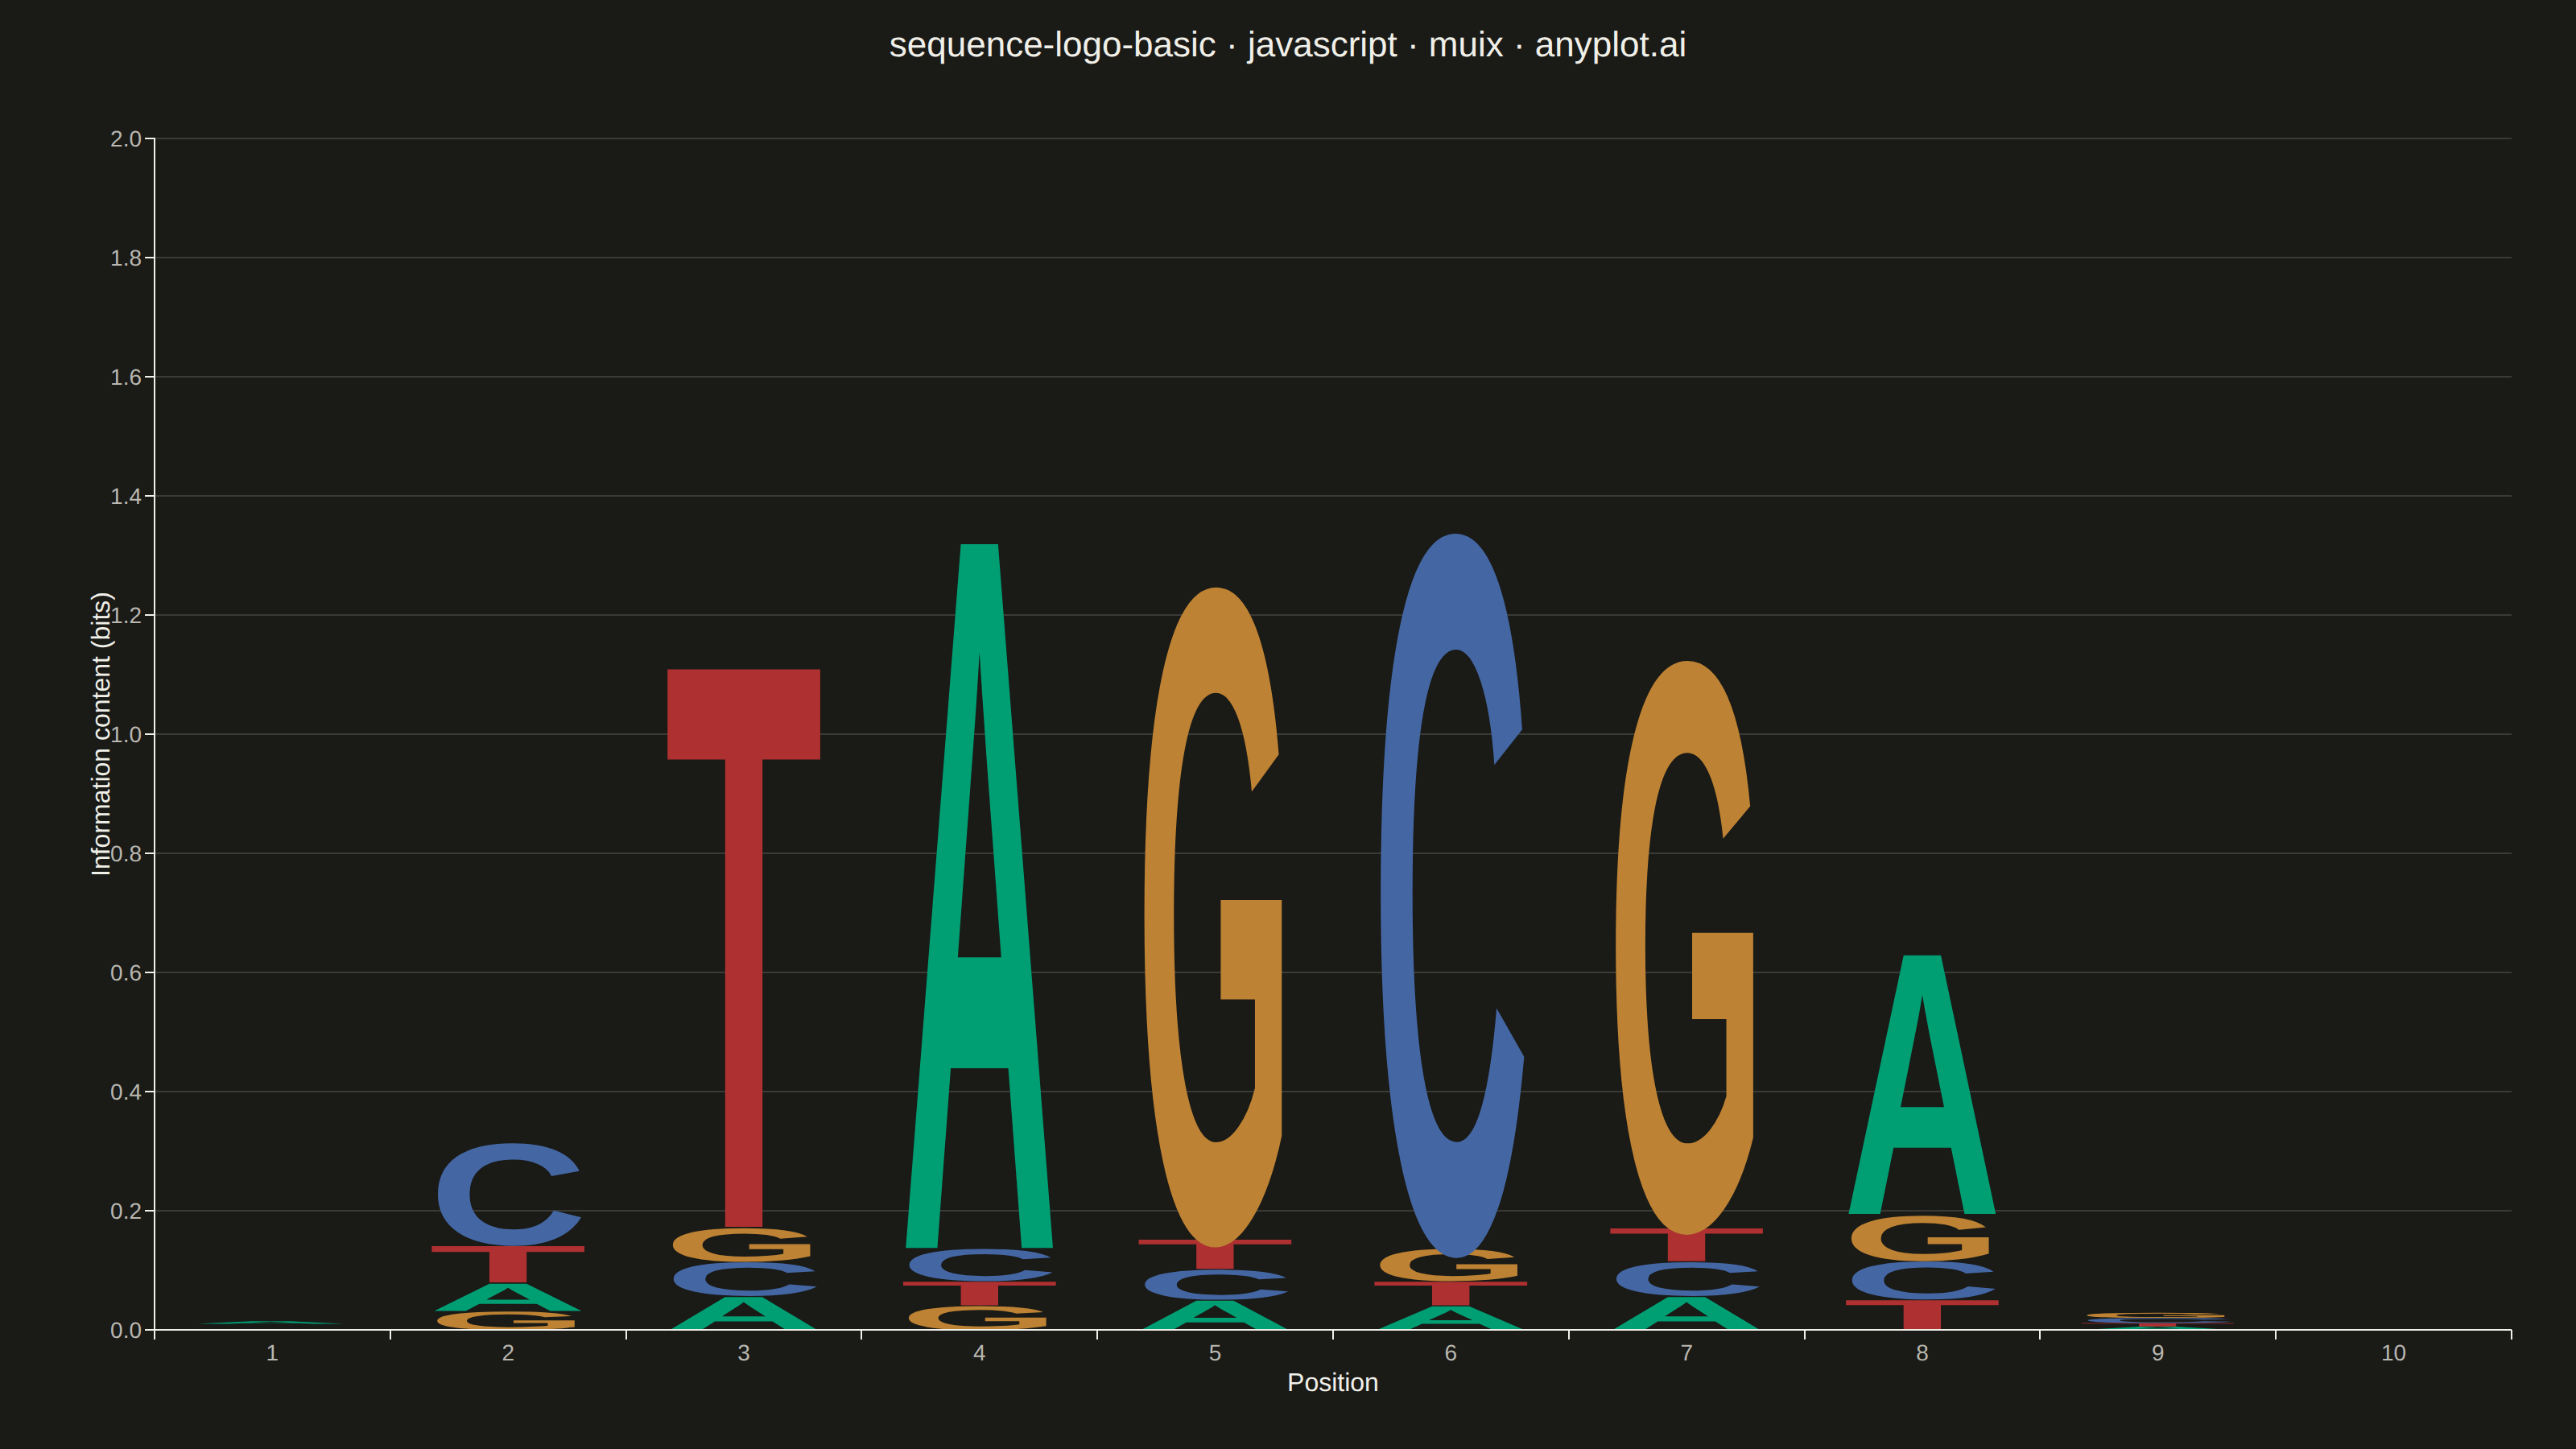
A sequence logo visualizes the consensus of multiple aligned DNA, RNA, or protein sequences. At each position, letters are stacked vertically with height proportional to information content (measured in bits), and individual letter heights within the stack reflect their relative frequency. This is the standard visualization for identifying conserved positions in transcription factor binding sites, splice sites, and protein domains.
// anyplot.ai
// sequence-logo-basic: Sequence Logo for Motif Visualization
// Library: muix 7.29.1 | JavaScript 22.23.2
// Quality: 93/100 | Created: 2026-08-26
//# anyplot-orientation: landscape
// anyplot.ai
// sequence-logo-basic: Sequence Logo for Motif Visualization
// Library: MUI X Charts | React | Node 22
// License: @mui/x-charts — MIT (community). Pro/Premium are out of scope.
// Quality: pending | Created: 2026-08-26
import { ChartContainer } from "@mui/x-charts/ChartContainer";
import { ChartsGrid } from "@mui/x-charts/ChartsGrid";
import { ChartsXAxis } from "@mui/x-charts/ChartsXAxis";
import { ChartsYAxis } from "@mui/x-charts/ChartsYAxis";
import { useXScale, useYScale } from "@mui/x-charts/hooks";
import Box from "@mui/material/Box";
import Typography from "@mui/material/Typography";

const t = window.ANYPLOT_TOKENS;

// --- Data (in-memory, deterministic) ---------------------------------------
// Relative letter frequencies at each aligned position of a synthetic 10-bp
// transcription-factor binding site motif (rows sum to 1). Positions 3-7 form
// a conserved core (TAGCG); the flanks are weakly conserved, as is typical for
// real ChIP-seq / SELEX motifs.
const LETTERS = ["A", "C", "G", "T"];

const FREQUENCIES = [
  { A: 0.3, C: 0.25, G: 0.2, T: 0.25 },
  { A: 0.15, C: 0.55, G: 0.1, T: 0.2 },
  { A: 0.05, C: 0.05, G: 0.05, T: 0.85 },
  { A: 0.9, C: 0.04, G: 0.03, T: 0.03 },
  { A: 0.04, C: 0.04, G: 0.88, T: 0.04 },
  { A: 0.03, C: 0.9, G: 0.04, T: 0.03 },
  { A: 0.05, C: 0.05, G: 0.85, T: 0.05 },
  { A: 0.7, C: 0.1, G: 0.12, T: 0.08 },
  { A: 0.2, C: 0.3, G: 0.3, T: 0.2 },
  { A: 0.25, C: 0.25, G: 0.25, T: 0.25 },
];

const MAX_BITS = 2; // DNA: log2(4 possible letters)
const positions = FREQUENCIES.map((_, i) => `${i + 1}`);

// Standard nucleotide color code (per the specification), mapped onto the
// Imprint palette: A -> brand green, C -> blue, G -> ochre, T -> matte red.
const LETTER_COLOR = {
  A: t.palette[0], // #009E73
  C: t.palette[2], // #4467A3
  G: t.palette[3], // #BD8233
  T: t.palette[4], // #AE3030
};

function informationContent(freqs) {
  const entropy = LETTERS.reduce((bits, letter) => {
    const p = freqs[letter];
    return p > 0 ? bits - p * Math.log2(p) : bits;
  }, 0);
  return MAX_BITS - entropy;
}

// Stacked segments per position, ascending by frequency so the most frequent
// letter ends up on top, per the specification.
const STACKS = FREQUENCIES.map((freqs) => {
  const ic = informationContent(freqs);
  const order = [...LETTERS].sort((a, b) => freqs[a] - freqs[b]);
  let cumulative = 0;
  return order
    .filter((letter) => freqs[letter] > 0)
    .map((letter) => {
      const bits = freqs[letter] * ic;
      const segment = { letter, from: cumulative, to: cumulative + bits };
      cumulative += bits;
      return segment;
    });
});

// Bold uppercase letters (Arial/Liberation Sans) render at ~72% cap-height of
// their font-size; stretching the glyph vertically by the inverse ratio makes
// the visible letter fill its allocated box exactly (fontSize is set to the
// box height, so this factor is constant across every glyph).
const CAP_HEIGHT_RATIO = 0.72;
const VERTICAL_STRETCH = 1 / CAP_HEIGHT_RATIO;

// --- Sequence logo layer: letters as scaled glyphs, not plain labels --------
function SequenceLogoGlyphs() {
  const xScale = useXScale();
  const yScale = useYScale();
  const bandwidth = xScale.bandwidth();
  const paddingX = bandwidth * 0.08;
  const usableWidth = bandwidth - 2 * paddingX;

  return (
    <g>
      {STACKS.map((segments, posIndex) =>
        segments.map((seg) => {
          const xLeft = xScale(positions[posIndex]) + paddingX;
          const yBottom = yScale(seg.from);
          const yTop = yScale(seg.to);
          const heightPx = yBottom - yTop;
          if (heightPx < 1.5) return null;
          // Stretch about the segment's own baseline (yBottom) so it grows
          // upward to fill heightPx without shifting its footing.
          const translateY = yBottom * (1 - VERTICAL_STRETCH);
          return (
            <text
              key={`${posIndex}-${seg.letter}`}
              x={xLeft + usableWidth / 2}
              y={yBottom}
              textAnchor="middle"
              textLength={usableWidth}
              lengthAdjust="spacingAndGlyphs"
              fontSize={heightPx}
              fontWeight={700}
              fontFamily="Arial, Liberation Sans, DejaVu Sans, sans-serif"
              fill={LETTER_COLOR[seg.letter]}
              transform={`translate(0 ${translateY}) scale(1 ${VERTICAL_STRETCH})`}
            >
              {seg.letter}
            </text>
          );
        }),
      )}
    </g>
  );
}

// --- Chart (default-exported component — the harness mounts it) -------------
const TITLE_H = 56;

export default function Chart() {
  const W = window.ANYPLOT_SIZE.width;
  const H = window.ANYPLOT_SIZE.height;

  return (
    <Box sx={{ width: W, height: H, bgcolor: t.pageBg, display: "flex", flexDirection: "column" }}>
      <Typography
        sx={{
          color: t.ink,
          fontSize: 22,
          fontWeight: 500,
          textAlign: "center",
          height: TITLE_H,
          lineHeight: `${TITLE_H}px`,
          flexShrink: 0,
        }}
      >
        sequence-logo-basic · javascript · muix · anyplot.ai
      </Typography>
      <ChartContainer
        width={W}
        height={H - TITLE_H}
        series={[]}
        margin={{ top: 30, right: 40, bottom: 74, left: 96 }}
        xAxis={[
          {
            scaleType: "band",
            data: positions,
            label: "Position",
            labelStyle: { fontSize: 16, fill: t.ink },
            tickLabelStyle: { fontSize: 14, fill: t.inkSoft },
          },
        ]}
        yAxis={[
          {
            scaleType: "linear",
            min: 0,
            max: MAX_BITS,
            label: "Information content (bits)",
            labelStyle: { fontSize: 16, fill: t.ink },
            tickLabelStyle: { fontSize: 14, fill: t.inkSoft },
          },
        ]}
        sx={{
          "& .MuiChartsAxis-line": { stroke: t.inkSoft, strokeWidth: 1 },
          "& .MuiChartsAxis-tick": { stroke: t.inkSoft },
          "& .MuiChartsGrid-line": { stroke: t.grid },
        }}
      >
        <ChartsGrid horizontal />
        <SequenceLogoGlyphs />
        <ChartsXAxis />
        <ChartsYAxis />
      </ChartContainer>
    </Box>
  );
}
Runnable source as JSON, for any HTTP client: https://api.anyplot.ai/specs/sequence-logo-basic/muix/code. Any spec id and library id listed in llms-full.txt fit the same URL shape; every URL below is complete and callable.
{
  "spec_id": "sequence-logo-basic",
  "language": "javascript",
  "library": "muix",
  "page": "https://anyplot.ai/sequence-logo-basic/javascript/muix",
  "hub": "https://anyplot.ai/sequence-logo-basic",
  "code_json": "https://api.anyplot.ai/specs/sequence-logo-basic/muix/code",
  "spec_json": "https://api.anyplot.ai/specs/sequence-logo-basic",
  "render_light_png": "https://storage.googleapis.com/anyplot-images/plots/sequence-logo-basic/javascript/muix/plot-light.png",
  "render_dark_png": "https://storage.googleapis.com/anyplot-images/plots/sequence-logo-basic/javascript/muix/plot-dark.png",
  "interactive_light_html": "https://storage.googleapis.com/anyplot-images/plots/sequence-logo-basic/javascript/muix/plot-light.html",
  "interactive_dark_html": "https://storage.googleapis.com/anyplot-images/plots/sequence-logo-basic/javascript/muix/plot-dark.html",
  "quality_score": 93.0,
  "license": "MIT",
  "guide": "https://anyplot.ai/llms.txt"
}
Part of Sequence Logo for Motif Visualization on anyplot.ai.