The same plot in 14 other libraries — Python: Altair, Bokeh, lets-plot, Matplotlib, Plotly, plotnine, Pygal, Seaborn; Julia: Makie.jl; JavaScript: Chart.js, D3.js, Apache ECharts, Highcharts, MUI X Charts. Compare all 15 side by side: Sequence Logo for Motif Visualization in Python, R, Julia and JavaScript.
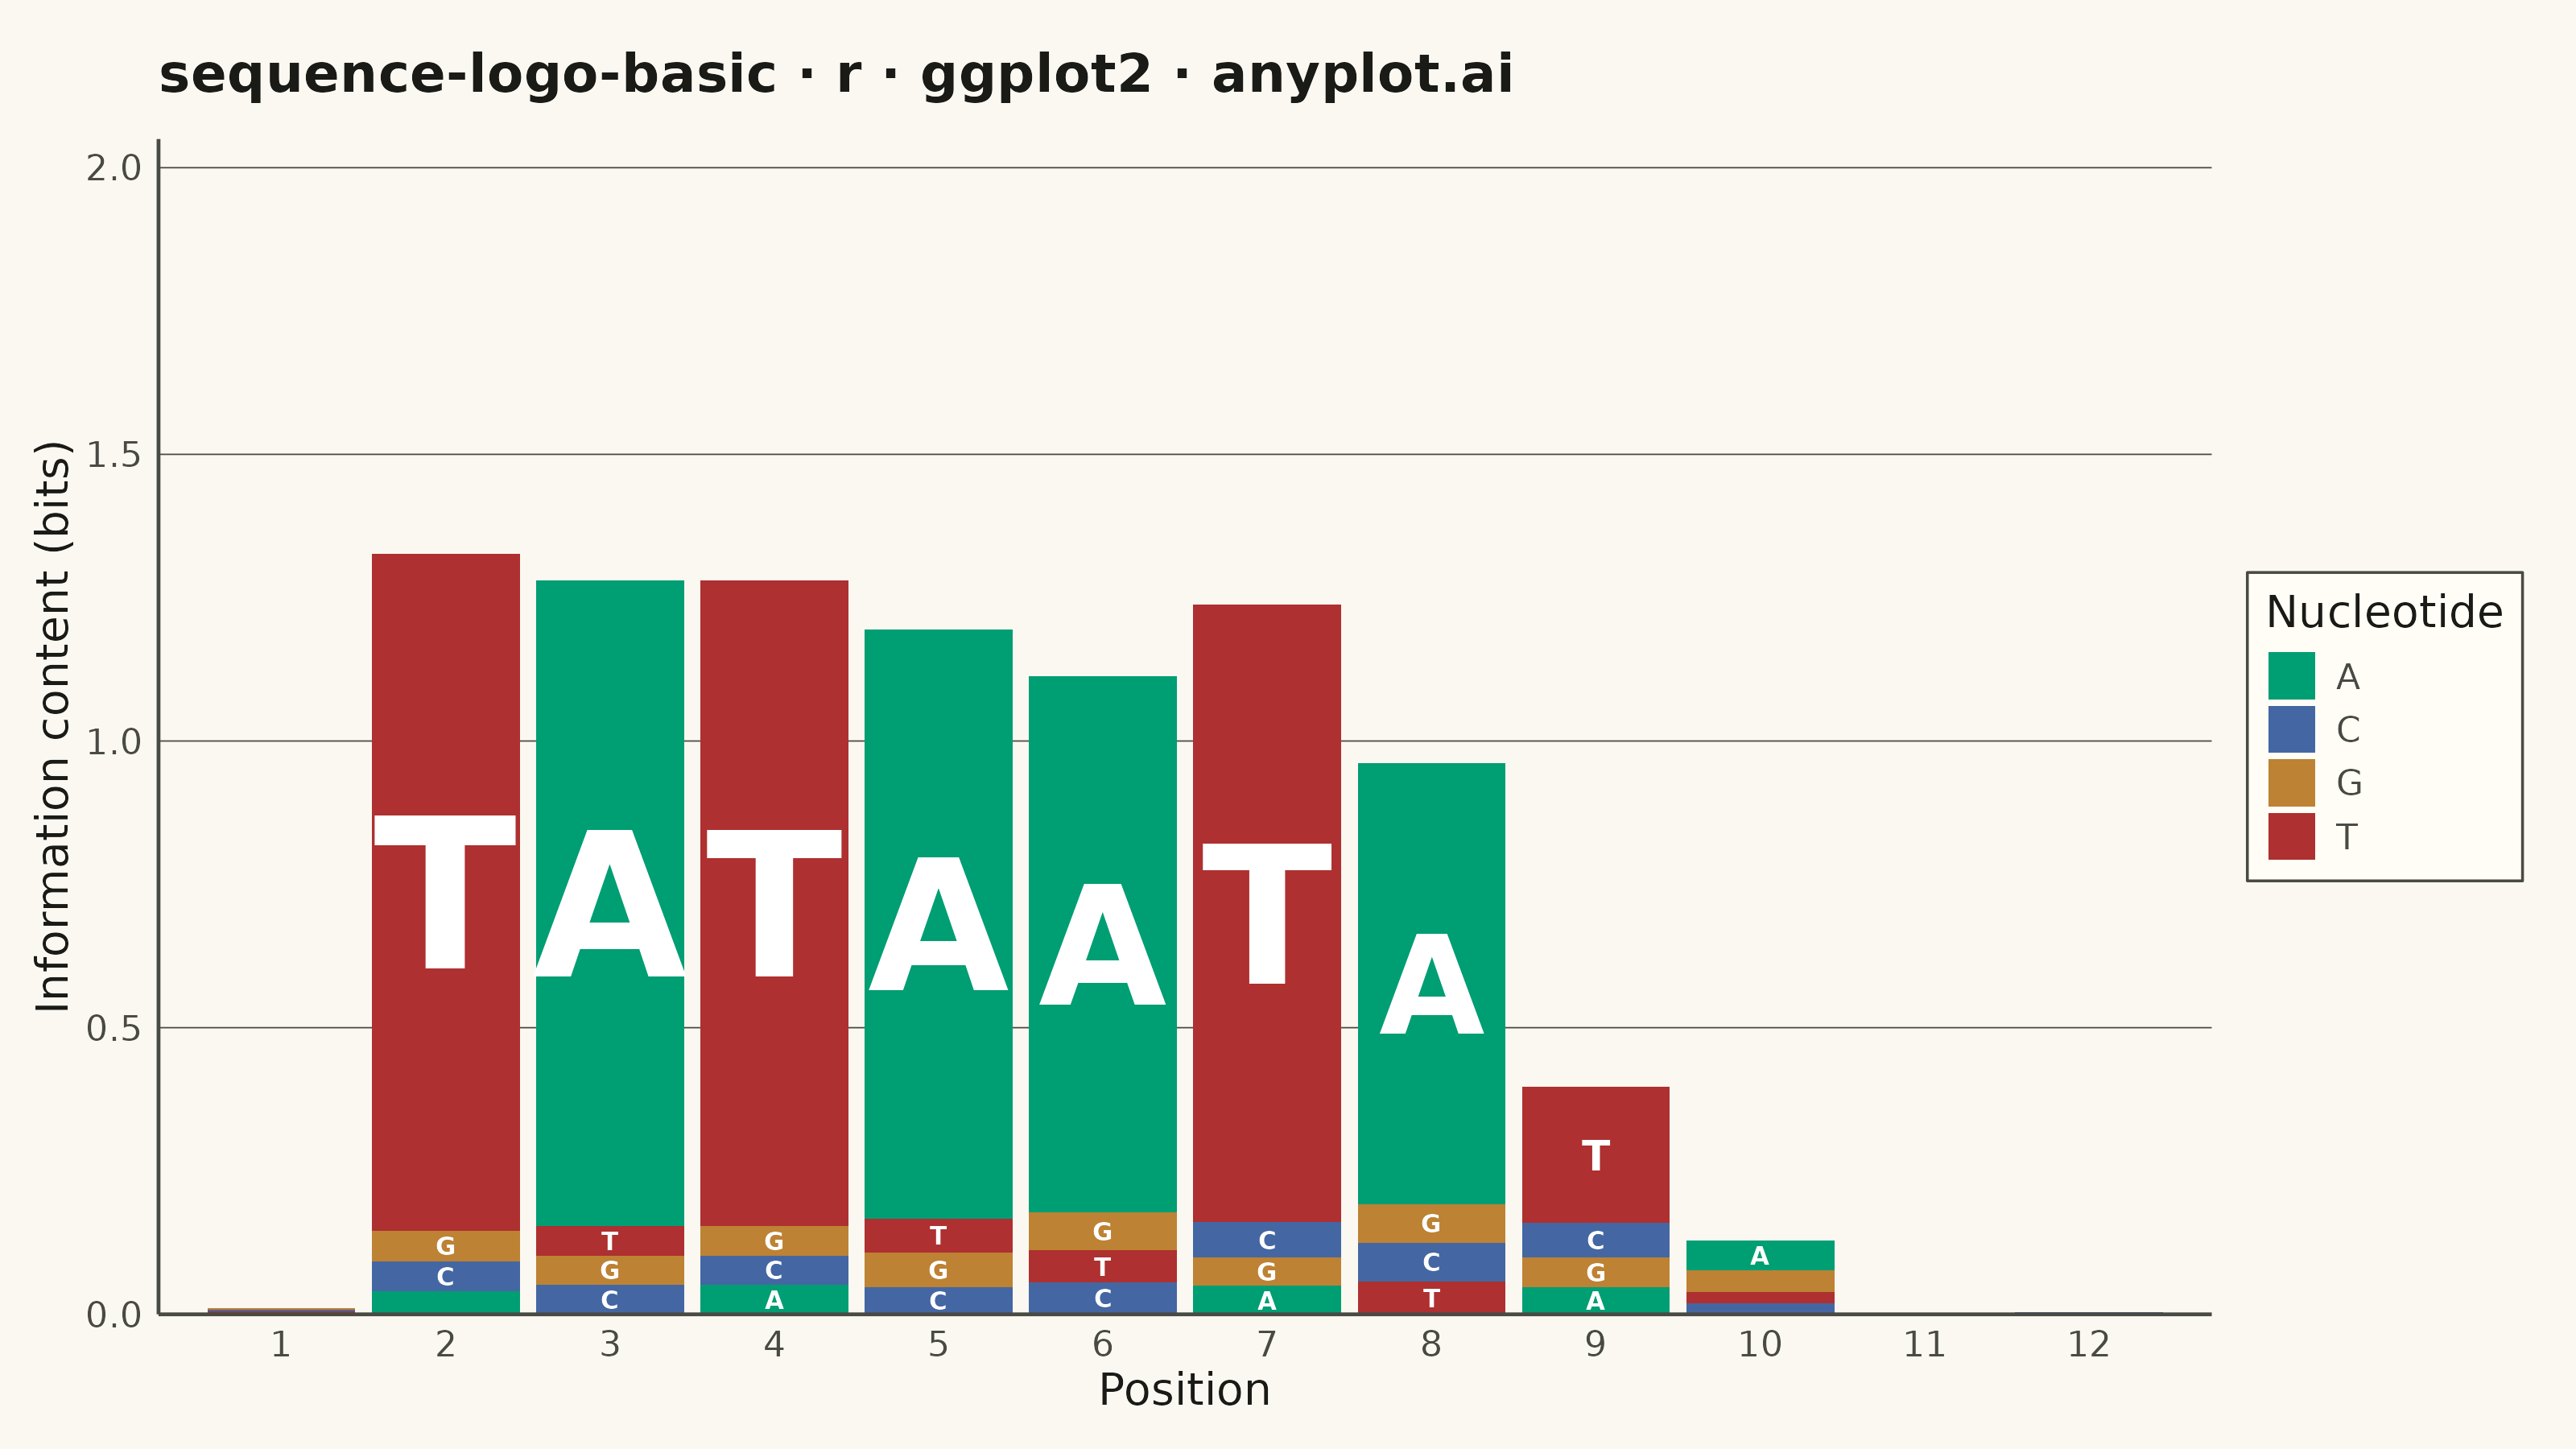
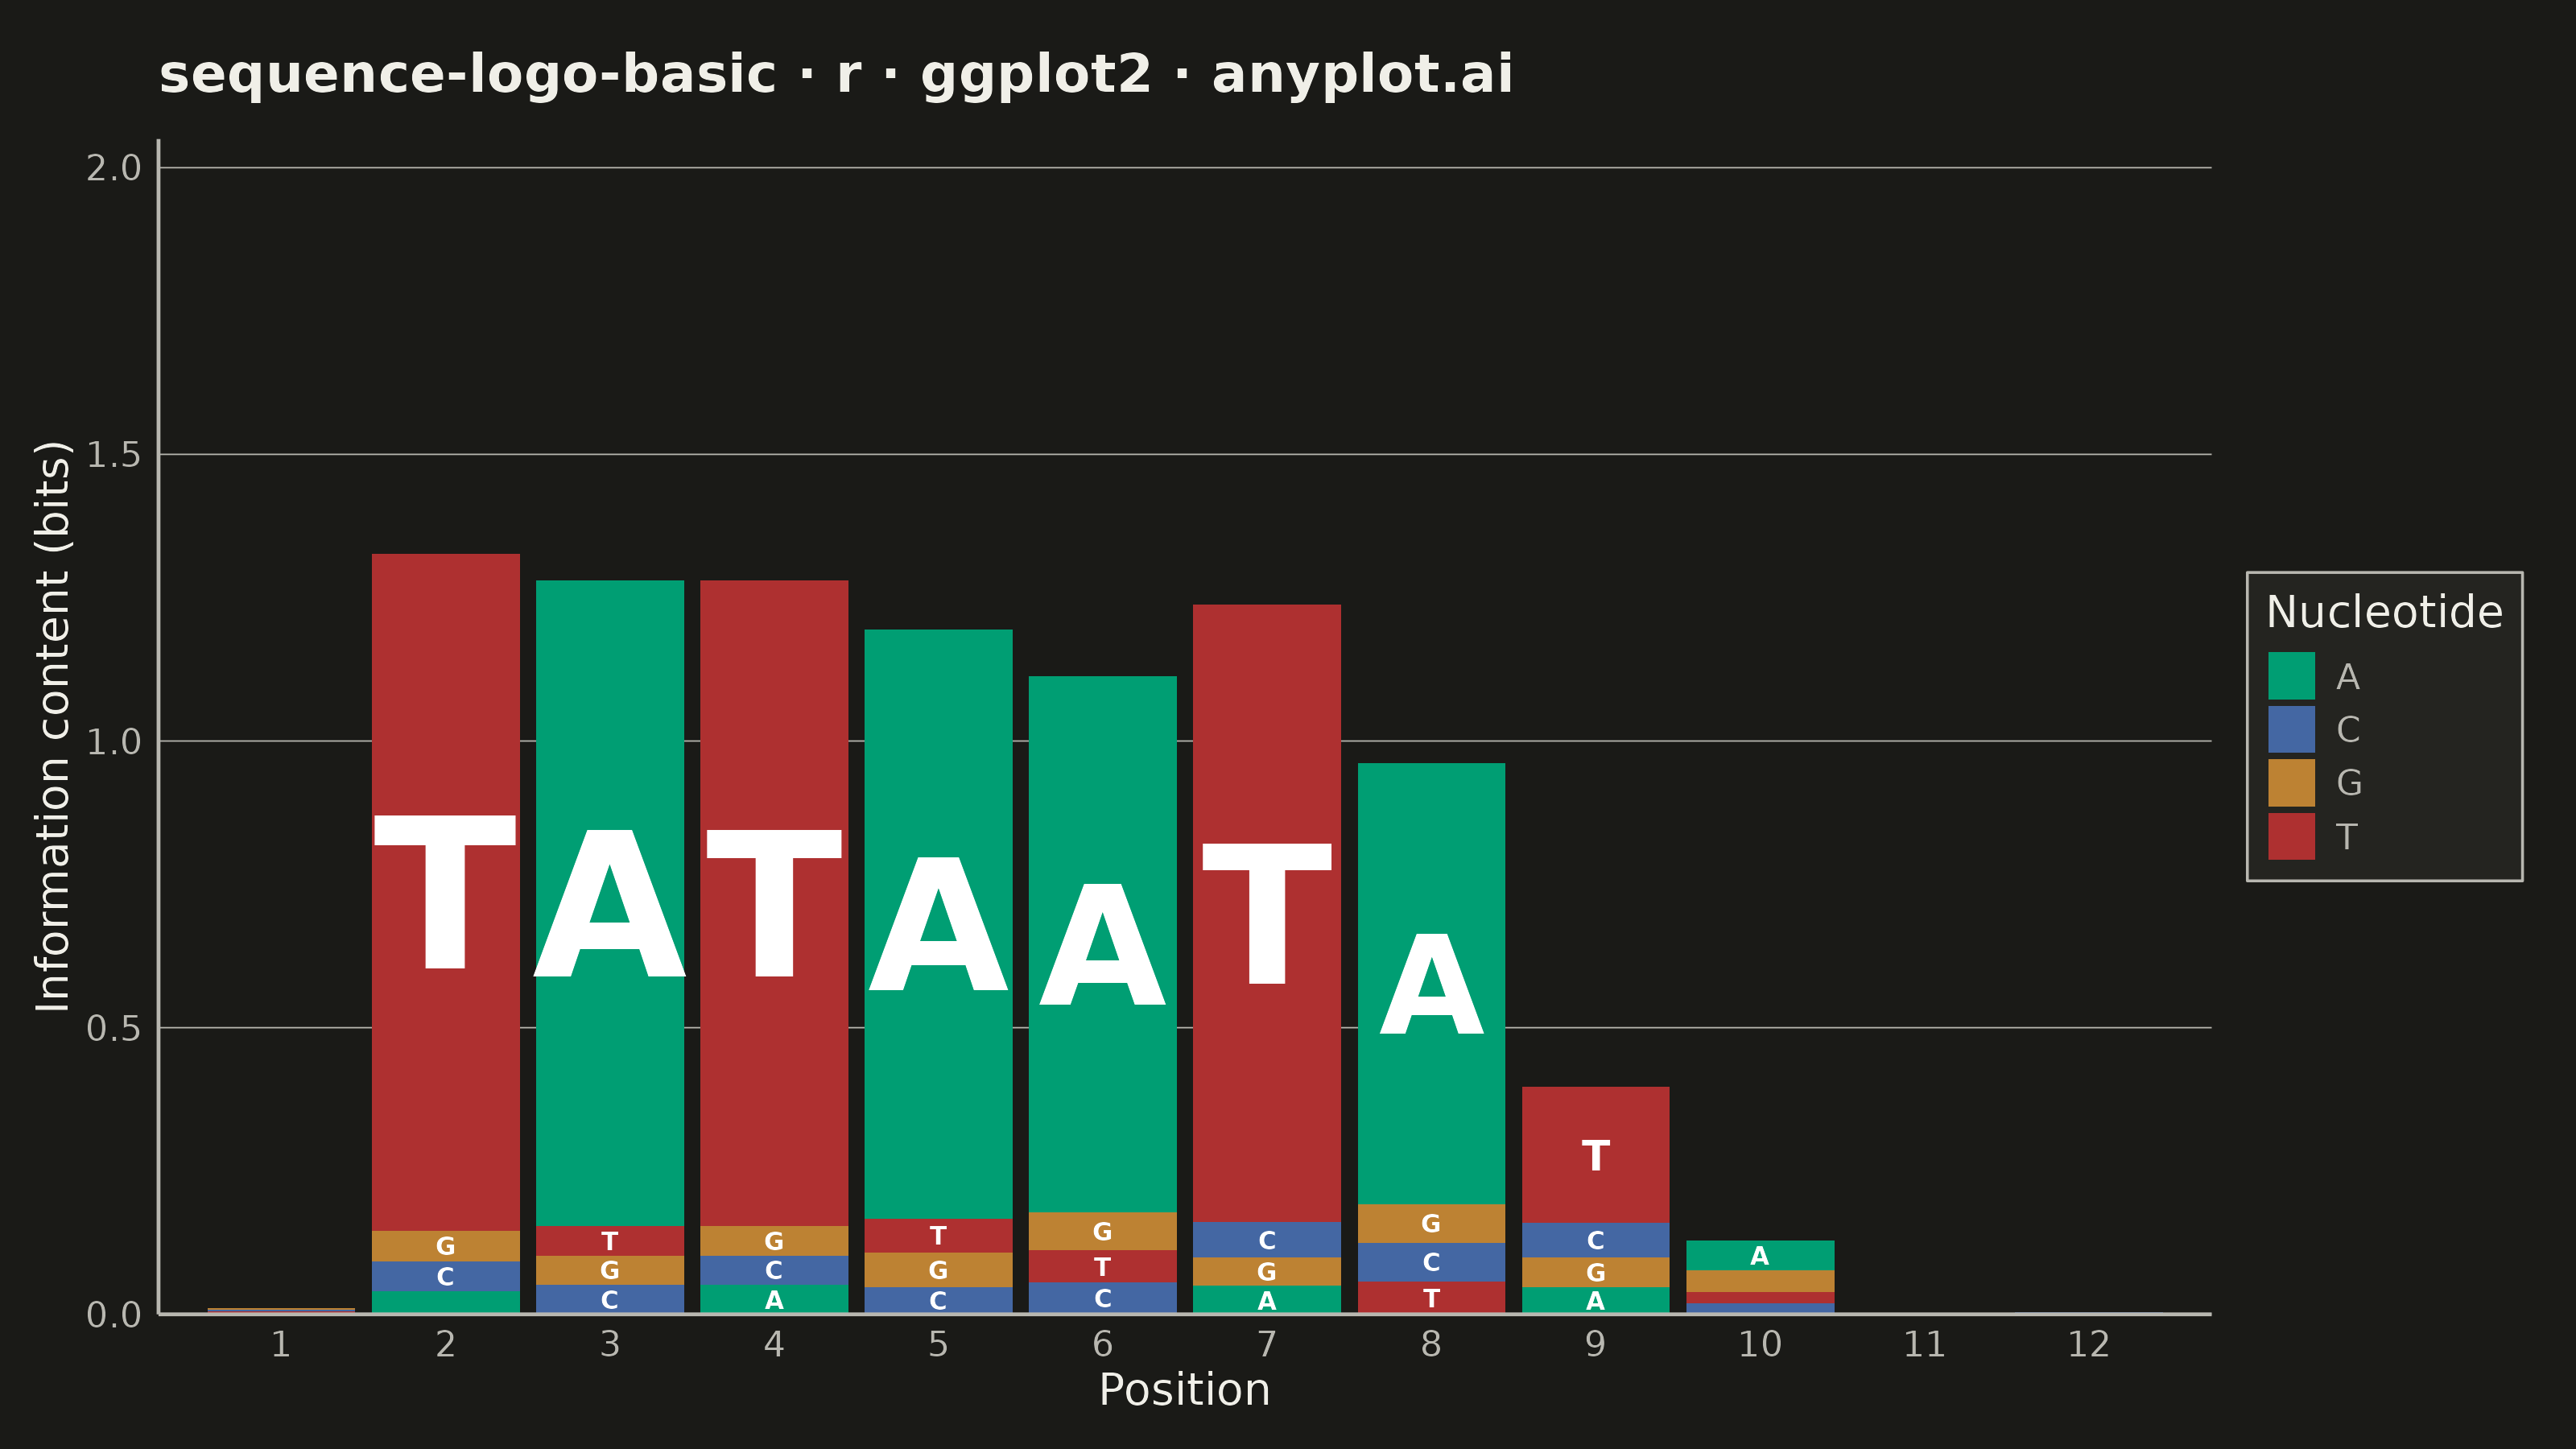
A sequence logo visualizes the consensus of multiple aligned DNA, RNA, or protein sequences. At each position, letters are stacked vertically with height proportional to information content (measured in bits), and individual letter heights within the stack reflect their relative frequency. This is the standard visualization for identifying conserved positions in transcription factor binding sites, splice sites, and protein domains.
#' anyplot.ai
#' sequence-logo-basic: Sequence Logo for Motif Visualization
#' Library: ggplot2 3.5.1 | R 4.4.1
#' Quality: 89/100 | Created: 2026-06-02

library(ggplot2)
library(dplyr)
library(ragg)

set.seed(42)

# Theme tokens
THEME       <- Sys.getenv("ANYPLOT_THEME", "light")
PAGE_BG     <- if (THEME == "light") "#FAF8F1" else "#1A1A17"
ELEVATED_BG <- if (THEME == "light") "#FFFDF6" else "#242420"
INK         <- if (THEME == "light") "#1A1A17" else "#F0EFE8"
INK_SOFT    <- if (THEME == "light") "#4A4A44" else "#B8B7B0"

# DNA color scheme — Imprint palette with semantic mapping
# Bioinformatics convention: A=green, C=blue, G=ochre/yellow, T=red
DNA_COLORS <- c(
  "A" = "#009E73",  # Imprint position 1 - green
  "C" = "#4467A3",  # Imprint position 3 - blue
  "G" = "#BD8233",  # Imprint position 4 - ochre
  "T" = "#AE3030"   # Imprint position 5 - matte red
)

# TATA-box transcription factor binding site motif (12 positions)
# Positions 2-8 represent the conserved TATAAATA core
motif_df <- data.frame(
  position = rep(1:12, each = 4),
  letter   = rep(c("A", "C", "G", "T"), times = 12),
  frequency = c(
    # Pos 1: low information (upstream flank)
    0.22, 0.28, 0.28, 0.22,
    # Pos 2: T-conserved
    0.03, 0.04, 0.04, 0.89,
    # Pos 3: A-conserved
    0.88, 0.04, 0.04, 0.04,
    # Pos 4: T-conserved
    0.04, 0.04, 0.04, 0.88,
    # Pos 5: A-conserved
    0.86, 0.04, 0.05, 0.05,
    # Pos 6: A-conserved
    0.84, 0.05, 0.06, 0.05,
    # Pos 7: T-conserved
    0.04, 0.05, 0.04, 0.87,
    # Pos 8: A-conserved
    0.80, 0.07, 0.07, 0.06,
    # Pos 9: moderate T (downstream)
    0.12, 0.15, 0.13, 0.60,
    # Pos 10: moderate A/G
    0.40, 0.15, 0.30, 0.15,
    # Pos 11: nearly uniform
    0.26, 0.24, 0.26, 0.24,
    # Pos 12: low information
    0.24, 0.28, 0.24, 0.24
  )
)

# Information content per position: IC = 2 - H, H = -sum(f * log2(f))
# Letter height within stack = frequency * IC
motif_df <- motif_df %>%
  group_by(position) %>%
  mutate(
    H      = -sum(ifelse(frequency > 0, frequency * log2(frequency), 0)),
    IC     = 2 - H,
    height = frequency * IC
  ) %>%
  ungroup() %>%
  # Sort ascending by frequency: lowest at bottom, highest on top
  arrange(position, frequency) %>%
  group_by(position) %>%
  mutate(
    y_bottom = cumsum(lag(height, default = 0)),
    y_top    = cumsum(height),
    y_mid    = (y_bottom + y_top) / 2,
    # Scale text size proportional to bar height; ~14 maps bits to mm units
    # while keeping character width within the 0.9-unit bar slot (~13mm)
    letter_size = pmax(2.0, height * 14)
  ) %>%
  ungroup()

# Title — 46 chars < 67 baseline so no size shrinkage needed
title_str <- "sequence-logo-basic · r · ggplot2 · anyplot.ai"

# Plot
p <- ggplot(motif_df) +
  geom_rect(
    aes(
      xmin = position - 0.45,
      xmax = position + 0.45,
      ymin = y_bottom,
      ymax = y_top,
      fill = letter
    ),
    color = NA
  ) +
  # Overlay letter glyphs — skips letters too small to read
  geom_text(
    data = dplyr::filter(motif_df, height > 0.04),
    aes(
      x     = position,
      y     = y_mid,
      label = letter,
      size  = letter_size
    ),
    color       = "white",
    fontface    = "bold",
    show.legend = FALSE
  ) +
  scale_fill_manual(
    values = DNA_COLORS,
    name   = "Nucleotide"
  ) +
  scale_size_identity(guide = "none") +
  scale_x_continuous(
    breaks = 1:12,
    expand = c(0.025, 0)
  ) +
  scale_y_continuous(
    limits = c(0, 2.05),
    expand = c(0, 0),
    breaks = seq(0, 2, by = 0.5)
  ) +
  labs(
    x     = "Position",
    y     = "Information content (bits)",
    title = title_str
  ) +
  theme_minimal(base_size = 8) +
  theme(
    plot.background    = element_rect(fill = PAGE_BG,    color = PAGE_BG),
    panel.background   = element_rect(fill = PAGE_BG,    color = NA),
    panel.grid.major.y = element_line(color = INK_SOFT,  linewidth = 0.15),
    panel.grid.major.x = element_blank(),
    panel.grid.minor   = element_blank(),
    panel.border       = element_blank(),
    axis.line          = element_line(color = INK_SOFT,  linewidth = 0.4),
    axis.title         = element_text(color = INK,       size = 10),
    axis.text          = element_text(color = INK_SOFT,  size = 8),
    plot.title         = element_text(color = INK,       size = 12,
                                      face = "bold", margin = margin(b = 8)),
    legend.background  = element_rect(fill = ELEVATED_BG, color = INK_SOFT,
                                      linewidth = 0.3),
    legend.text        = element_text(color = INK_SOFT,  size = 8),
    legend.title       = element_text(color = INK,       size = 10),
    legend.position    = "right",
    legend.key.size    = unit(12, "pt"),
    plot.margin        = margin(12, 12, 8, 8, "pt")
  )

# Save — ragg device, exact canvas 3200 x 1800 px
ggsave(
  filename = sprintf("plot-%s.png", THEME),
  plot     = p,
  device   = ragg::agg_png,
  width    = 8,
  height   = 4.5,
  units    = "in",
  dpi      = 400
)
Runnable source as JSON, for any HTTP client: https://api.anyplot.ai/specs/sequence-logo-basic/ggplot2/code. Any spec id and library id listed in llms-full.txt fit the same URL shape; every URL below is complete and callable.
{
  "spec_id": "sequence-logo-basic",
  "language": "r",
  "library": "ggplot2",
  "page": "https://anyplot.ai/sequence-logo-basic/r/ggplot2",
  "hub": "https://anyplot.ai/sequence-logo-basic",
  "code_json": "https://api.anyplot.ai/specs/sequence-logo-basic/ggplot2/code",
  "spec_json": "https://api.anyplot.ai/specs/sequence-logo-basic",
  "render_light_png": "https://storage.googleapis.com/anyplot-images/plots/sequence-logo-basic/r/ggplot2/plot-light.png",
  "render_dark_png": "https://storage.googleapis.com/anyplot-images/plots/sequence-logo-basic/r/ggplot2/plot-dark.png",
  "quality_score": 89.0,
  "license": "MIT",
  "guide": "https://anyplot.ai/llms.txt"
}
Part of Sequence Logo for Motif Visualization on anyplot.ai.