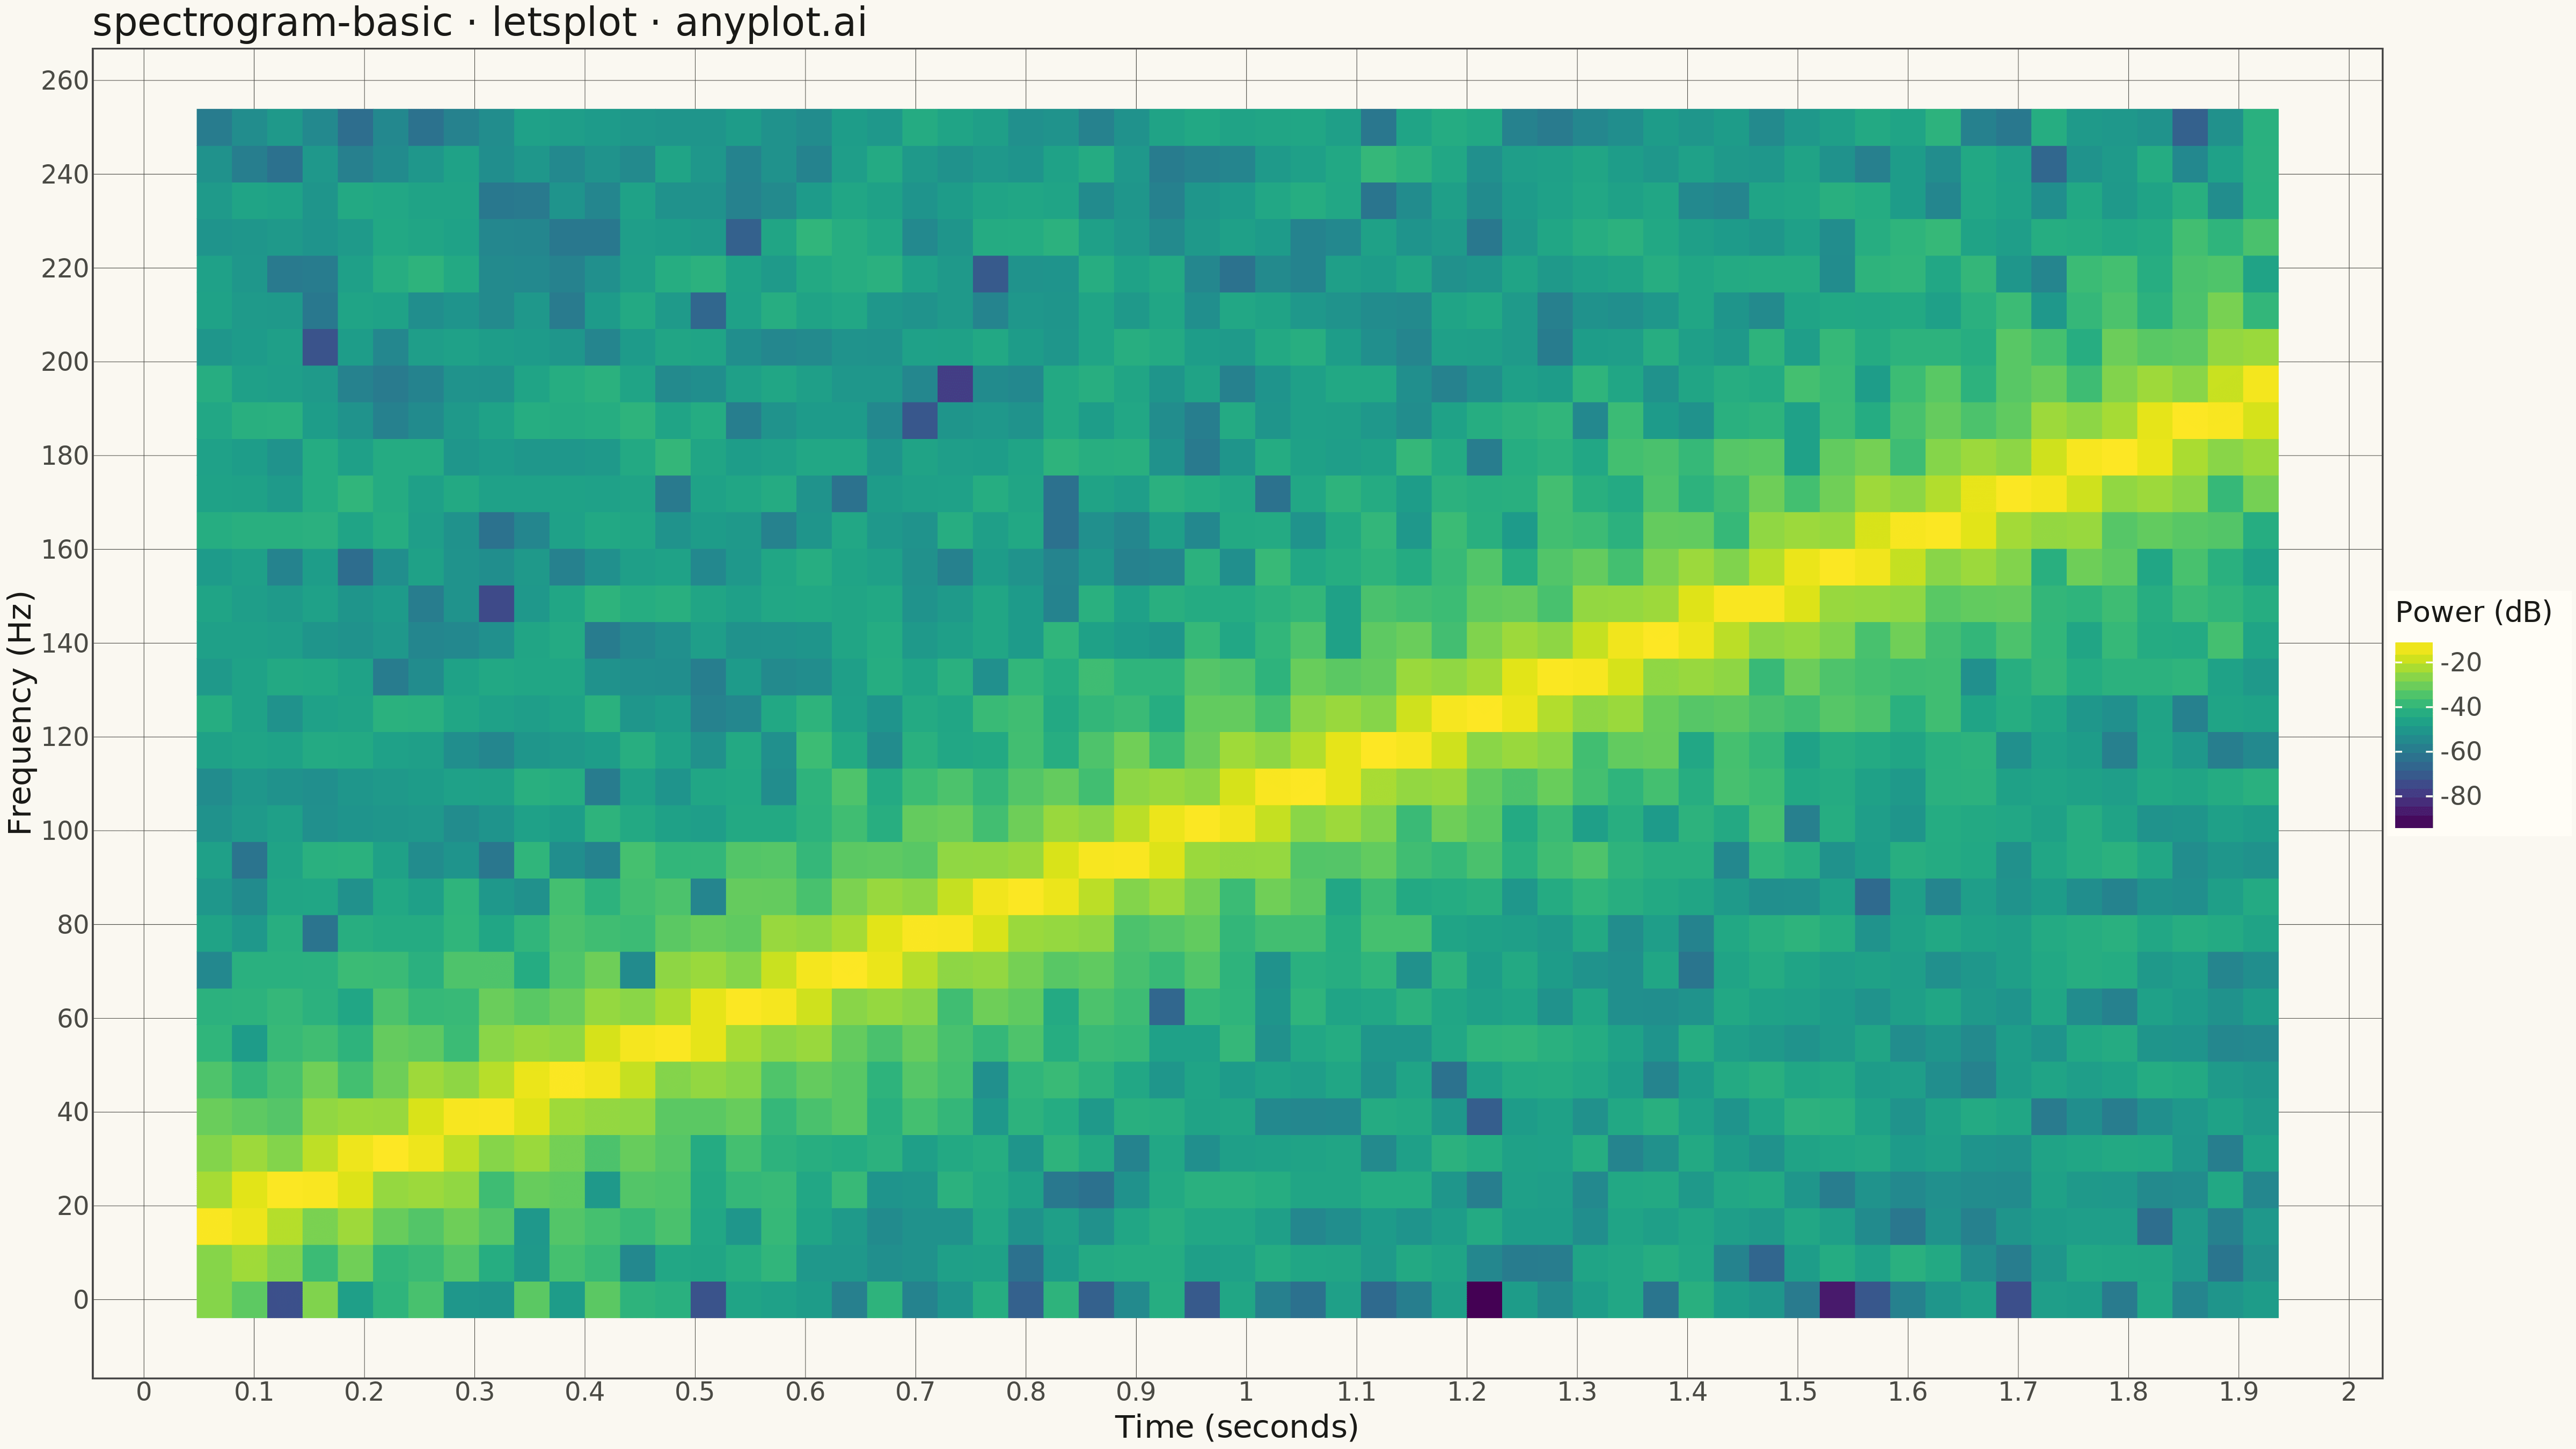
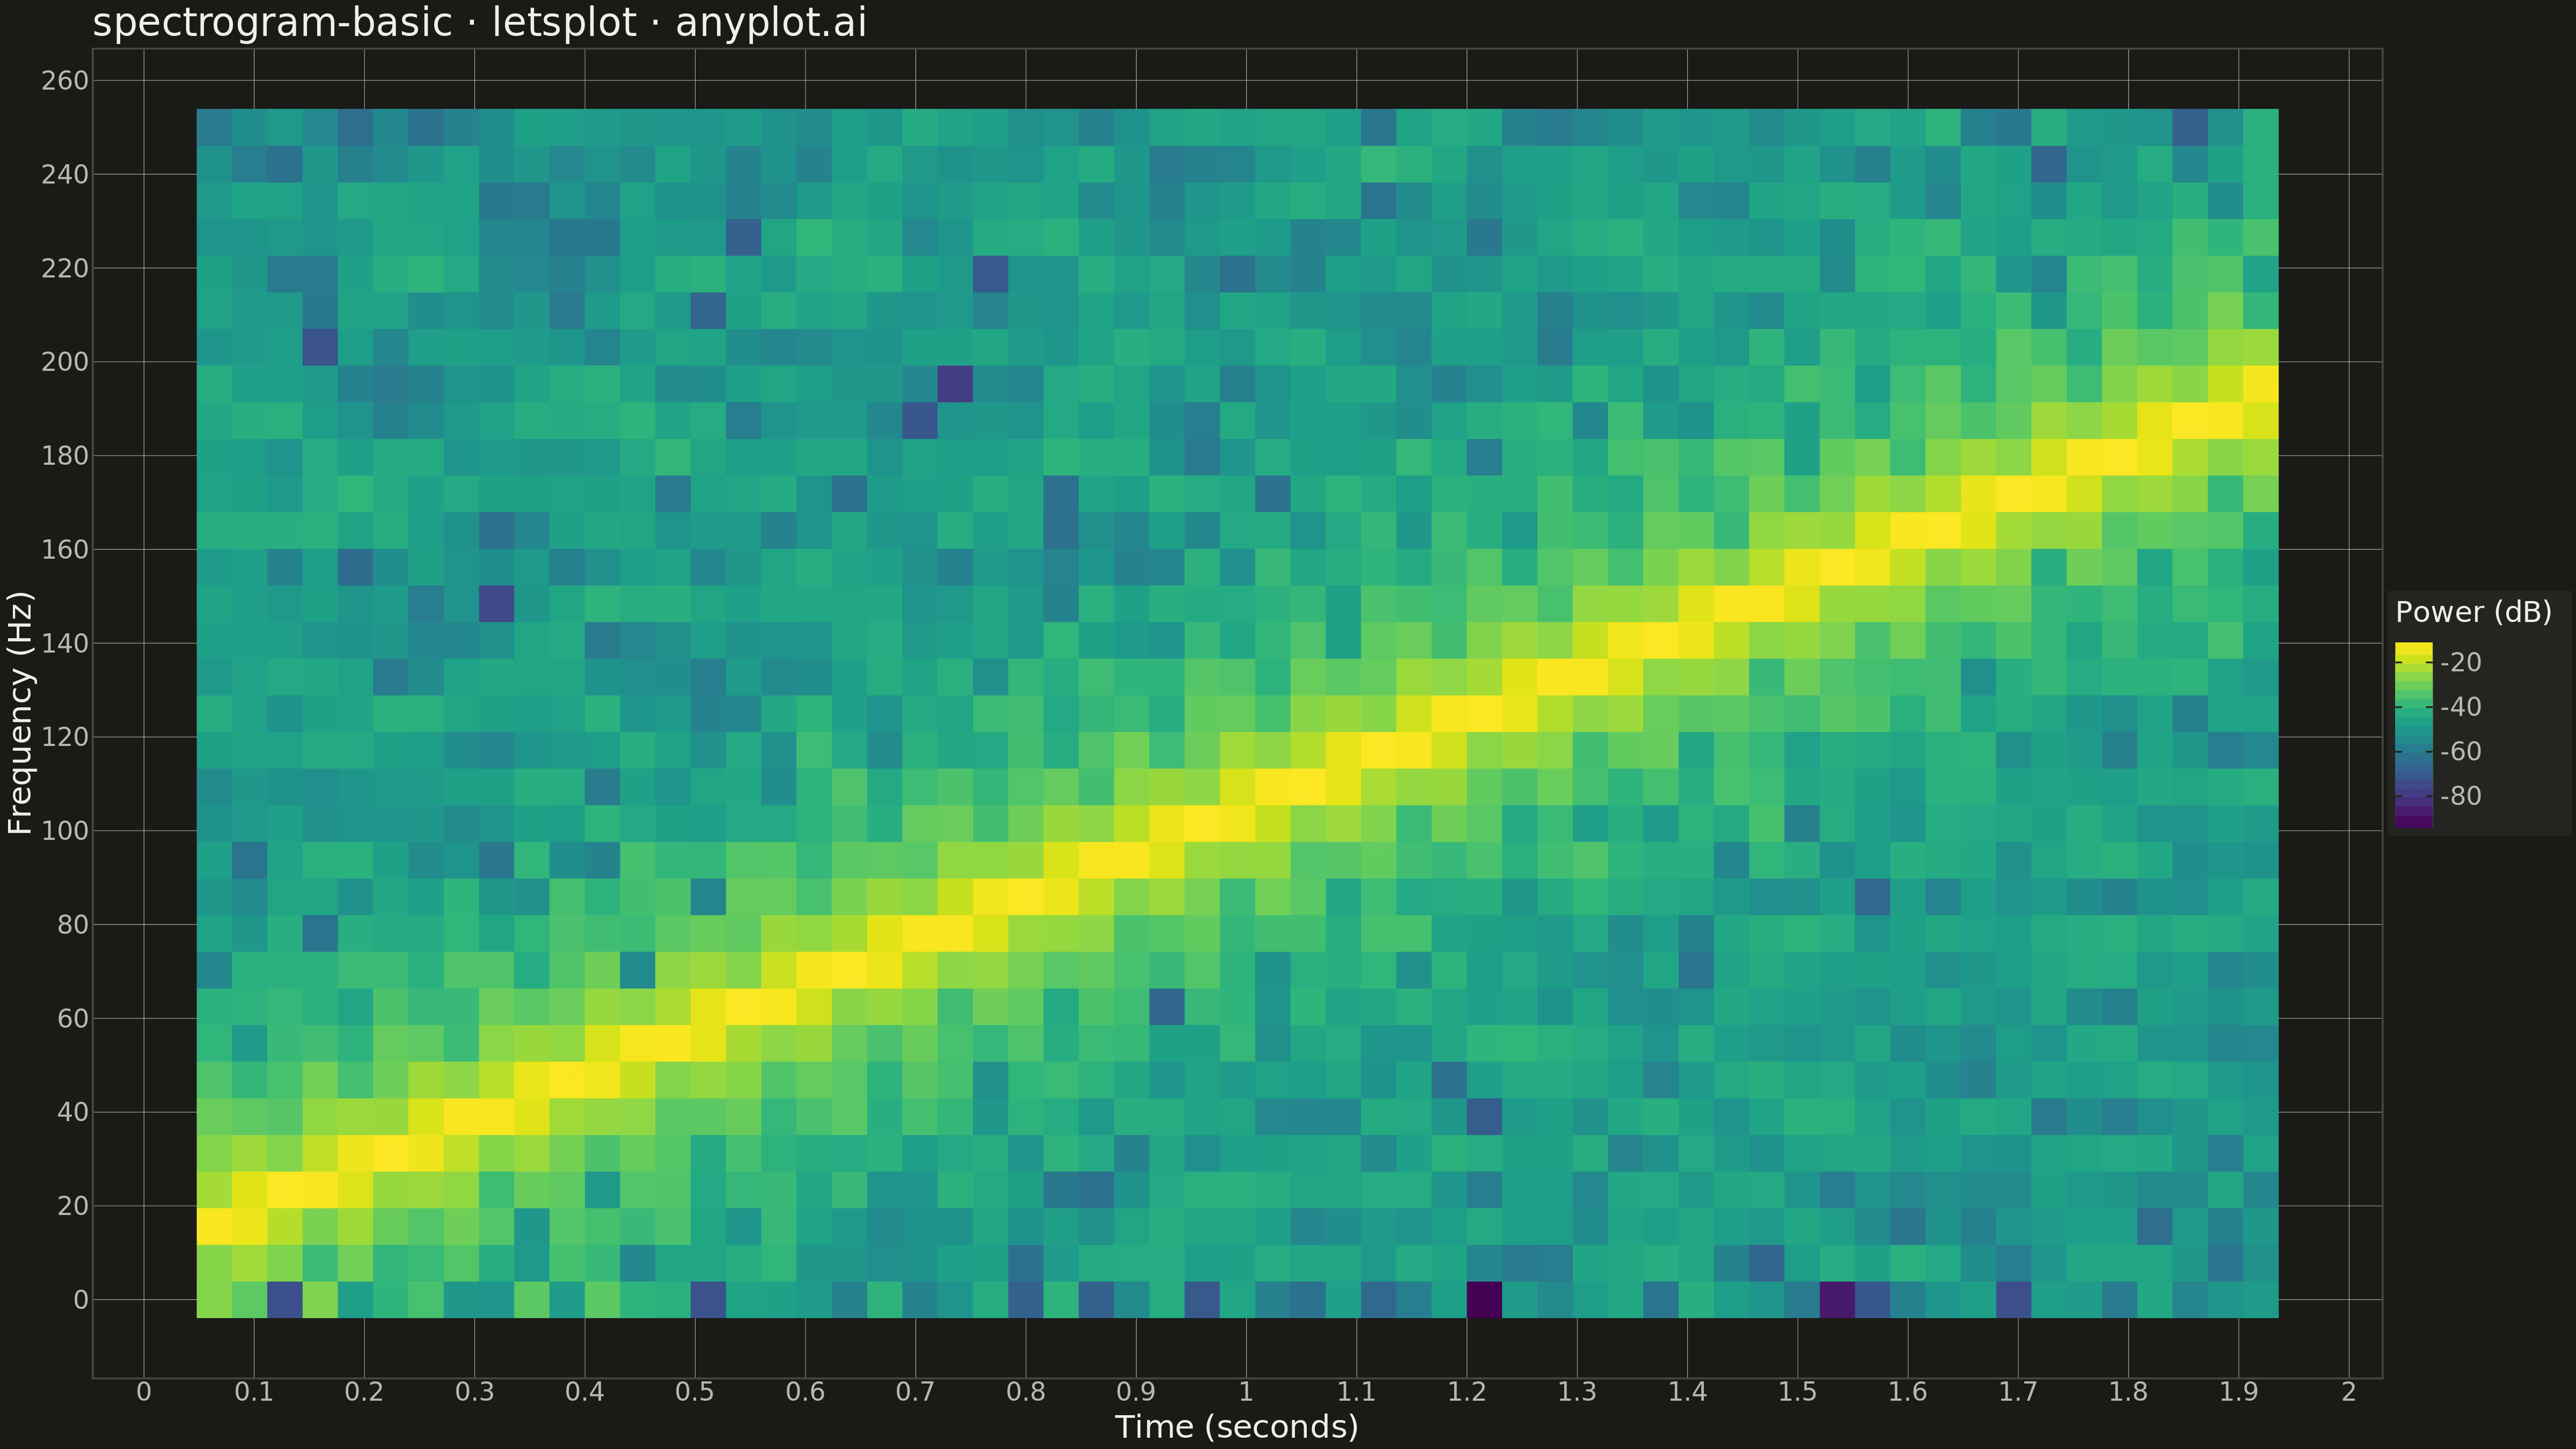
A spectrogram displaying time-frequency representation of a signal as a heatmap. It shows how the frequency content of a signal changes over time, with color intensity representing the amplitude or power at each time-frequency point. Essential for analyzing non-stationary signals where frequency characteristics vary, revealing patterns invisible in time-domain or frequency-domain views alone.
Preview render from the lets-plot implementation.