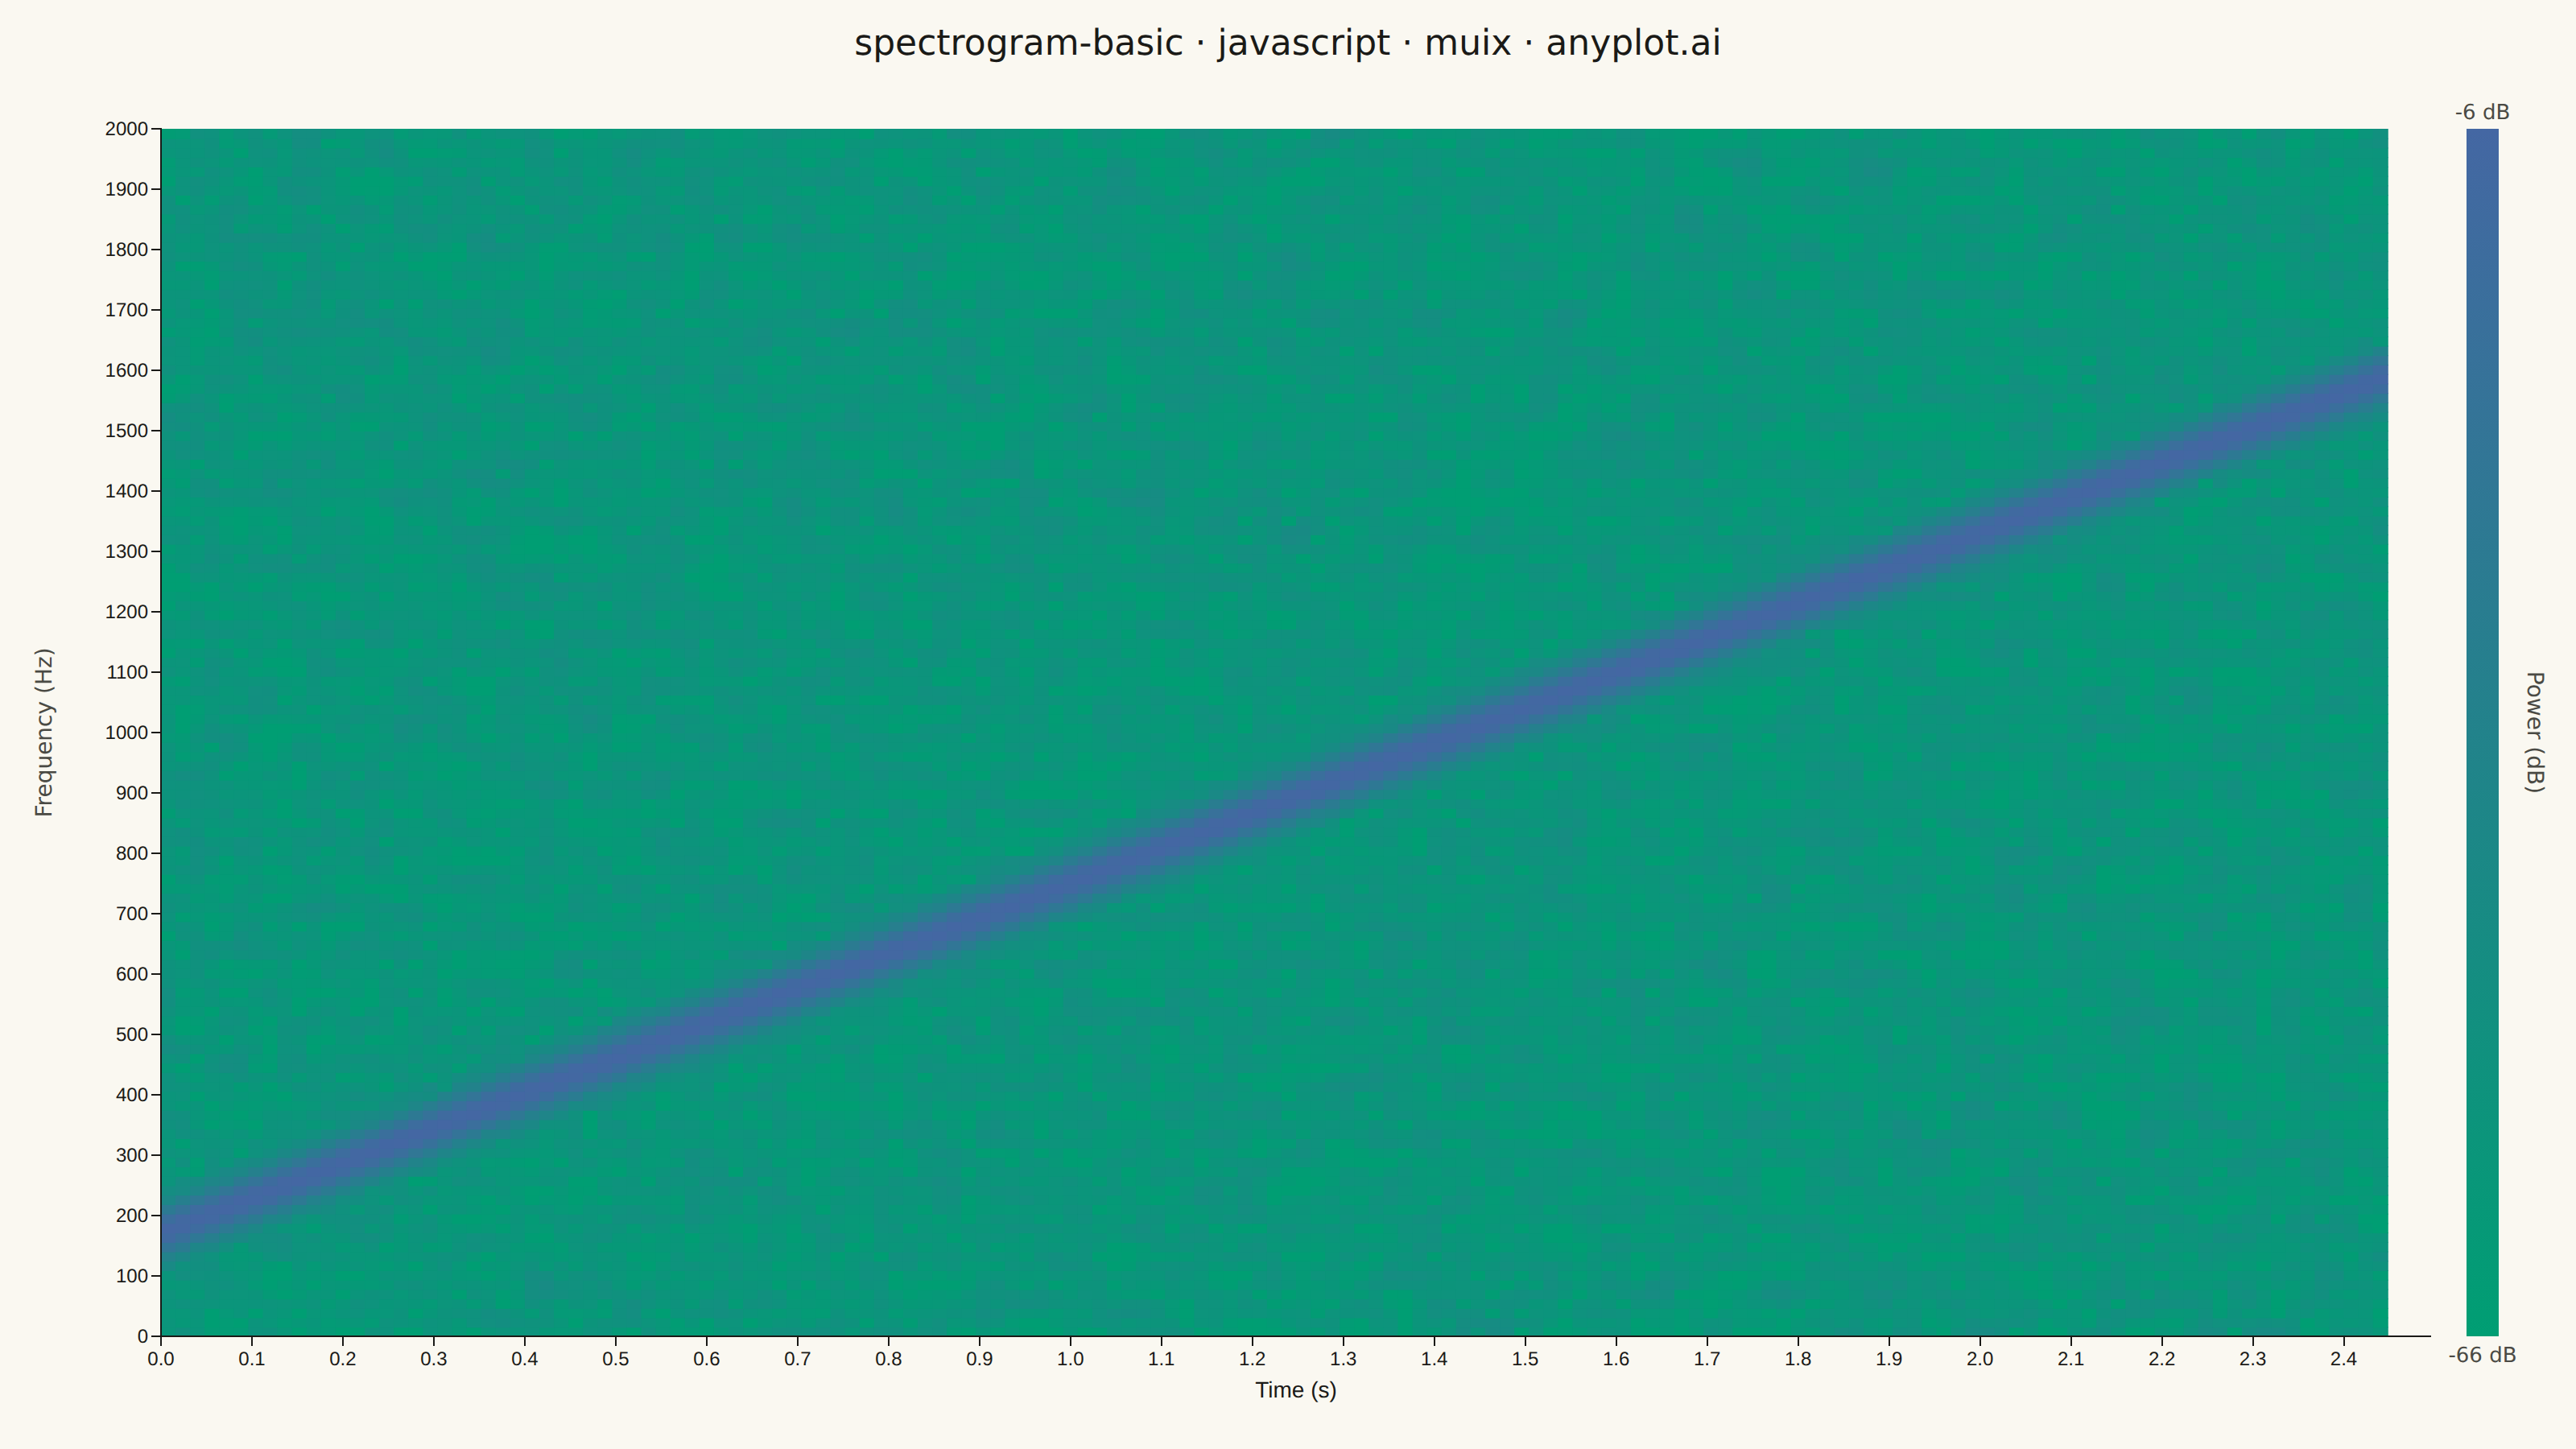
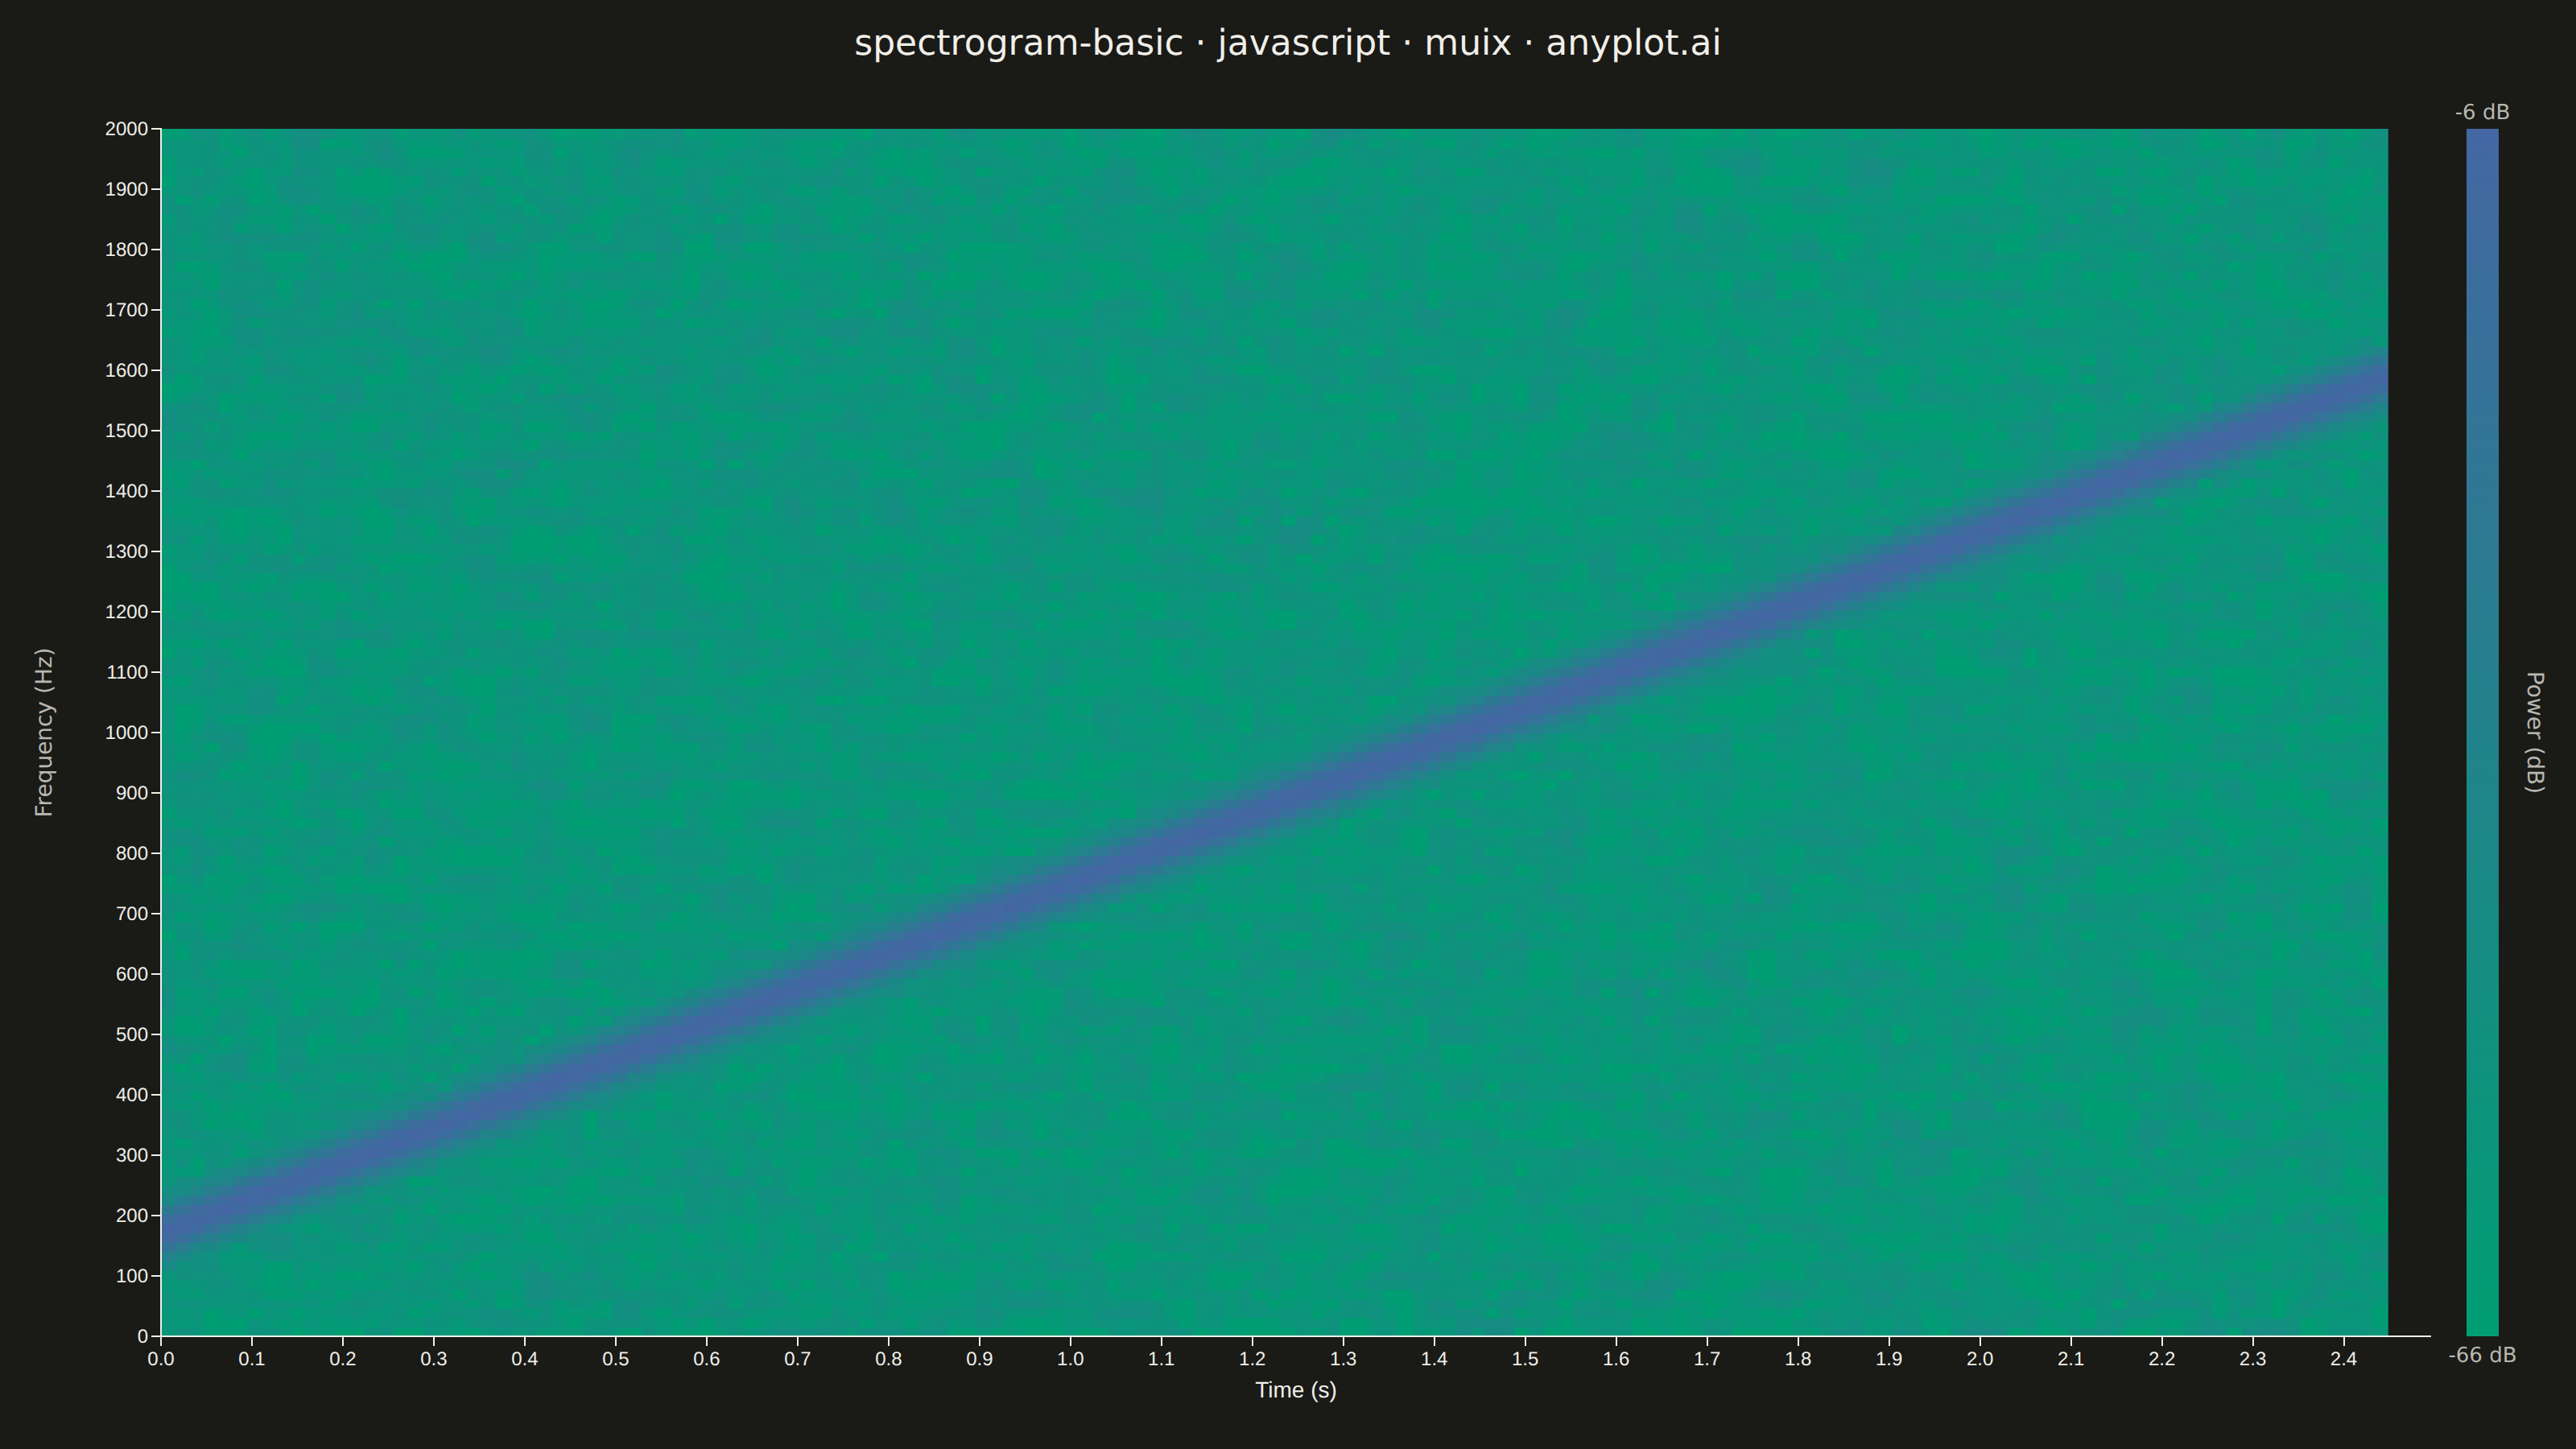
The same plot in 14 other libraries — JavaScript: Chart.js, D3.js, Apache ECharts, Highcharts; Python: Altair, Bokeh, lets-plot, Matplotlib, Plotly, plotnine, Pygal, Seaborn; R: ggplot2; Julia: Makie.jl. Compare all 15 side by side: Spectrogram Time-Frequency Heatmap in Python, R, Julia and JavaScript.
A spectrogram displaying time-frequency representation of a signal as a heatmap. It shows how the frequency content of a signal changes over time, with color intensity representing the amplitude or power at each time-frequency point. Essential for analyzing non-stationary signals where frequency characteristics vary, revealing patterns invisible in time-domain or frequency-domain views alone.
// anyplot.ai
// spectrogram-basic: Spectrogram Time-Frequency Heatmap
// Library: muix 7.29.1 | JavaScript 22.23.2
// Quality: 91/100 | Created: 2026-09-09
import { ChartContainer } from "@mui/x-charts/ChartContainer";
import { ChartsXAxis } from "@mui/x-charts/ChartsXAxis";
import { ChartsYAxis } from "@mui/x-charts/ChartsYAxis";
import { useDrawingArea, useXScale, useYScale } from "@mui/x-charts/hooks";

const t = window.ANYPLOT_TOKENS;
const { width, height } = window.ANYPLOT_SIZE;

// --- Signal (deterministic linear chirp + noise floor) ----------------------
const SAMPLE_RATE = 4000; // Hz
const DURATION = 2.5; // seconds
const N_SAMPLES = SAMPLE_RATE * DURATION; // 10000 samples
const F_START = 150; // Hz — chirp start frequency
const F_END = 1600; // Hz — chirp end frequency (within Nyquist)

// Deterministic LCG seeded at 42 (no Math.random — must be reproducible)
function makeLCG(seed) {
  let s = seed >>> 0;
  return () => {
    s = ((s * 1664525) >>> 0) + 1013904223 >>> 0;
    return s / 0x100000000;
  };
}
const rand = makeLCG(42);

const signal = new Float64Array(N_SAMPLES);
for (let n = 0; n < N_SAMPLES; n++) {
  const time = n / SAMPLE_RATE;
  const phase = 2 * Math.PI * (F_START * time + ((F_END - F_START) / (2 * DURATION)) * time * time);
  signal[n] = Math.sin(phase) + (rand() - 0.5) * 0.08;
}

// --- Short-Time Fourier Transform (iterative radix-2 Cooley-Tukey) ----------
const WINDOW = 256; // samples per frame (power of 2)
const HOP = 64; // samples between frame starts (WINDOW / 4, for finer time resolution)
const FREQ_BINS = WINDOW / 2; // one-sided spectrum bins
const TIME_STEP = HOP / SAMPLE_RATE; // seconds per frame
const FREQ_STEP = SAMPLE_RATE / WINDOW; // Hz per bin
const N_FRAMES = Math.floor((N_SAMPLES - WINDOW) / HOP) + 1;

// Hann window
const hann = Array.from({ length: WINDOW }, (_, n) => 0.5 - 0.5 * Math.cos((2 * Math.PI * n) / (WINDOW - 1)));

function fft(re, im) {
  const n = re.length;
  for (let i = 1, j = 0; i < n; i++) {
    let bit = n >> 1;
    for (; j & bit; bit >>= 1) j ^= bit;
    j ^= bit;
    if (i < j) {
      [re[i], re[j]] = [re[j], re[i]];
      [im[i], im[j]] = [im[j], im[i]];
    }
  }
  for (let len = 2; len <= n; len <<= 1) {
    const ang = (-2 * Math.PI) / len;
    const wr = Math.cos(ang);
    const wi = Math.sin(ang);
    for (let i = 0; i < n; i += len) {
      let curWr = 1;
      let curWi = 0;
      for (let j = 0; j < len / 2; j++) {
        const ur = re[i + j];
        const ui = im[i + j];
        const vr = re[i + j + len / 2] * curWr - im[i + j + len / 2] * curWi;
        const vi = re[i + j + len / 2] * curWi + im[i + j + len / 2] * curWr;
        re[i + j] = ur + vr;
        im[i + j] = ui + vi;
        re[i + j + len / 2] = ur - vr;
        im[i + j + len / 2] = ui - vi;
        const nextWr = curWr * wr - curWi * wi;
        curWi = curWr * wi + curWi * wr;
        curWr = nextWr;
      }
    }
  }
}

// power[frame][bin] in dB
const power = [];
let maxDb = -Infinity;
for (let f = 0; f < N_FRAMES; f++) {
  const start = f * HOP;
  const re = new Float64Array(WINDOW);
  const im = new Float64Array(WINDOW);
  for (let n = 0; n < WINDOW; n++) re[n] = signal[start + n] * hann[n];
  fft(re, im);
  const row = new Float64Array(FREQ_BINS);
  for (let k = 0; k < FREQ_BINS; k++) {
    const mag = (2 / WINDOW) * Math.sqrt(re[k] * re[k] + im[k] * im[k]);
    const db = 20 * Math.log10(mag + 1e-9);
    row[k] = db;
    if (db > maxDb) maxDb = db;
  }
  power.push(row);
}
const MIN_DB = maxDb - 60; // wide enough to keep noise-floor texture visible instead of clipping to solid green
const MAX_DB = maxDb;
const TOTAL_SEC = ((N_FRAMES - 1) * HOP + WINDOW) / SAMPLE_RATE;

// Imprint sequential colormap: seq[0]=brand green → seq[1]=blue
function hexRgb(h) {
  return [parseInt(h.slice(1, 3), 16), parseInt(h.slice(3, 5), 16), parseInt(h.slice(5, 7), 16)];
}
function seqColor(norm) {
  const v = Math.min(1, Math.max(0, norm));
  const [r1, g1, b1] = hexRgb(t.seq[0]);
  const [r2, g2, b2] = hexRgb(t.seq[1]);
  return `rgb(${Math.round(r1 + (r2 - r1) * v)},${Math.round(g1 + (g2 - g1) * v)},${Math.round(b1 + (b2 - b1) * v)})`;
}

// Spectrogram cells, drawn as a filled time-frequency grid using MUI X scale hooks
function SpectrogramCells() {
  const xScale = useXScale();
  const yScale = useYScale();

  return (
    <>
      {power.flatMap((row, f) =>
        Array.from(row).map((db, k) => {
          const norm = (db - MIN_DB) / (MAX_DB - MIN_DB);
          const x0 = xScale(f * TIME_STEP);
          const x1 = xScale((f + 1) * TIME_STEP);
          const yTop = yScale((k + 1) * FREQ_STEP);
          const yBottom = yScale(k * FREQ_STEP);
          return (
            <rect
              key={`${f}-${k}`}
              x={x0}
              y={yTop}
              width={x1 - x0 + 0.5}
              height={yBottom - yTop + 0.5}
              fill={seqColor(norm)}
            />
          );
        })
      )}
    </>
  );
}

// Colorbar gradient (power in dB) using drawing-area position from MUI X context
function Colorbar() {
  const { left, top, width: gW, height: gH } = useDrawingArea();
  const cbX = left + gW + 22;
  const cbW = 20;

  return (
    <>
      <defs>
        <linearGradient id="cbGrad" x1="0" y1="1" x2="0" y2="0">
          <stop offset="0%" stopColor={t.seq[0]} />
          <stop offset="100%" stopColor={t.seq[1]} />
        </linearGradient>
      </defs>
      <rect x={cbX} y={top} width={cbW} height={gH} fill="url(#cbGrad)" />
      <text x={cbX + cbW / 2} y={top - 6} textAnchor="middle" fontSize={13} fill={t.inkSoft} fontFamily="Inter, system-ui, sans-serif">
        {Math.round(MAX_DB)} dB
      </text>
      <text x={cbX + cbW / 2} y={top + gH + 16} textAnchor="middle" fontSize={13} fill={t.inkSoft} fontFamily="Inter, system-ui, sans-serif">
        {Math.round(MIN_DB)} dB
      </text>
      <text
        x={cbX + cbW + 18}
        y={top + gH / 2}
        textAnchor="middle"
        fontSize={14}
        fill={t.inkSoft}
        fontFamily="Inter, system-ui, sans-serif"
        transform={`rotate(90, ${cbX + cbW + 18}, ${top + gH / 2})`}
      >
        Power (dB)
      </text>
    </>
  );
}

function ChartTitle() {
  const { top } = useDrawingArea();
  return (
    <text x={width / 2} y={top - 46} textAnchor="middle" fontSize={22} fontWeight={500} fill={t.ink} fontFamily="Inter, system-ui, sans-serif">
      spectrogram-basic · javascript · muix · anyplot.ai
    </text>
  );
}

// Custom y-axis label — drawn manually (instead of ChartsYAxis's built-in `label`)
// so its fixed inner offset never collides with the 4-digit "2000"-style tick labels.
function YAxisLabel() {
  const { left, top, height: gH } = useDrawingArea();
  const x = left - 68;
  const y = top + gH / 2;
  return (
    <text x={x} y={y} textAnchor="middle" fontSize={14} fill={t.inkSoft} fontFamily="Inter, system-ui, sans-serif" transform={`rotate(-90, ${x}, ${y})`}>
      Frequency (Hz)
    </text>
  );
}

export default function Chart() {
  return (
    <ChartContainer
      width={width}
      height={height}
      series={[]}
      xAxis={[
        {
          scaleType: "linear",
          min: 0,
          max: TOTAL_SEC,
          label: "Time (s)",
          valueFormatter: (v) => `${v.toFixed(1)}`,
        },
      ]}
      yAxis={[
        {
          scaleType: "linear",
          min: 0,
          max: FREQ_BINS * FREQ_STEP,
          valueFormatter: (v) => `${Math.round(v)}`,
        },
      ]}
      margin={{ left: 100, right: 90, top: 80, bottom: 70 }}
    >
      <ChartTitle />
      <SpectrogramCells />
      <Colorbar />
      <ChartsXAxis />
      <ChartsYAxis />
      <YAxisLabel />
    </ChartContainer>
  );
}
Runnable source as JSON, for any HTTP client: https://api.anyplot.ai/specs/spectrogram-basic/muix/code. Any spec id and library id listed in llms-full.txt fit the same URL shape; every URL below is complete and callable.
{
  "spec_id": "spectrogram-basic",
  "language": "javascript",
  "library": "muix",
  "page": "https://anyplot.ai/spectrogram-basic/javascript/muix",
  "hub": "https://anyplot.ai/spectrogram-basic",
  "code_json": "https://api.anyplot.ai/specs/spectrogram-basic/muix/code",
  "spec_json": "https://api.anyplot.ai/specs/spectrogram-basic",
  "render_light_png": "https://storage.googleapis.com/anyplot-images/plots/spectrogram-basic/javascript/muix/plot-light.png",
  "render_dark_png": "https://storage.googleapis.com/anyplot-images/plots/spectrogram-basic/javascript/muix/plot-dark.png",
  "interactive_light_html": "https://storage.googleapis.com/anyplot-images/plots/spectrogram-basic/javascript/muix/plot-light.html",
  "interactive_dark_html": "https://storage.googleapis.com/anyplot-images/plots/spectrogram-basic/javascript/muix/plot-dark.html",
  "quality_score": 91.0,
  "license": "MIT",
  "guide": "https://anyplot.ai/llms.txt"
}
Part of Spectrogram Time-Frequency Heatmap on anyplot.ai.