The same plot in 14 other libraries — JavaScript: D3.js, Apache ECharts, Highcharts, MUI X Charts; Python: Altair, Bokeh, lets-plot, Matplotlib, Plotly, plotnine, Pygal, Seaborn; R: ggplot2; Julia: Makie.jl. Compare all 15 side by side: Spectrogram Time-Frequency Heatmap in Python, R, Julia and JavaScript.
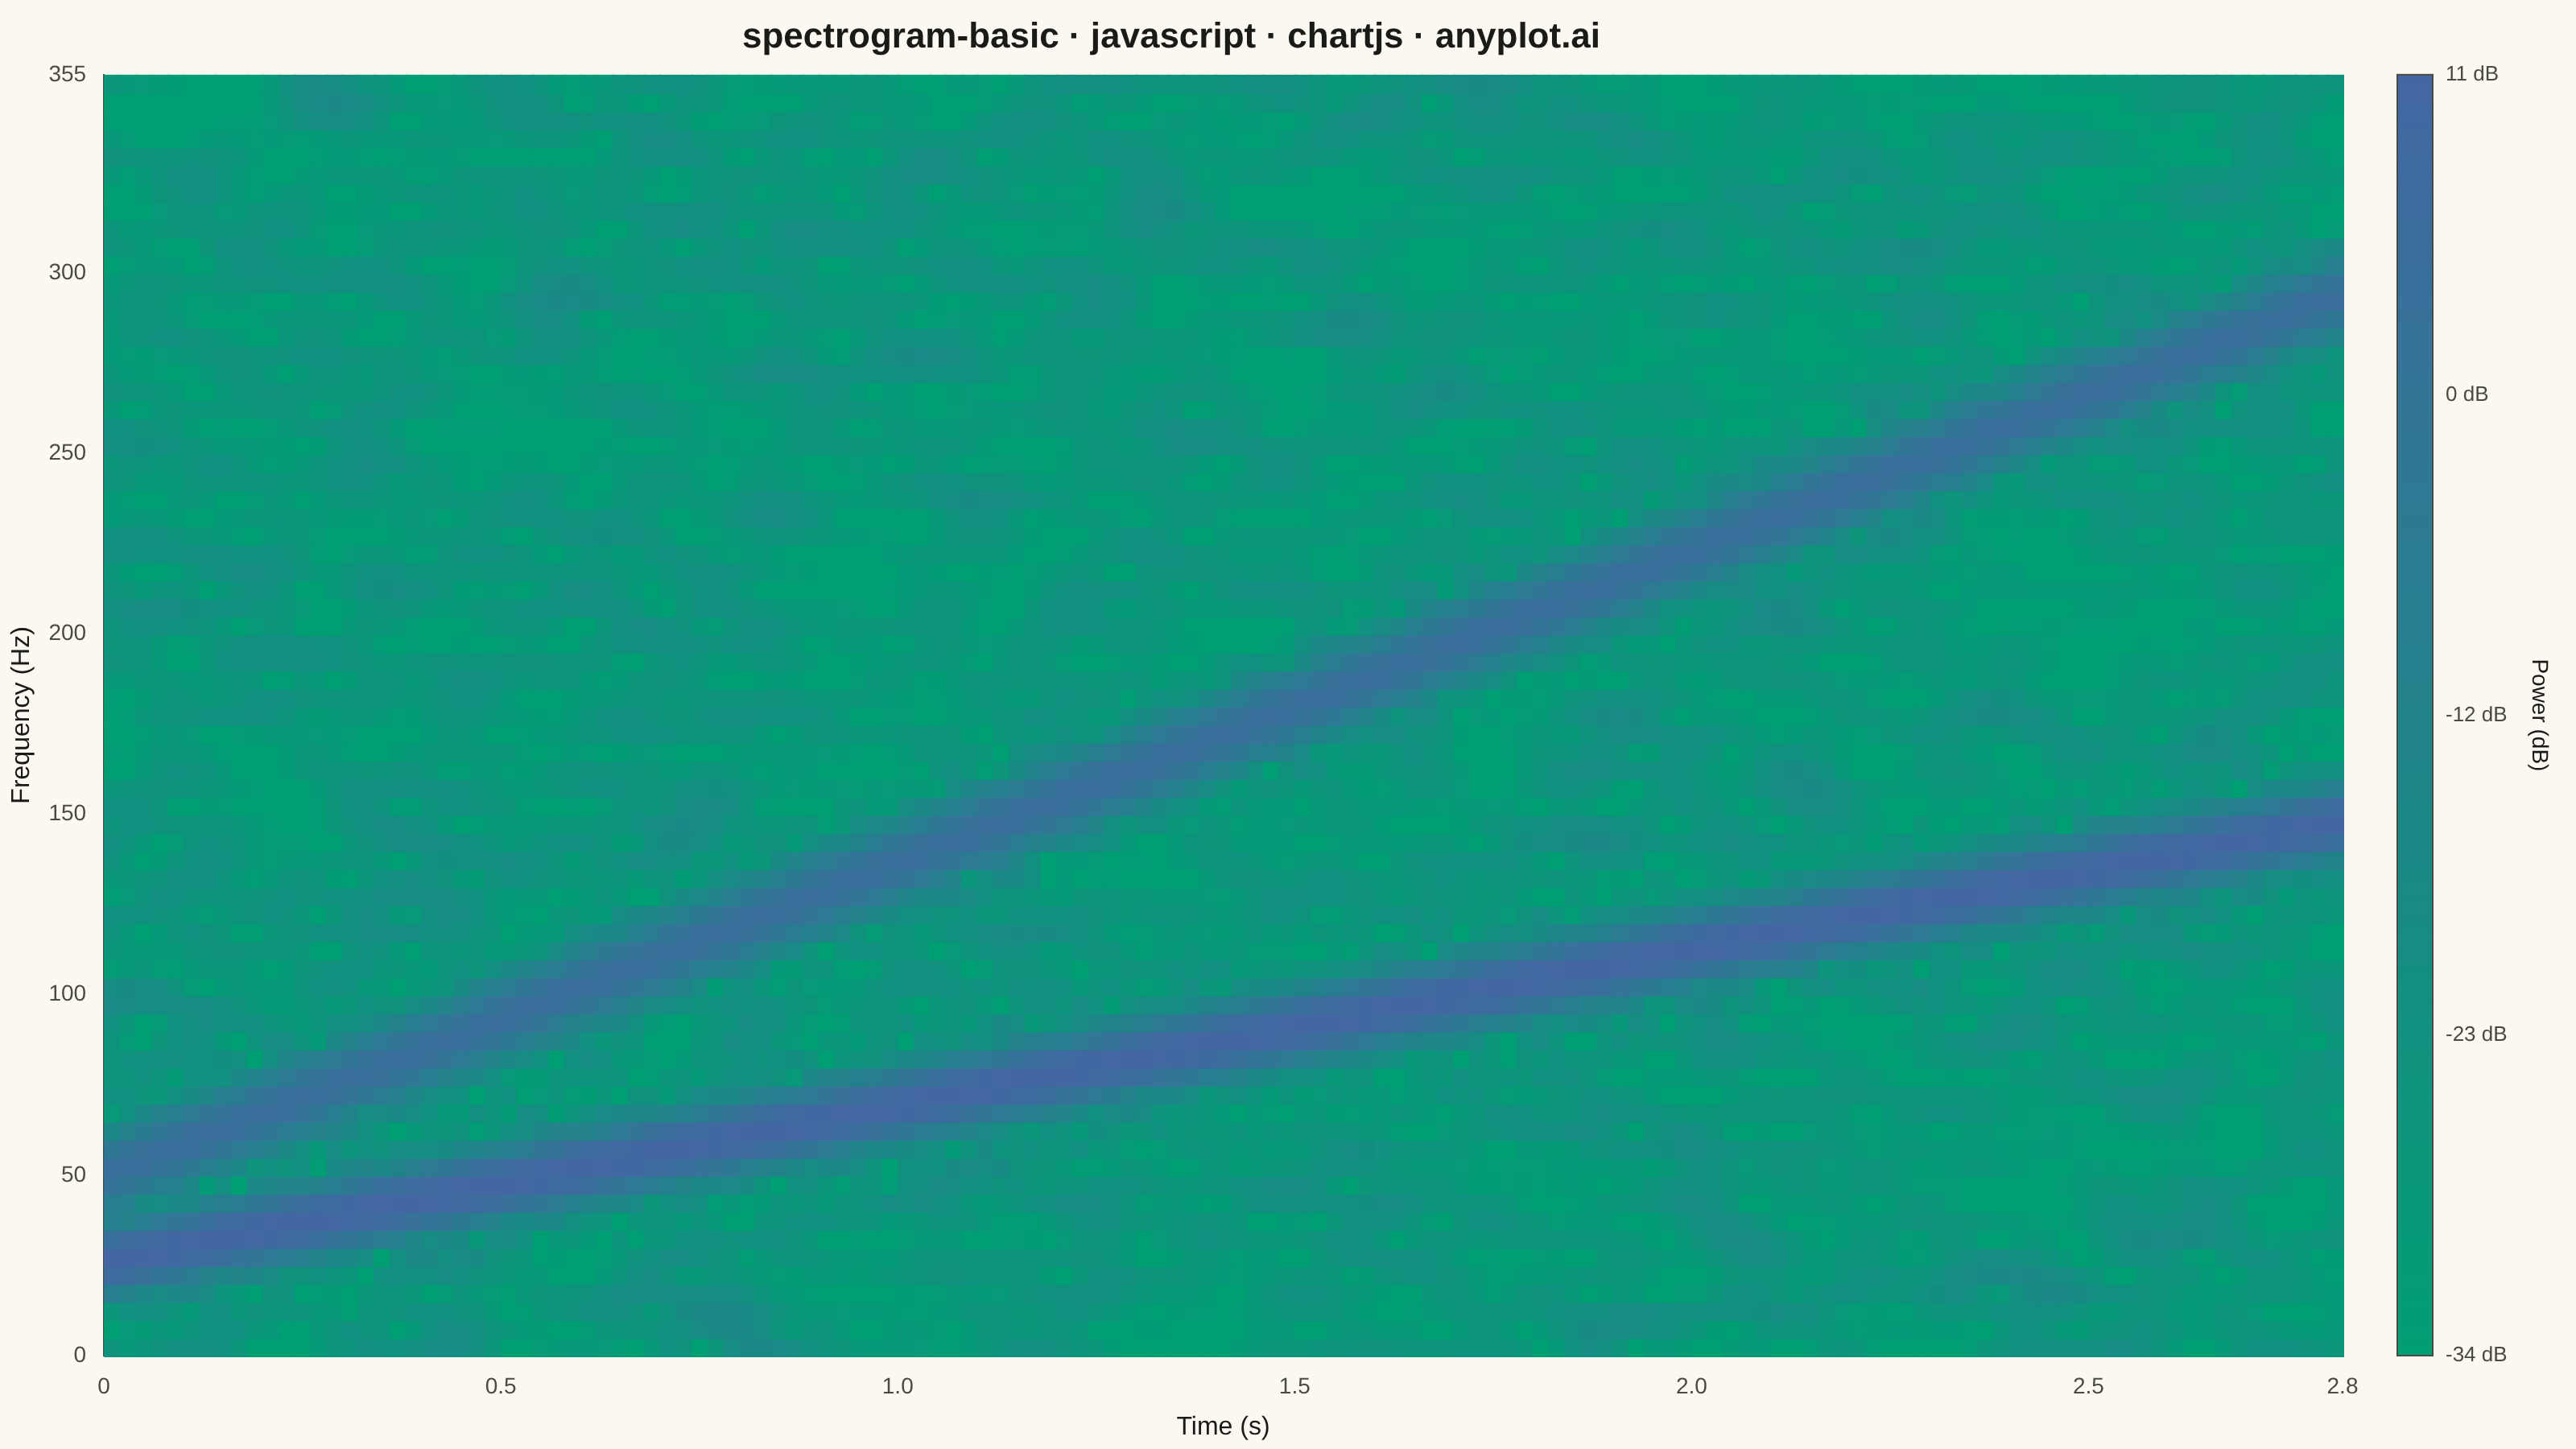
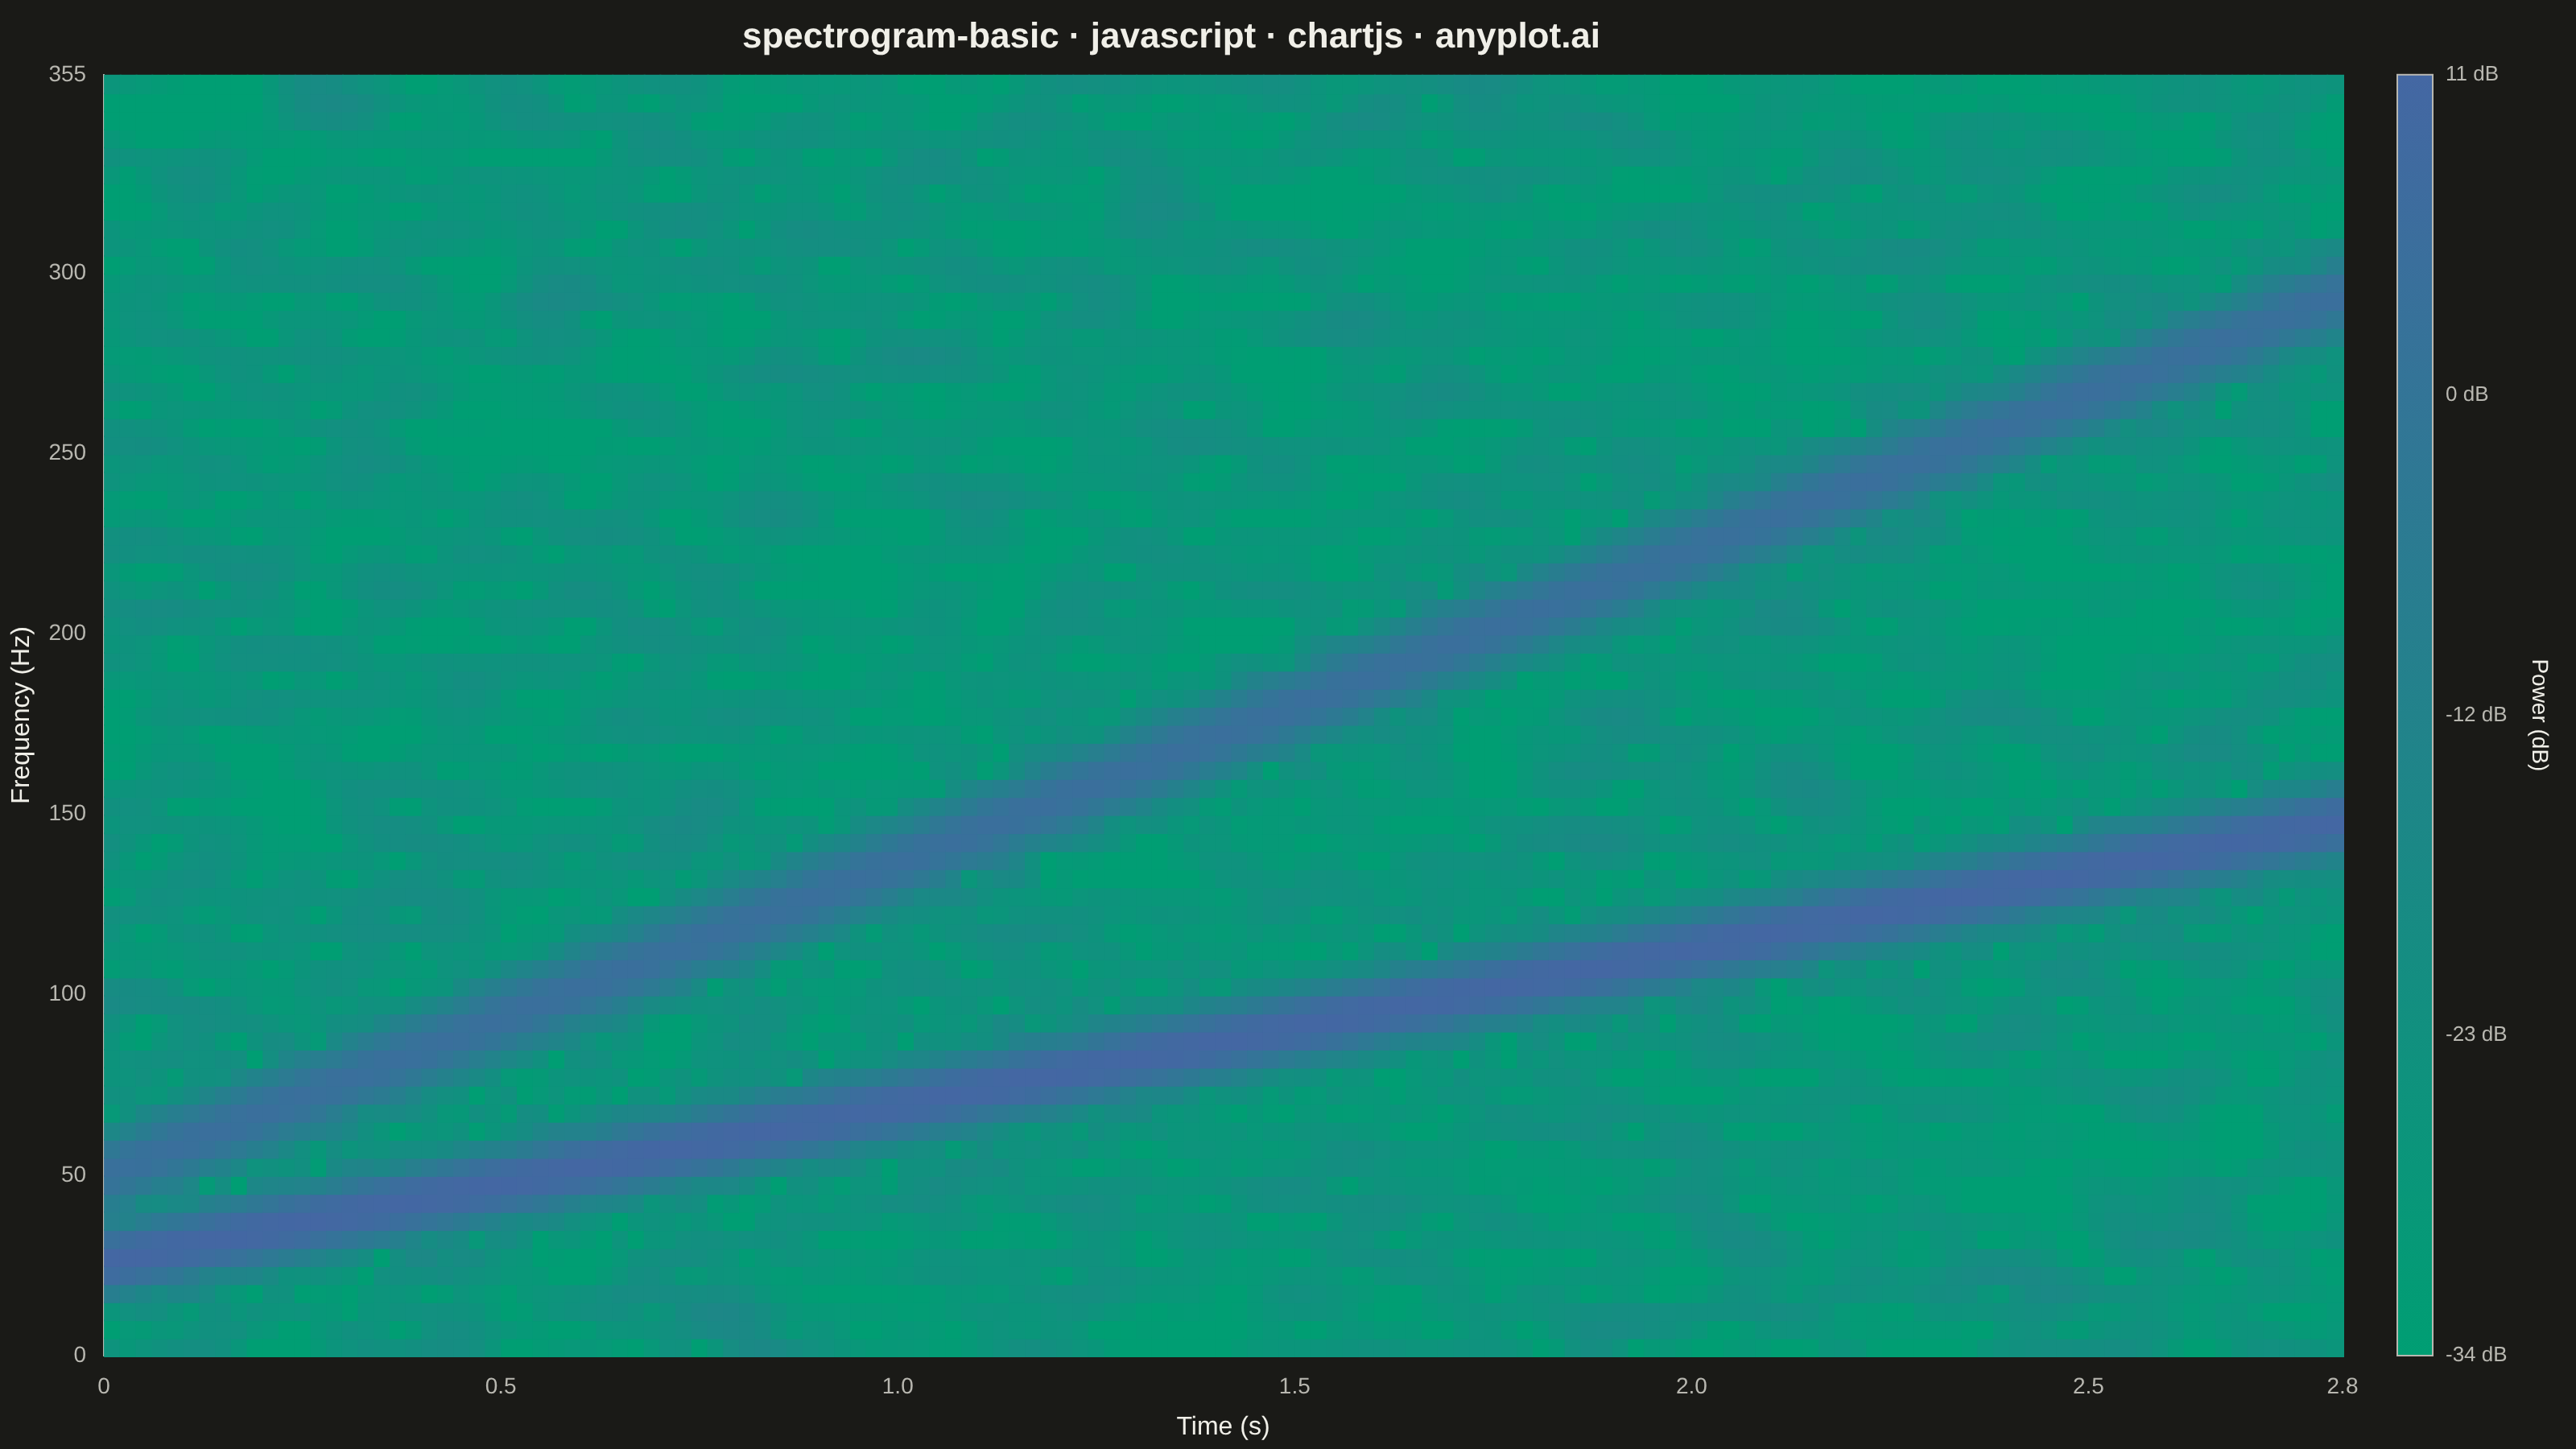
A spectrogram displaying time-frequency representation of a signal as a heatmap. It shows how the frequency content of a signal changes over time, with color intensity representing the amplitude or power at each time-frequency point. Essential for analyzing non-stationary signals where frequency characteristics vary, revealing patterns invisible in time-domain or frequency-domain views alone.
// anyplot.ai
// spectrogram-basic: Spectrogram Time-Frequency Heatmap
// Library: chartjs 4.4.7 | JavaScript 22.23.2
// Quality: 91/100 | Created: 2026-09-09

const t = window.ANYPLOT_TOKENS;

// --- Signal: machinery vibration during a speed ramp-up --------------------
const sampleRate = 1000; // Hz
const duration = 3.0; // seconds
const numSamples = Math.round(sampleRate * duration);

const startFreq = 20; // rotational frequency at t=0 (Hz)
const endFreq = 150; // rotational frequency at t=duration (Hz)
const chirpRate = (endFreq - startFreq) / duration;

// Tiny fixed-seed LCG for reproducible noise (the browser has no seeded RNG).
let lcgState = 42;
function nextRandom() {
  lcgState = (lcgState * 1103515245 + 12345) & 0x7fffffff;
  return lcgState / 0x7fffffff;
}

const signal = new Float64Array(numSamples);
for (let n = 0; n < numSamples; n++) {
  const time = n / sampleRate;
  // Linear chirp: instantaneous frequency ramps startFreq -> endFreq.
  const phase = 2 * Math.PI * (startFreq * time + (chirpRate * time * time) / 2);
  const fundamental = Math.sin(phase);
  const bearingHarmonic = 0.5 * Math.sin(2 * phase); // fault harmonic at 2x
  const noise = 0.15 * (nextRandom() * 2 - 1);
  signal[n] = fundamental + bearingHarmonic + noise;
}

// --- Short-time Fourier transform (windowed DFT) ----------------------------
const windowSize = 200;
const hopSize = 20;
const maxFreqHz = 350;
const freqBinWidth = sampleRate / windowSize; // Hz per bin
const numFreqBins = Math.floor(maxFreqHz / freqBinWidth) + 1;
const numTimeBins = Math.floor((numSamples - windowSize) / hopSize) + 1;
// Axis bounds match the bin grid exactly (bin edges tile [0, xAxisMax] /
// [0, yAxisMax] with no gap) rather than the nominal signal duration/maxFreqHz.
const xAxisMax = (numTimeBins * hopSize) / sampleRate;
const yAxisMax = numFreqBins * freqBinWidth;

const hannWindow = new Float64Array(windowSize);
for (let n = 0; n < windowSize; n++) {
  hannWindow[n] = 0.5 - 0.5 * Math.cos((2 * Math.PI * n) / (windowSize - 1));
}

// Precomputed twiddle factors avoid millions of Math.cos/sin calls below.
const twiddleCos = new Float64Array(windowSize);
const twiddleSin = new Float64Array(windowSize);
for (let m = 0; m < windowSize; m++) {
  const angle = (-2 * Math.PI * m) / windowSize;
  twiddleCos[m] = Math.cos(angle);
  twiddleSin[m] = Math.sin(angle);
}

const powerDb = []; // powerDb[timeBin][freqBin]
let maxDb = -Infinity;
for (let ti = 0; ti < numTimeBins; ti++) {
  const start = ti * hopSize;
  const row = new Float64Array(numFreqBins);
  for (let k = 0; k < numFreqBins; k++) {
    let re = 0;
    let im = 0;
    for (let n = 0; n < windowSize; n++) {
      const sample = signal[start + n] * hannWindow[n];
      const idx = (k * n) % windowSize;
      re += sample * twiddleCos[idx];
      im += sample * twiddleSin[idx];
    }
    const power = (re * re + im * im) / windowSize;
    const db = 10 * Math.log10(power + 1e-12);
    row[k] = db;
    if (db > maxDb) maxDb = db;
  }
  powerDb.push(row);
}

// Narrowed from a wider range so the fainter 2x bearing-fault harmonic reads
// more clearly against the noise floor (the noise floor sits well below this
// range and gets pushed toward the darker end of the gradient).
const dynamicRangeDb = 45; // display range below the loudest bin

function mixHex(hexA, hexB, ratio) {
  const a = parseInt(hexA.slice(1), 16);
  const b = parseInt(hexB.slice(1), 16);
  const ar = (a >> 16) & 255;
  const ag = (a >> 8) & 255;
  const ab = a & 255;
  const br = (b >> 16) & 255;
  const bg = (b >> 8) & 255;
  const bb = b & 255;
  const r = Math.round(ar + (br - ar) * ratio);
  const g = Math.round(ag + (bg - ag) * ratio);
  const bl = Math.round(ab + (bb - ab) * ratio);
  return `rgb(${r}, ${g}, ${bl})`;
}

function colorForDb(db) {
  const relative = Math.max(-dynamicRangeDb, Math.min(0, db - maxDb));
  const value = (relative + dynamicRangeDb) / dynamicRangeDb; // 0..1
  return mixHex(t.seq[0], t.seq[1], value);
}

// --- Mount -------------------------------------------------------------------
const canvas = document.createElement("canvas");
document.getElementById("container").appendChild(canvas);

// --- Heatmap + colorbar plugin ----------------------------------------------
// Chart.js has no native heatmap type; this plugin fills the cartesian chart
// area with one rect per time/frequency bin, using the scales' own pixel
// mapping so cells tile exactly with no gaps or overlap.
const colorbarWidth = 22;
const spectrogramPlugin = {
  id: "spectrogramHeatmap",
  afterDatasetsDraw(chart) {
    const { ctx, scales } = chart;
    const { x, y } = scales;
    ctx.save();
    for (let ti = 0; ti < numTimeBins; ti++) {
      const tStart = (ti * hopSize) / sampleRate;
      const tEnd = tStart + hopSize / sampleRate;
      const px0 = x.getPixelForValue(tStart);
      const px1 = x.getPixelForValue(tEnd);
      const row = powerDb[ti];
      for (let fi = 0; fi < numFreqBins; fi++) {
        const fStart = fi * freqBinWidth;
        const fEnd = fStart + freqBinWidth;
        const py0 = y.getPixelForValue(fEnd);
        const py1 = y.getPixelForValue(fStart);
        ctx.fillStyle = colorForDb(row[fi]);
        ctx.fillRect(px0, py0, px1 - px0 + 1, py1 - py0 + 1);
      }
    }
    ctx.restore();
  },
  afterDraw(chart) {
    const { ctx, chartArea } = chart;
    const barX = chartArea.right + 34;
    const barTop = chartArea.top;
    const barHeight = chartArea.bottom - chartArea.top;

    const gradient = ctx.createLinearGradient(0, barTop + barHeight, 0, barTop);
    gradient.addColorStop(0, t.seq[0]);
    gradient.addColorStop(1, t.seq[1]);

    ctx.save();
    ctx.fillStyle = gradient;
    ctx.fillRect(barX, barTop, colorbarWidth, barHeight);
    ctx.strokeStyle = t.inkSoft;
    ctx.lineWidth = 1;
    ctx.strokeRect(barX, barTop, colorbarWidth, barHeight);

    ctx.fillStyle = t.inkSoft;
    ctx.font = "13px sans-serif";
    ctx.textAlign = "left";
    ctx.textBaseline = "middle";
    const tickCount = 4;
    for (let i = 0; i <= tickCount; i++) {
      const ratio = i / tickCount;
      const value = Math.round(maxDb - dynamicRangeDb * (1 - ratio));
      const tickY = barTop + barHeight * (1 - ratio);
      ctx.fillText(`${value} dB`, barX + colorbarWidth + 8, tickY);
    }

    ctx.translate(barX + colorbarWidth + 66, barTop + barHeight / 2);
    ctx.rotate(Math.PI / 2);
    ctx.textAlign = "center";
    ctx.fillStyle = t.ink;
    ctx.font = "14px sans-serif";
    ctx.fillText("Power (dB)", 0, 0);
    ctx.restore();
  },
};

// --- Chart -------------------------------------------------------------------
new Chart(canvas, {
  type: "scatter",
  data: { datasets: [] },
  plugins: [spectrogramPlugin],
  options: {
    responsive: true,
    maintainAspectRatio: false,
    animation: false,
    layout: { padding: { right: 145 } },
    plugins: {
      title: {
        display: true,
        text: "spectrogram-basic · javascript · chartjs · anyplot.ai",
        color: t.ink,
        font: { size: 22 },
      },
      legend: { display: false },
      tooltip: { enabled: false },
    },
    scales: {
      x: {
        type: "linear",
        min: 0,
        max: xAxisMax,
        ticks: { color: t.inkSoft, font: { size: 14 } },
        grid: { display: false },
        border: { color: t.inkSoft },
        title: { display: true, text: "Time (s)", color: t.ink, font: { size: 16 } },
      },
      y: {
        type: "linear",
        min: 0,
        max: yAxisMax,
        ticks: { color: t.inkSoft, font: { size: 14 } },
        grid: { display: false },
        border: { color: t.inkSoft },
        title: { display: true, text: "Frequency (Hz)", color: t.ink, font: { size: 16 } },
      },
    },
  },
});
Runnable source as JSON, for any HTTP client: https://api.anyplot.ai/specs/spectrogram-basic/chartjs/code. Any spec id and library id listed in llms-full.txt fit the same URL shape; every URL below is complete and callable.
{
  "spec_id": "spectrogram-basic",
  "language": "javascript",
  "library": "chartjs",
  "page": "https://anyplot.ai/spectrogram-basic/javascript/chartjs",
  "hub": "https://anyplot.ai/spectrogram-basic",
  "code_json": "https://api.anyplot.ai/specs/spectrogram-basic/chartjs/code",
  "spec_json": "https://api.anyplot.ai/specs/spectrogram-basic",
  "render_light_png": "https://storage.googleapis.com/anyplot-images/plots/spectrogram-basic/javascript/chartjs/plot-light.png",
  "render_dark_png": "https://storage.googleapis.com/anyplot-images/plots/spectrogram-basic/javascript/chartjs/plot-dark.png",
  "interactive_light_html": "https://storage.googleapis.com/anyplot-images/plots/spectrogram-basic/javascript/chartjs/plot-light.html",
  "interactive_dark_html": "https://storage.googleapis.com/anyplot-images/plots/spectrogram-basic/javascript/chartjs/plot-dark.html",
  "quality_score": 91.0,
  "license": "MIT",
  "guide": "https://anyplot.ai/llms.txt"
}
Part of Spectrogram Time-Frequency Heatmap on anyplot.ai.