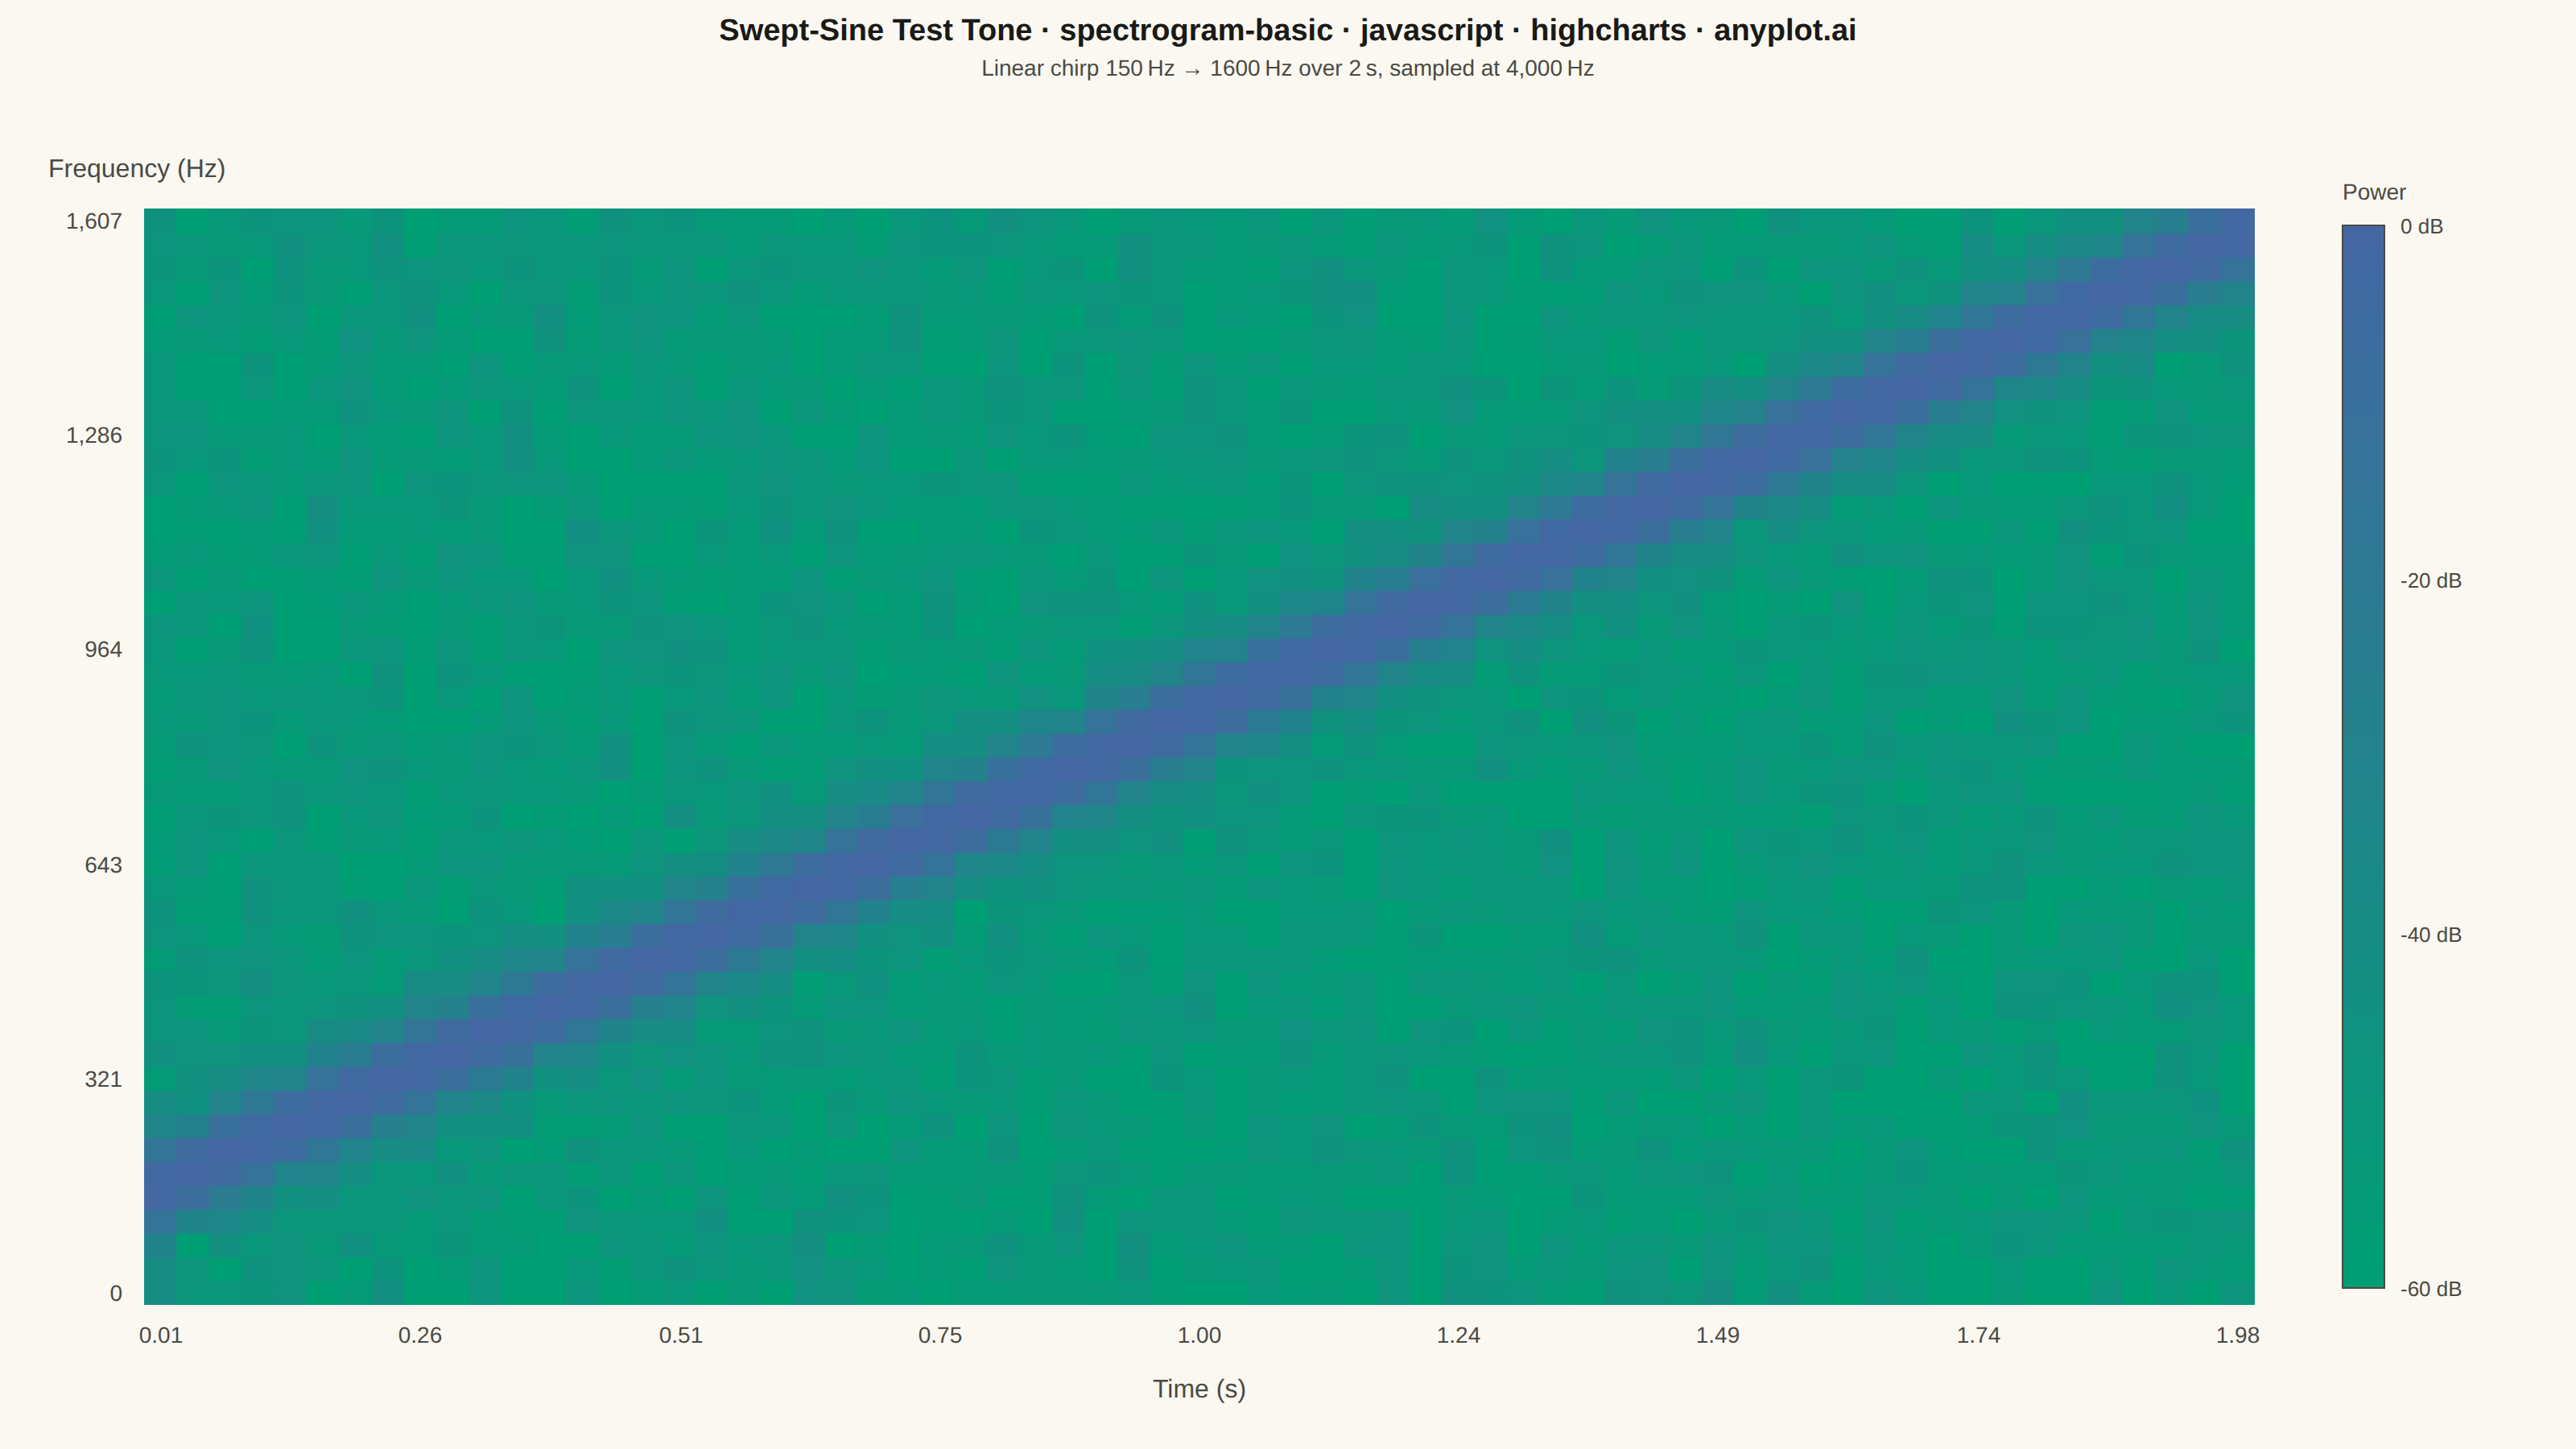
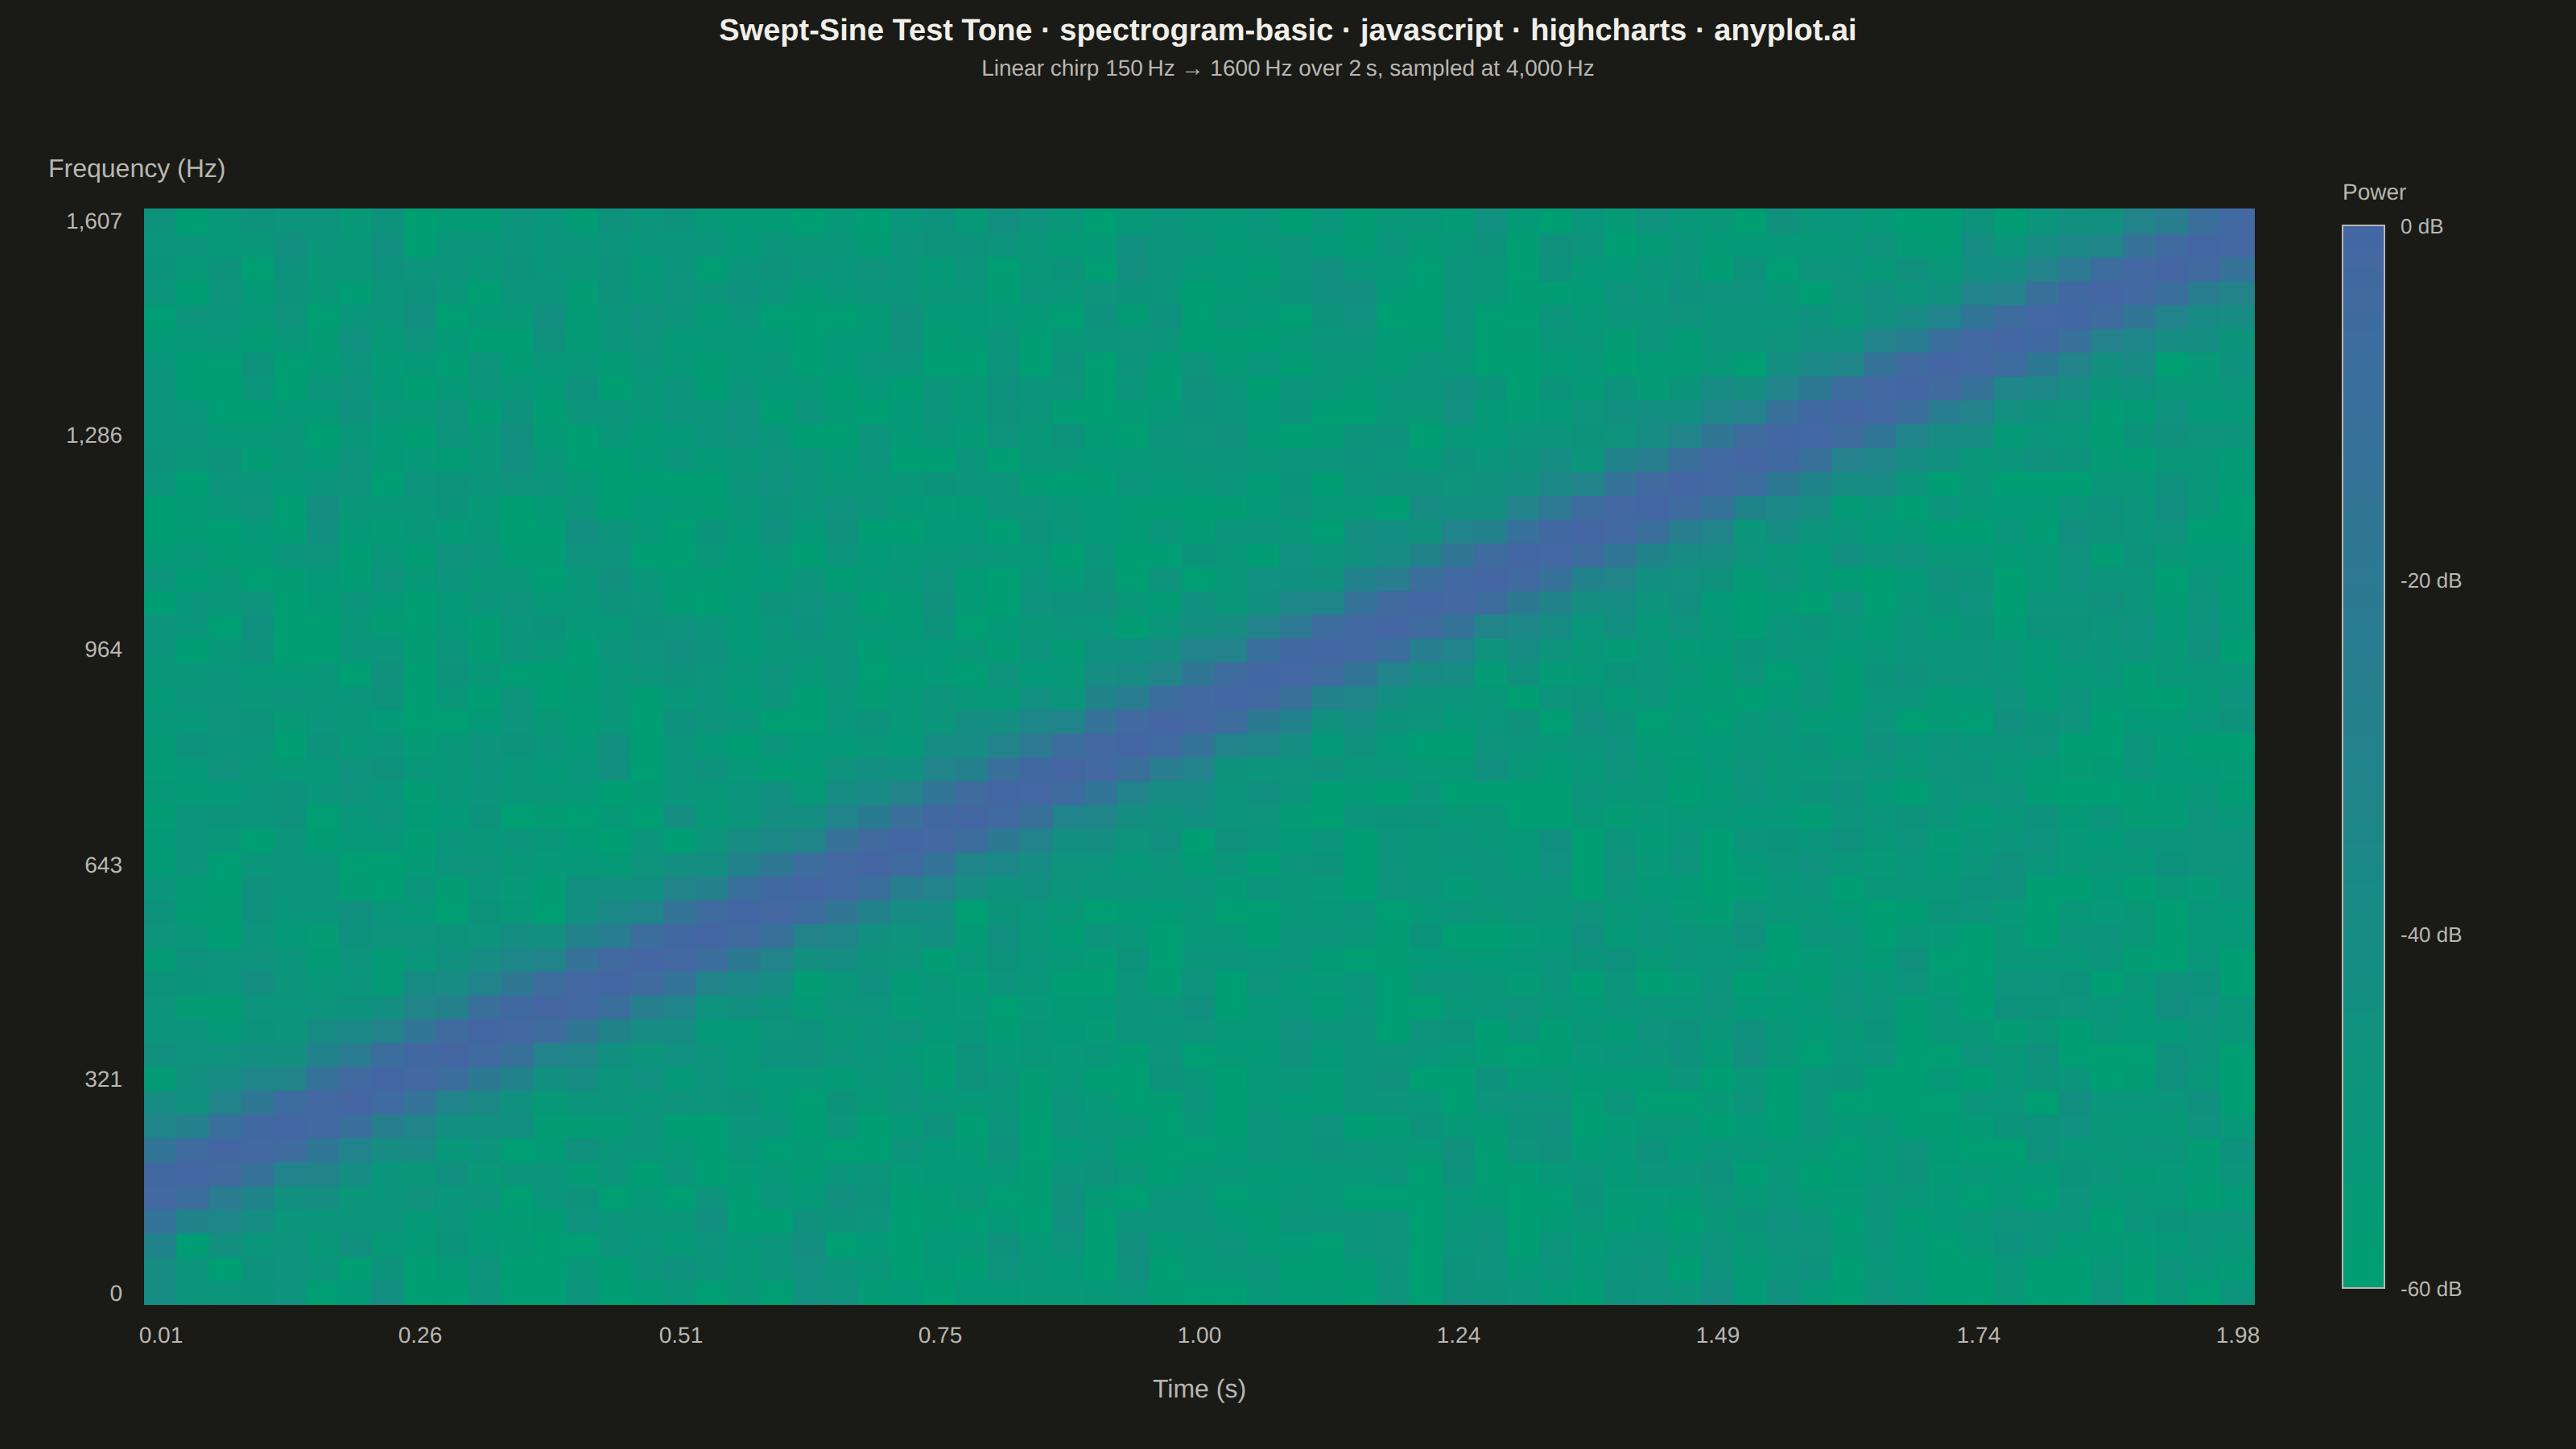
The same plot in 14 other libraries — JavaScript: Chart.js, D3.js, Apache ECharts, MUI X Charts; Python: Altair, Bokeh, lets-plot, Matplotlib, Plotly, plotnine, Pygal, Seaborn; R: ggplot2; Julia: Makie.jl. Compare all 15 side by side: Spectrogram Time-Frequency Heatmap in Python, R, Julia and JavaScript.
A spectrogram displaying time-frequency representation of a signal as a heatmap. It shows how the frequency content of a signal changes over time, with color intensity representing the amplitude or power at each time-frequency point. Essential for analyzing non-stationary signals where frequency characteristics vary, revealing patterns invisible in time-domain or frequency-domain views alone.
// anyplot.ai
// spectrogram-basic: Spectrogram Time-Frequency Heatmap
// Library: highcharts 12.6.0 | JavaScript 22.23.2
// Quality: 89/100 | Created: 2026-09-09
//# anyplot-orientation: landscape

const t = window.ANYPLOT_TOKENS;

// --- Data: linear chirp test tone, computed via a short-time Fourier -------
// transform. The core Highcharts bundle has no heatmap/colorAxis module, so
// the time-frequency grid is drawn cell-by-cell with the SVG renderer.
const SAMPLE_RATE = 4000; // Hz
const DURATION = 2.0; // seconds
const N_SAMPLES = Math.round(SAMPLE_RATE * DURATION);
const F_START = 150; // Hz — sweep start
const F_END = 1600; // Hz — sweep end

// Deterministic LCG — the browser has no seeded RNG.
let seed = 42;
function rand() {
  seed = (seed * 1103515245 + 12345) & 0x7fffffff;
  return seed / 0x7fffffff;
}

// Linear chirp: instantaneous frequency rises smoothly from F_START to
// F_END across the signal duration, like a swept-sine calibration tone
// used to test audio equipment or room acoustics.
const signal = new Float64Array(N_SAMPLES);
for (let n = 0; n < N_SAMPLES; n++) {
  const time = n / SAMPLE_RATE;
  const sweepRate = (F_END - F_START) / DURATION;
  const phase = 2 * Math.PI * (F_START * time + (sweepRate * time * time) / 2);
  signal[n] = Math.sin(phase) + 0.02 * (rand() * 2 - 1);
}

// --- Short-time Fourier transform -------------------------------------------
const WINDOW_LEN = 112; // samples per analysis frame
const HOP = 123; // samples between frame starts
const N_COLS = Math.floor((N_SAMPLES - WINDOW_LEN) / HOP) + 1; // time frames
const N_ROWS = 46; // frequency bins kept (0 Hz .. Nyquist-ish)
const FREQ_STEP = SAMPLE_RATE / WINDOW_LEN; // Hz per bin

const hann = new Float64Array(WINDOW_LEN);
for (let n = 0; n < WINDOW_LEN; n++) {
  hann[n] = 0.5 - 0.5 * Math.cos((2 * Math.PI * n) / (WINDOW_LEN - 1));
}

// MAGNITUDE[col][row] — magnitude spectrum per frame, via a direct DFT
// (the grid is small enough that a full DFT is cheap and needs no FFT lib).
const MAGNITUDE = Array.from({ length: N_COLS }, () => new Float64Array(N_ROWS));
let maxMagnitude = 0;
for (let col = 0; col < N_COLS; col++) {
  const start = col * HOP;
  for (let row = 0; row < N_ROWS; row++) {
    let real = 0;
    let imag = 0;
    for (let n = 0; n < WINDOW_LEN; n++) {
      const sample = signal[start + n] * hann[n];
      const angle = (-2 * Math.PI * row * n) / WINDOW_LEN;
      real += sample * Math.cos(angle);
      imag += sample * Math.sin(angle);
    }
    const magnitude = Math.sqrt(real * real + imag * imag);
    MAGNITUDE[col][row] = magnitude;
    if (magnitude > maxMagnitude) maxMagnitude = magnitude;
  }
}

// Power relative to peak, in dB, clamped to a fixed dynamic range.
const DB_FLOOR = -60;
const POWER_DB = MAGNITUDE.map((frame) => frame.map((magnitude) => Math.max(20 * Math.log10(magnitude / maxMagnitude + 1e-12), DB_FLOOR)));

// --- Color: imprint_seq — single-polarity data (power level, always <= 0dB) --
function hexToRgb(hex) {
  return [parseInt(hex.slice(1, 3), 16), parseInt(hex.slice(3, 5), 16), parseInt(hex.slice(5, 7), 16)];
}
const SEQ_LO = hexToRgb(t.seq[0]); // #009E73 — quiet
const SEQ_HI = hexToRgb(t.seq[1]); // #4467A3 — loud

function lerp(a, b, f) {
  return a + (b - a) * f;
}
function powerFill(db) {
  const f = Math.min(Math.max((db - DB_FLOOR) / (0 - DB_FLOOR), 0), 1);
  const red = Math.round(lerp(SEQ_LO[0], SEQ_HI[0], f));
  const green = Math.round(lerp(SEQ_LO[1], SEQ_HI[1], f));
  const blue = Math.round(lerp(SEQ_LO[2], SEQ_HI[2], f));
  return `rgb(${red},${green},${blue})`;
}

// --- Title (fontsize scaled off the 67-char baseline) ----------------------
const TITLE_TEXT = 'Swept-Sine Test Tone · spectrogram-basic · javascript · highcharts · anyplot.ai';
const TITLE_FS = Math.max(Math.round(22 * Math.min(1, 67 / TITLE_TEXT.length)), 14);

// Fixed chart geometry (landscape canvas, harness-guaranteed 1600x900 CSS px)
// — a single source of truth for the margin, the grid, and the invisible
// hover layer below, so everything lines up without a runtime resync.
const CHART_MARGIN = [130, 200, 90, 90]; // [top, right, bottom, left]
const CELL_W = (window.ANYPLOT_SIZE.width - CHART_MARGIN[1] - CHART_MARGIN[3]) / N_COLS;
const CELL_H = (window.ANYPLOT_SIZE.height - CHART_MARGIN[0] - CHART_MARGIN[2]) / N_ROWS;

function frameTime(col) {
  return (col * HOP + WINDOW_LEN / 2) / SAMPLE_RATE;
}
function binFreq(row) {
  return row * FREQ_STEP;
}

const drawn = [];
function clearDrawn() {
  drawn.forEach((el) => {
    try {
      el.destroy();
    } catch (_err) {
      // already removed
    }
  });
  drawn.length = 0;
}

function drawAll() {
  const chart = this;
  clearDrawn();
  const r = chart.renderer;

  const cellW = chart.plotWidth / N_COLS;
  const cellH = chart.plotHeight / N_ROWS;

  // Grid cells — frequency increases upward (row 0 = 0 Hz at the bottom),
  // time increases rightward, matching the invisible scatter axes below.
  for (let col = 0; col < N_COLS; col++) {
    for (let row = 0; row < N_ROWS; row++) {
      const x = chart.plotLeft + col * cellW;
      const y = chart.plotTop + (N_ROWS - 1 - row) * cellH;
      drawn.push(
        r
          .rect(x - 0.5, y - 0.5, cellW + 1, cellH + 1, 0)
          .attr({ fill: powerFill(POWER_DB[col][row]), stroke: 'none', zIndex: 2 })
          .add()
      );
    }
  }

  // Time labels (x-axis) — roughly 8 evenly spaced frames.
  const timeLabelStride = Math.round(N_COLS / 8);
  for (let col = 0; col < N_COLS; col += timeLabelStride) {
    const cx = chart.plotLeft + (col + 0.5) * cellW;
    drawn.push(
      r
        .text(frameTime(col).toFixed(2), cx, chart.plotTop + chart.plotHeight + 24)
        .attr({ align: 'center', zIndex: 2 })
        .css({ color: t.inkSoft, fontSize: '14px' })
        .add()
    );
  }
  drawn.push(
    r
      .text('Time (s)', chart.plotLeft + chart.plotWidth / 2, chart.plotTop + chart.plotHeight + 58)
      .attr({ align: 'center', zIndex: 2 })
      .css({ color: t.inkSoft, fontSize: '16px' })
      .add()
  );

  // Frequency labels (y-axis) — roughly 6 evenly spaced bins.
  const freqLabelStride = Math.round((N_ROWS - 1) / 5);
  for (let row = 0; row < N_ROWS; row += freqLabelStride) {
    const cy = chart.plotTop + (N_ROWS - 1 - row) * cellH + cellH / 2 + 5;
    drawn.push(
      r
        .text(Math.round(binFreq(row)).toLocaleString(), chart.plotLeft - 14, cy)
        .attr({ align: 'right', zIndex: 2 })
        .css({ color: t.inkSoft, fontSize: '14px' })
        .add()
    );
  }
  drawn.push(
    r
      .text('Frequency (Hz)', chart.plotLeft - 60, chart.plotTop - 20)
      .attr({ align: 'left', zIndex: 2 })
      .css({ color: t.inkSoft, fontSize: '16px' })
      .add()
  );

  // Vertical colorbar in the freed right margin.
  const barLeft = chart.plotLeft + chart.plotWidth + 55;
  const barTop = chart.plotTop + 10;
  const barWidth = 26;
  const barHeight = chart.plotHeight - 20;
  const segments = 50;
  const segH = barHeight / segments;

  for (let i = 0; i < segments; i++) {
    const db = 0 - ((0 - DB_FLOOR) * i) / (segments - 1);
    drawn.push(
      r
        .rect(barLeft, barTop + i * segH, barWidth, segH + 0.5)
        .attr({ fill: powerFill(db), zIndex: 2 })
        .add()
    );
  }
  drawn.push(
    r
      .rect(barLeft, barTop, barWidth, barHeight)
      .attr({ fill: 'none', stroke: t.inkSoft, 'stroke-width': 1, zIndex: 2 })
      .add()
  );
  // Endpoints plus two evenly spaced intermediate stops (-20 dB, -40 dB) so
  // readers can estimate values along the gradient, not just the extremes.
  [
    [0, 0],
    [DB_FLOOR / 3, 1 / 3],
    [(2 * DB_FLOOR) / 3, 2 / 3],
    [DB_FLOOR, 1],
  ].forEach(([db, frac]) => {
    drawn.push(
      r
        .text(`${db} dB`, barLeft + barWidth + 10, barTop + frac * barHeight + 5)
        .attr({ align: 'left', zIndex: 2 })
        .css({ color: t.inkSoft, fontSize: '13px' })
        .add()
    );
  });
  drawn.push(
    r
      .text('Power', barLeft, barTop - 16)
      .attr({ align: 'left', zIndex: 2 })
      .css({ color: t.inkSoft, fontSize: '14px', fontWeight: '500' })
      .add()
  );
}

// Invisible scatter layer aligned to each drawn cell so hovering exposes a
// real Highcharts tooltip — the core bundle has no heatmap/colorAxis module,
// but a matched-axis scatter series recovers native hover interactivity
// without disturbing the hand-drawn grid above it.
const cellPoints = [];
for (let col = 0; col < N_COLS; col++) {
  for (let row = 0; row < N_ROWS; row++) {
    cellPoints.push({ x: col, y: row, timeS: frameTime(col), freqHz: binFreq(row), db: POWER_DB[col][row] });
  }
}

Highcharts.chart('container', {
  chart: {
    backgroundColor: 'transparent',
    animation: false,
    style: { fontFamily: 'inherit' },
    margin: CHART_MARGIN,
    events: { load: drawAll, redraw: drawAll },
  },
  credits: { enabled: false },
  title: {
    text: TITLE_TEXT,
    style: { color: t.ink, fontSize: TITLE_FS + 'px', fontWeight: '600' },
  },
  subtitle: {
    text: `Linear chirp ${F_START} Hz → ${F_END} Hz over ${DURATION} s, sampled at ${SAMPLE_RATE.toLocaleString()} Hz`,
    style: { color: t.inkSoft, fontSize: '14px' },
  },
  xAxis: { visible: false, min: -0.5, max: N_COLS - 0.5 },
  yAxis: { visible: false, min: -0.5, max: N_ROWS - 0.5 },
  legend: { enabled: false },
  tooltip: {
    enabled: true,
    backgroundColor: t.elevatedBg,
    borderColor: t.inkSoft,
    borderRadius: 6,
    style: { color: t.ink, fontSize: '13px' },
    formatter: function () {
      const p = this.point;
      return `<b>${p.timeS.toFixed(2)} s · ${Math.round(p.freqHz).toLocaleString()} Hz</b><br/>${p.db.toFixed(1)} dB`;
    },
  },
  plotOptions: {
    series: { animation: false },
    scatter: {
      enableMouseTracking: true,
      stickyTracking: false,
      marker: {
        enabled: true,
        symbol: 'circle',
        radius: Math.max(Math.min(CELL_W, CELL_H) / 2, 3),
        fillColor: 'rgba(0,0,0,0.001)',
        lineWidth: 0,
        states: { hover: { enabled: false } },
      },
    },
  },
  series: [
    {
      type: 'scatter',
      name: 'Power',
      data: cellPoints,
    },
  ],
});
Runnable source as JSON, for any HTTP client: https://api.anyplot.ai/specs/spectrogram-basic/highcharts/code. Any spec id and library id listed in llms-full.txt fit the same URL shape; every URL below is complete and callable.
{
  "spec_id": "spectrogram-basic",
  "language": "javascript",
  "library": "highcharts",
  "page": "https://anyplot.ai/spectrogram-basic/javascript/highcharts",
  "hub": "https://anyplot.ai/spectrogram-basic",
  "code_json": "https://api.anyplot.ai/specs/spectrogram-basic/highcharts/code",
  "spec_json": "https://api.anyplot.ai/specs/spectrogram-basic",
  "render_light_png": "https://storage.googleapis.com/anyplot-images/plots/spectrogram-basic/javascript/highcharts/plot-light.png",
  "render_dark_png": "https://storage.googleapis.com/anyplot-images/plots/spectrogram-basic/javascript/highcharts/plot-dark.png",
  "interactive_light_html": "https://storage.googleapis.com/anyplot-images/plots/spectrogram-basic/javascript/highcharts/plot-light.html",
  "interactive_dark_html": "https://storage.googleapis.com/anyplot-images/plots/spectrogram-basic/javascript/highcharts/plot-dark.html",
  "quality_score": 89.0,
  "license": "MIT",
  "guide": "https://anyplot.ai/llms.txt"
}
Part of Spectrogram Time-Frequency Heatmap on anyplot.ai.