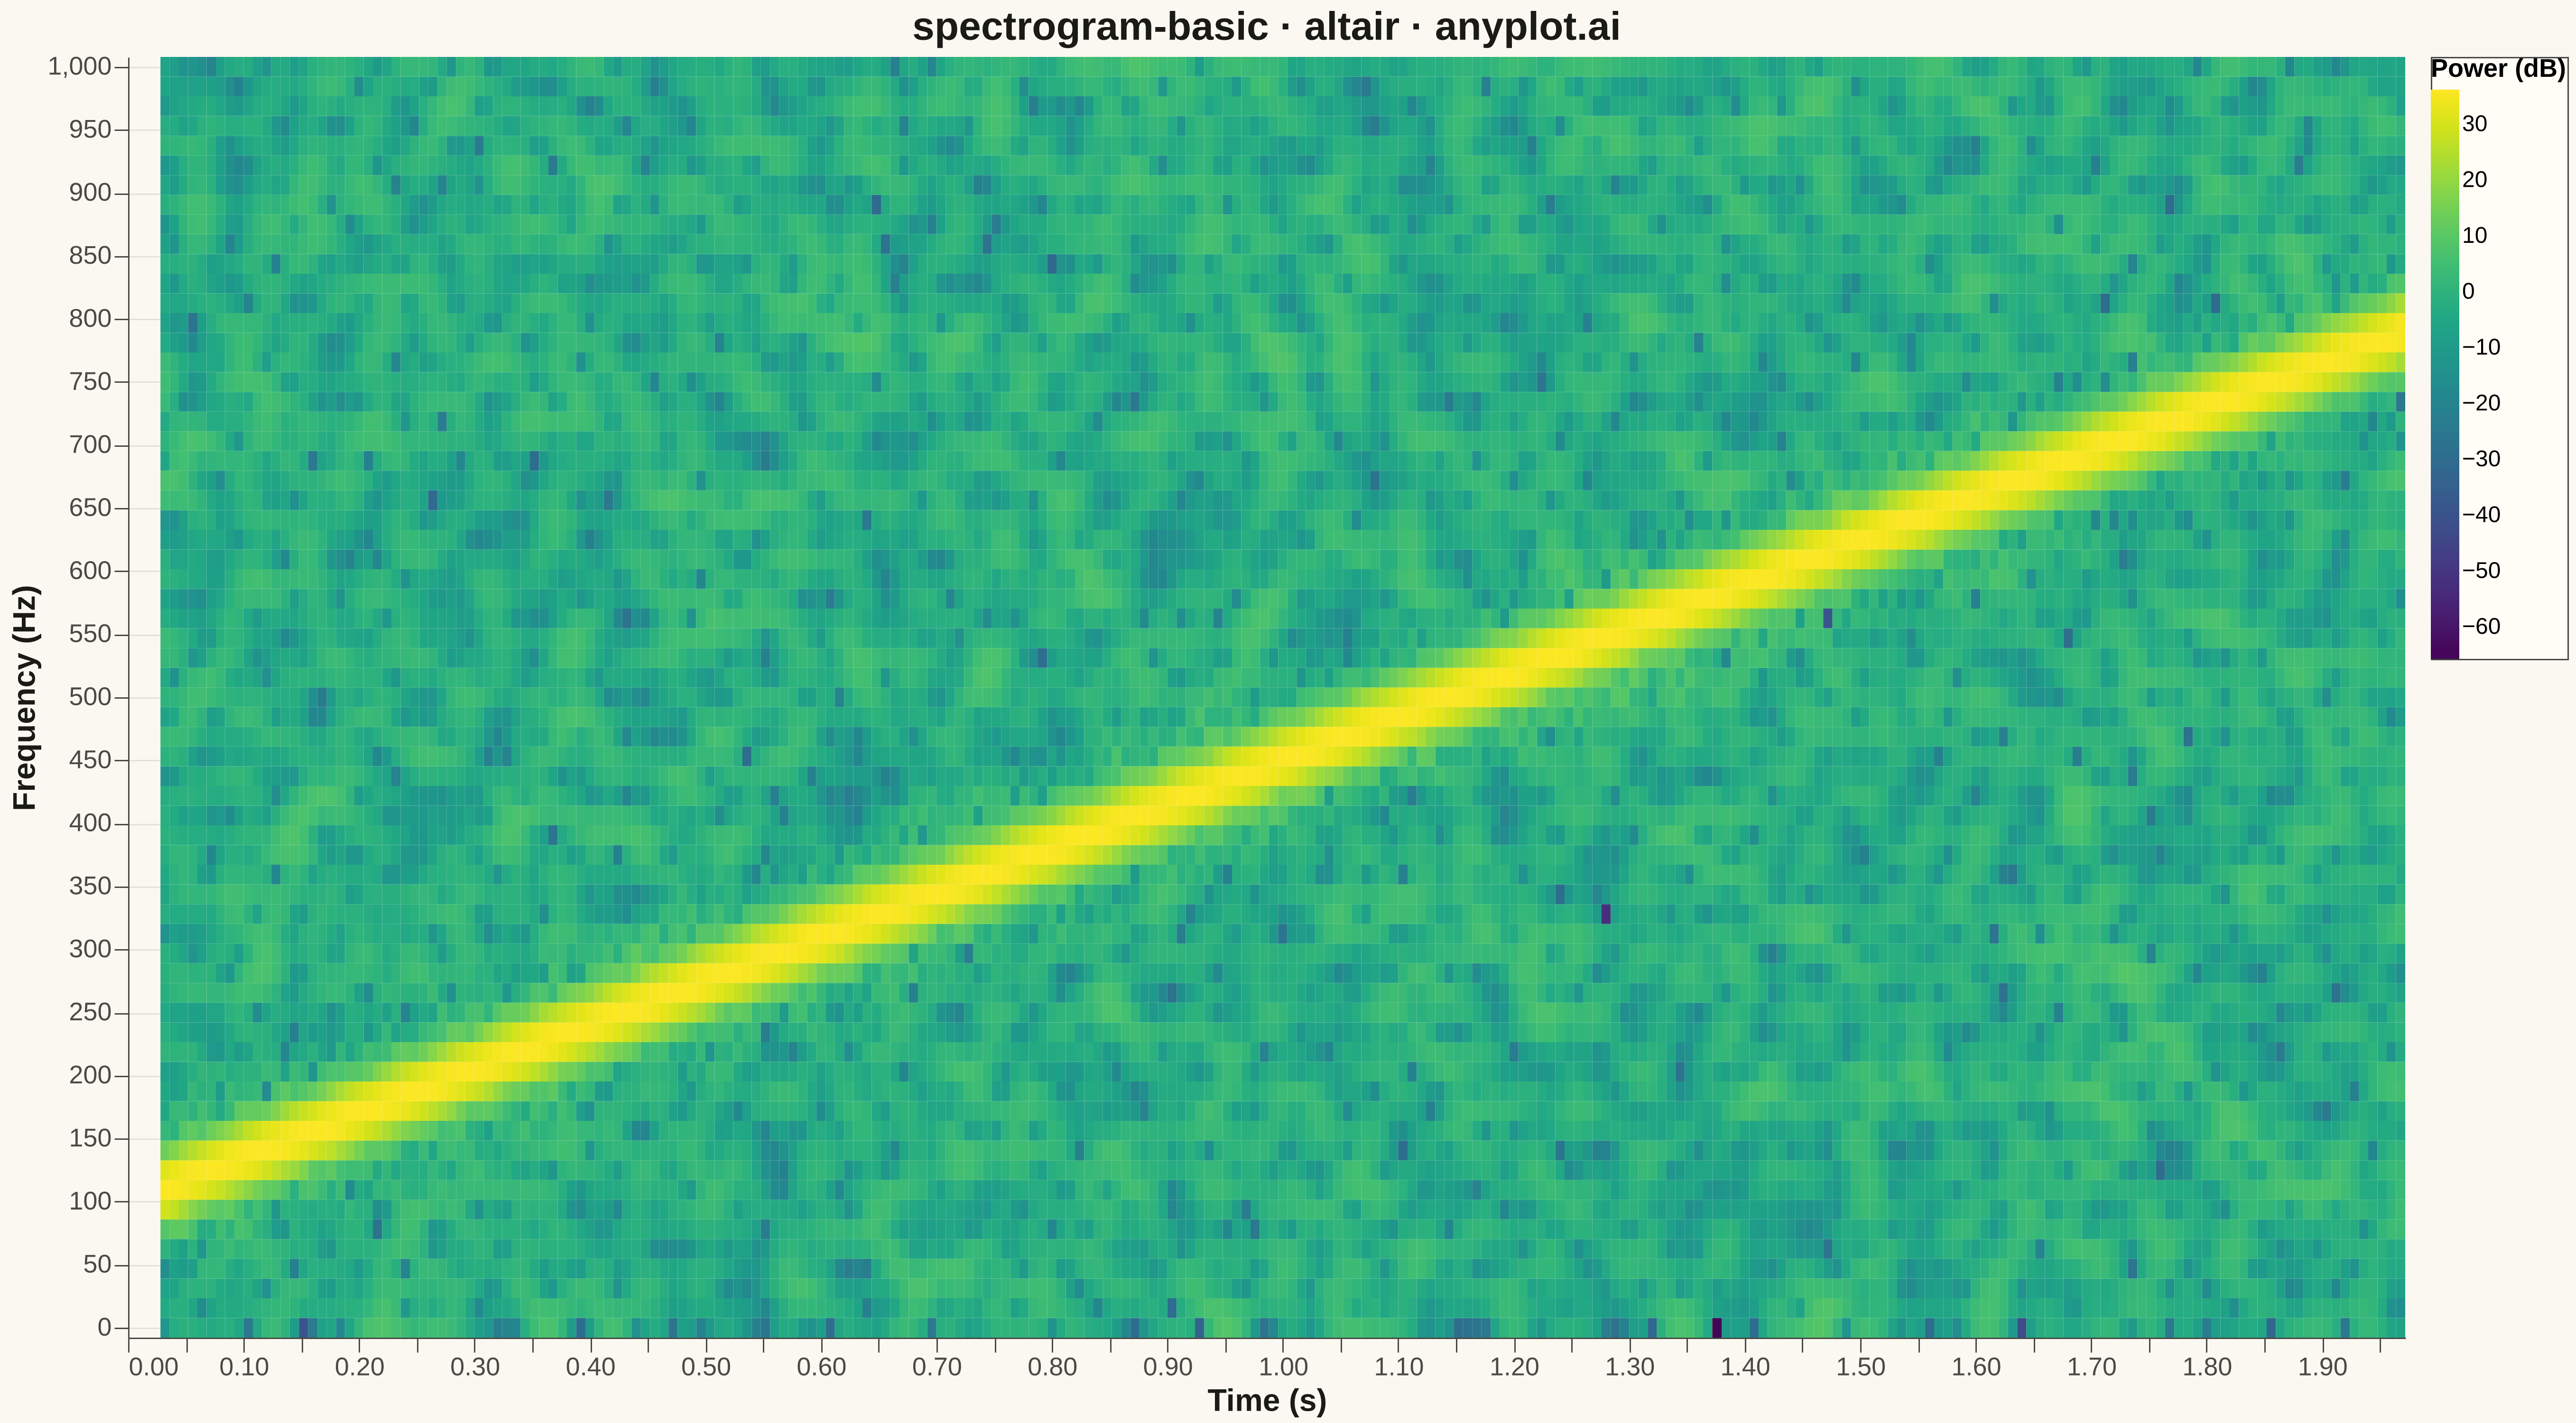
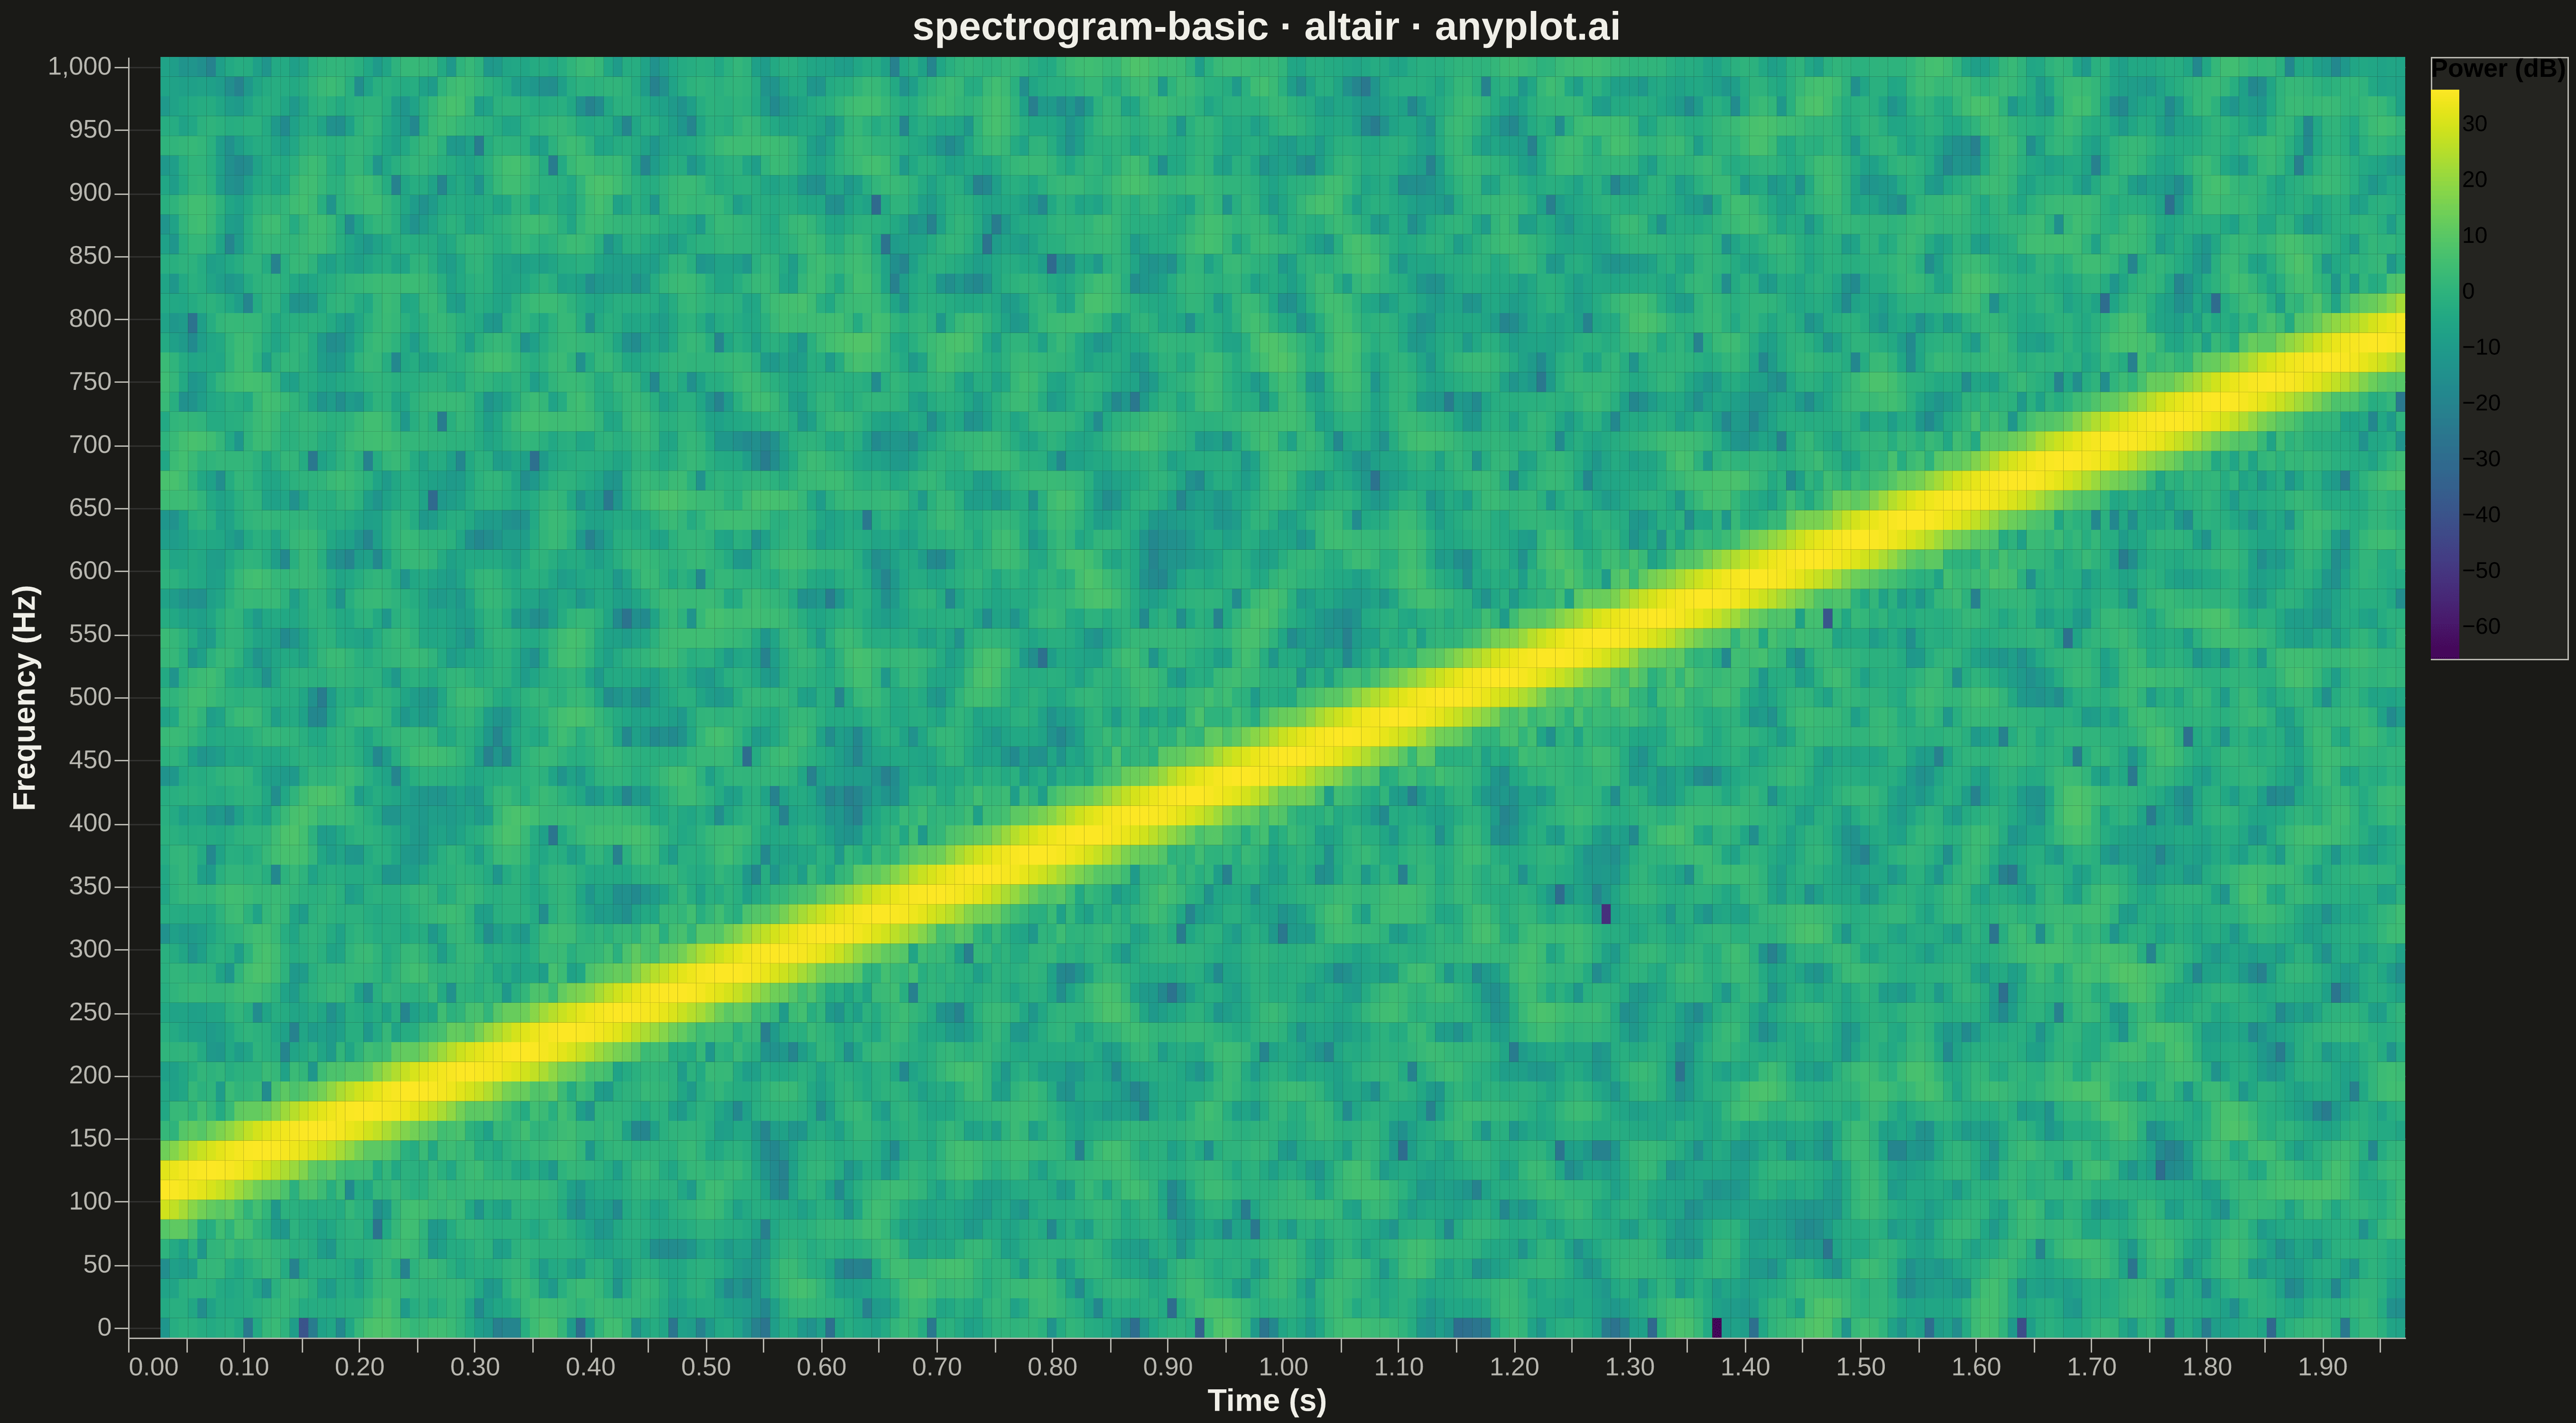
A spectrogram displaying time-frequency representation of a signal as a heatmap. It shows how the frequency content of a signal changes over time, with color intensity representing the amplitude or power at each time-frequency point. Essential for analyzing non-stationary signals where frequency characteristics vary, revealing patterns invisible in time-domain or frequency-domain views alone.
""" anyplot.ai
spectrogram-basic: Spectrogram Time-Frequency Heatmap
Library: altair 6.1.0 | Python 3.13.13
Quality: 92/100 | Updated: 2026-05-15
"""

import os

import altair as alt
import numpy as np
import pandas as pd


# Theme tokens
THEME = os.getenv("ANYPLOT_THEME", "light")
PAGE_BG = "#FAF8F1" if THEME == "light" else "#1A1A17"
ELEVATED_BG = "#FFFDF6" if THEME == "light" else "#242420"
INK = "#1A1A17" if THEME == "light" else "#F0EFE8"
INK_SOFT = "#4A4A44" if THEME == "light" else "#B8B7B0"

# Data: Generate a chirp signal with increasing frequency
np.random.seed(42)
sample_rate = 4000  # Hz
duration = 2.0  # seconds
n_samples = int(sample_rate * duration)
t = np.linspace(0, duration, n_samples)

# Chirp signal: frequency sweeps from 100 Hz to 800 Hz (linear chirp)
f0, f1 = 100, 800
phase = 2 * np.pi * (f0 * t + (f1 - f0) / (2 * duration) * t**2)
chirp_signal = np.sin(phase)

# Add some noise for realism
chirp_signal += np.random.randn(len(chirp_signal)) * 0.1

# Compute spectrogram using numpy FFT (Short-Time Fourier Transform)
nperseg = 256  # Window size
hop_length = 32  # Step between windows (higher overlap for smoother result)
window = np.hanning(nperseg)

# Calculate number of frames
n_frames = (n_samples - nperseg) // hop_length + 1

# Initialize spectrogram matrix
n_freq = nperseg // 2 + 1
Sxx = np.zeros((n_freq, n_frames))

# Compute STFT
for i in range(n_frames):
    start = i * hop_length
    segment = chirp_signal[start : start + nperseg] * window
    fft_result = np.fft.rfft(segment)
    Sxx[:, i] = np.abs(fft_result) ** 2

# Frequency and time arrays
frequencies = np.fft.rfftfreq(nperseg, 1 / sample_rate)
times = (np.arange(n_frames) * hop_length + nperseg / 2) / sample_rate

# Convert power to dB scale
Sxx_db = 10 * np.log10(Sxx + 1e-10)

# Limit frequency range for better visualization (0-1000 Hz)
freq_mask = frequencies <= 1000
frequencies_subset = frequencies[freq_mask]
Sxx_db_subset = Sxx_db[freq_mask, :]

# Create meshgrid and flatten for DataFrame
time_grid, freq_grid = np.meshgrid(times, frequencies_subset)
df = pd.DataFrame(
    {"Time (s)": time_grid.flatten(), "Frequency (Hz)": freq_grid.flatten(), "Power (dB)": Sxx_db_subset.flatten()}
)

# Calculate bin sizes for proper rectangle rendering
time_step = times[1] - times[0] if len(times) > 1 else 0.01
freq_step = frequencies_subset[1] - frequencies_subset[0] if len(frequencies_subset) > 1 else 10

# Add bin edges for proper rectangle sizing
df["time_start"] = df["Time (s)"] - time_step / 2
df["time_end"] = df["Time (s)"] + time_step / 2
df["freq_start"] = df["Frequency (Hz)"] - freq_step / 2
df["freq_end"] = df["Frequency (Hz)"] + freq_step / 2

# Create spectrogram heatmap with Altair using x2/y2 for proper rectangles
chart = (
    alt.Chart(df)
    .mark_rect()
    .encode(
        x=alt.X("time_start:Q", title="Time (s)", scale=alt.Scale(nice=False)),
        x2=alt.X2("time_end:Q"),
        y=alt.Y("freq_start:Q", title="Frequency (Hz)", scale=alt.Scale(nice=False)),
        y2=alt.Y2("freq_end:Q"),
        color=alt.Color(
            "Power (dB):Q",
            scale=alt.Scale(scheme="viridis"),
            legend=alt.Legend(
                title="Power (dB)",
                titleFontSize=18,
                labelFontSize=16,
                gradientLength=400,
                gradientThickness=20,
                fillColor=ELEVATED_BG,
                strokeColor=INK_SOFT,
            ),
        ),
        tooltip=[
            alt.Tooltip("Time (s):Q", format=".3f"),
            alt.Tooltip("Frequency (Hz):Q", format=".1f"),
            alt.Tooltip("Power (dB):Q", format=".1f"),
        ],
    )
    .properties(width=1600, height=900, background=PAGE_BG, title="spectrogram-basic · altair · anyplot.ai")
    .configure_title(fontSize=28, anchor="middle", color=INK)
    .configure_axis(
        labelFontSize=18,
        titleFontSize=22,
        tickSize=10,
        domainColor=INK_SOFT,
        tickColor=INK_SOFT,
        gridColor=INK,
        gridOpacity=0.10,
        labelColor=INK_SOFT,
        titleColor=INK,
    )
    .configure_view(strokeWidth=0, fill=PAGE_BG)
)

# Save outputs
chart.save(f"plot-{THEME}.png", scale_factor=3.0)
chart.save(f"plot-{THEME}.html")
Runnable source as JSON, for any HTTP client: https://api.anyplot.ai/specs/spectrogram-basic/altair/code. Any spec id and library id listed in llms-full.txt fit the same URL shape; every URL below is complete and callable.
{
  "spec_id": "spectrogram-basic",
  "language": "python",
  "library": "altair",
  "page": "https://anyplot.ai/spectrogram-basic/python/altair",
  "hub": "https://anyplot.ai/spectrogram-basic",
  "code_json": "https://api.anyplot.ai/specs/spectrogram-basic/altair/code",
  "spec_json": "https://api.anyplot.ai/specs/spectrogram-basic",
  "render_light_png": "https://storage.googleapis.com/anyplot-images/plots/spectrogram-basic/python/altair/plot-light.png",
  "render_dark_png": "https://storage.googleapis.com/anyplot-images/plots/spectrogram-basic/python/altair/plot-dark.png",
  "interactive_light_html": "https://storage.googleapis.com/anyplot-images/plots/spectrogram-basic/python/altair/plot-light.html",
  "interactive_dark_html": "https://storage.googleapis.com/anyplot-images/plots/spectrogram-basic/python/altair/plot-dark.html",
  "quality_score": 92.0,
  "license": "MIT",
  "guide": "https://anyplot.ai/llms.txt"
}
Part of Spectrogram Time-Frequency Heatmap on anyplot.ai.