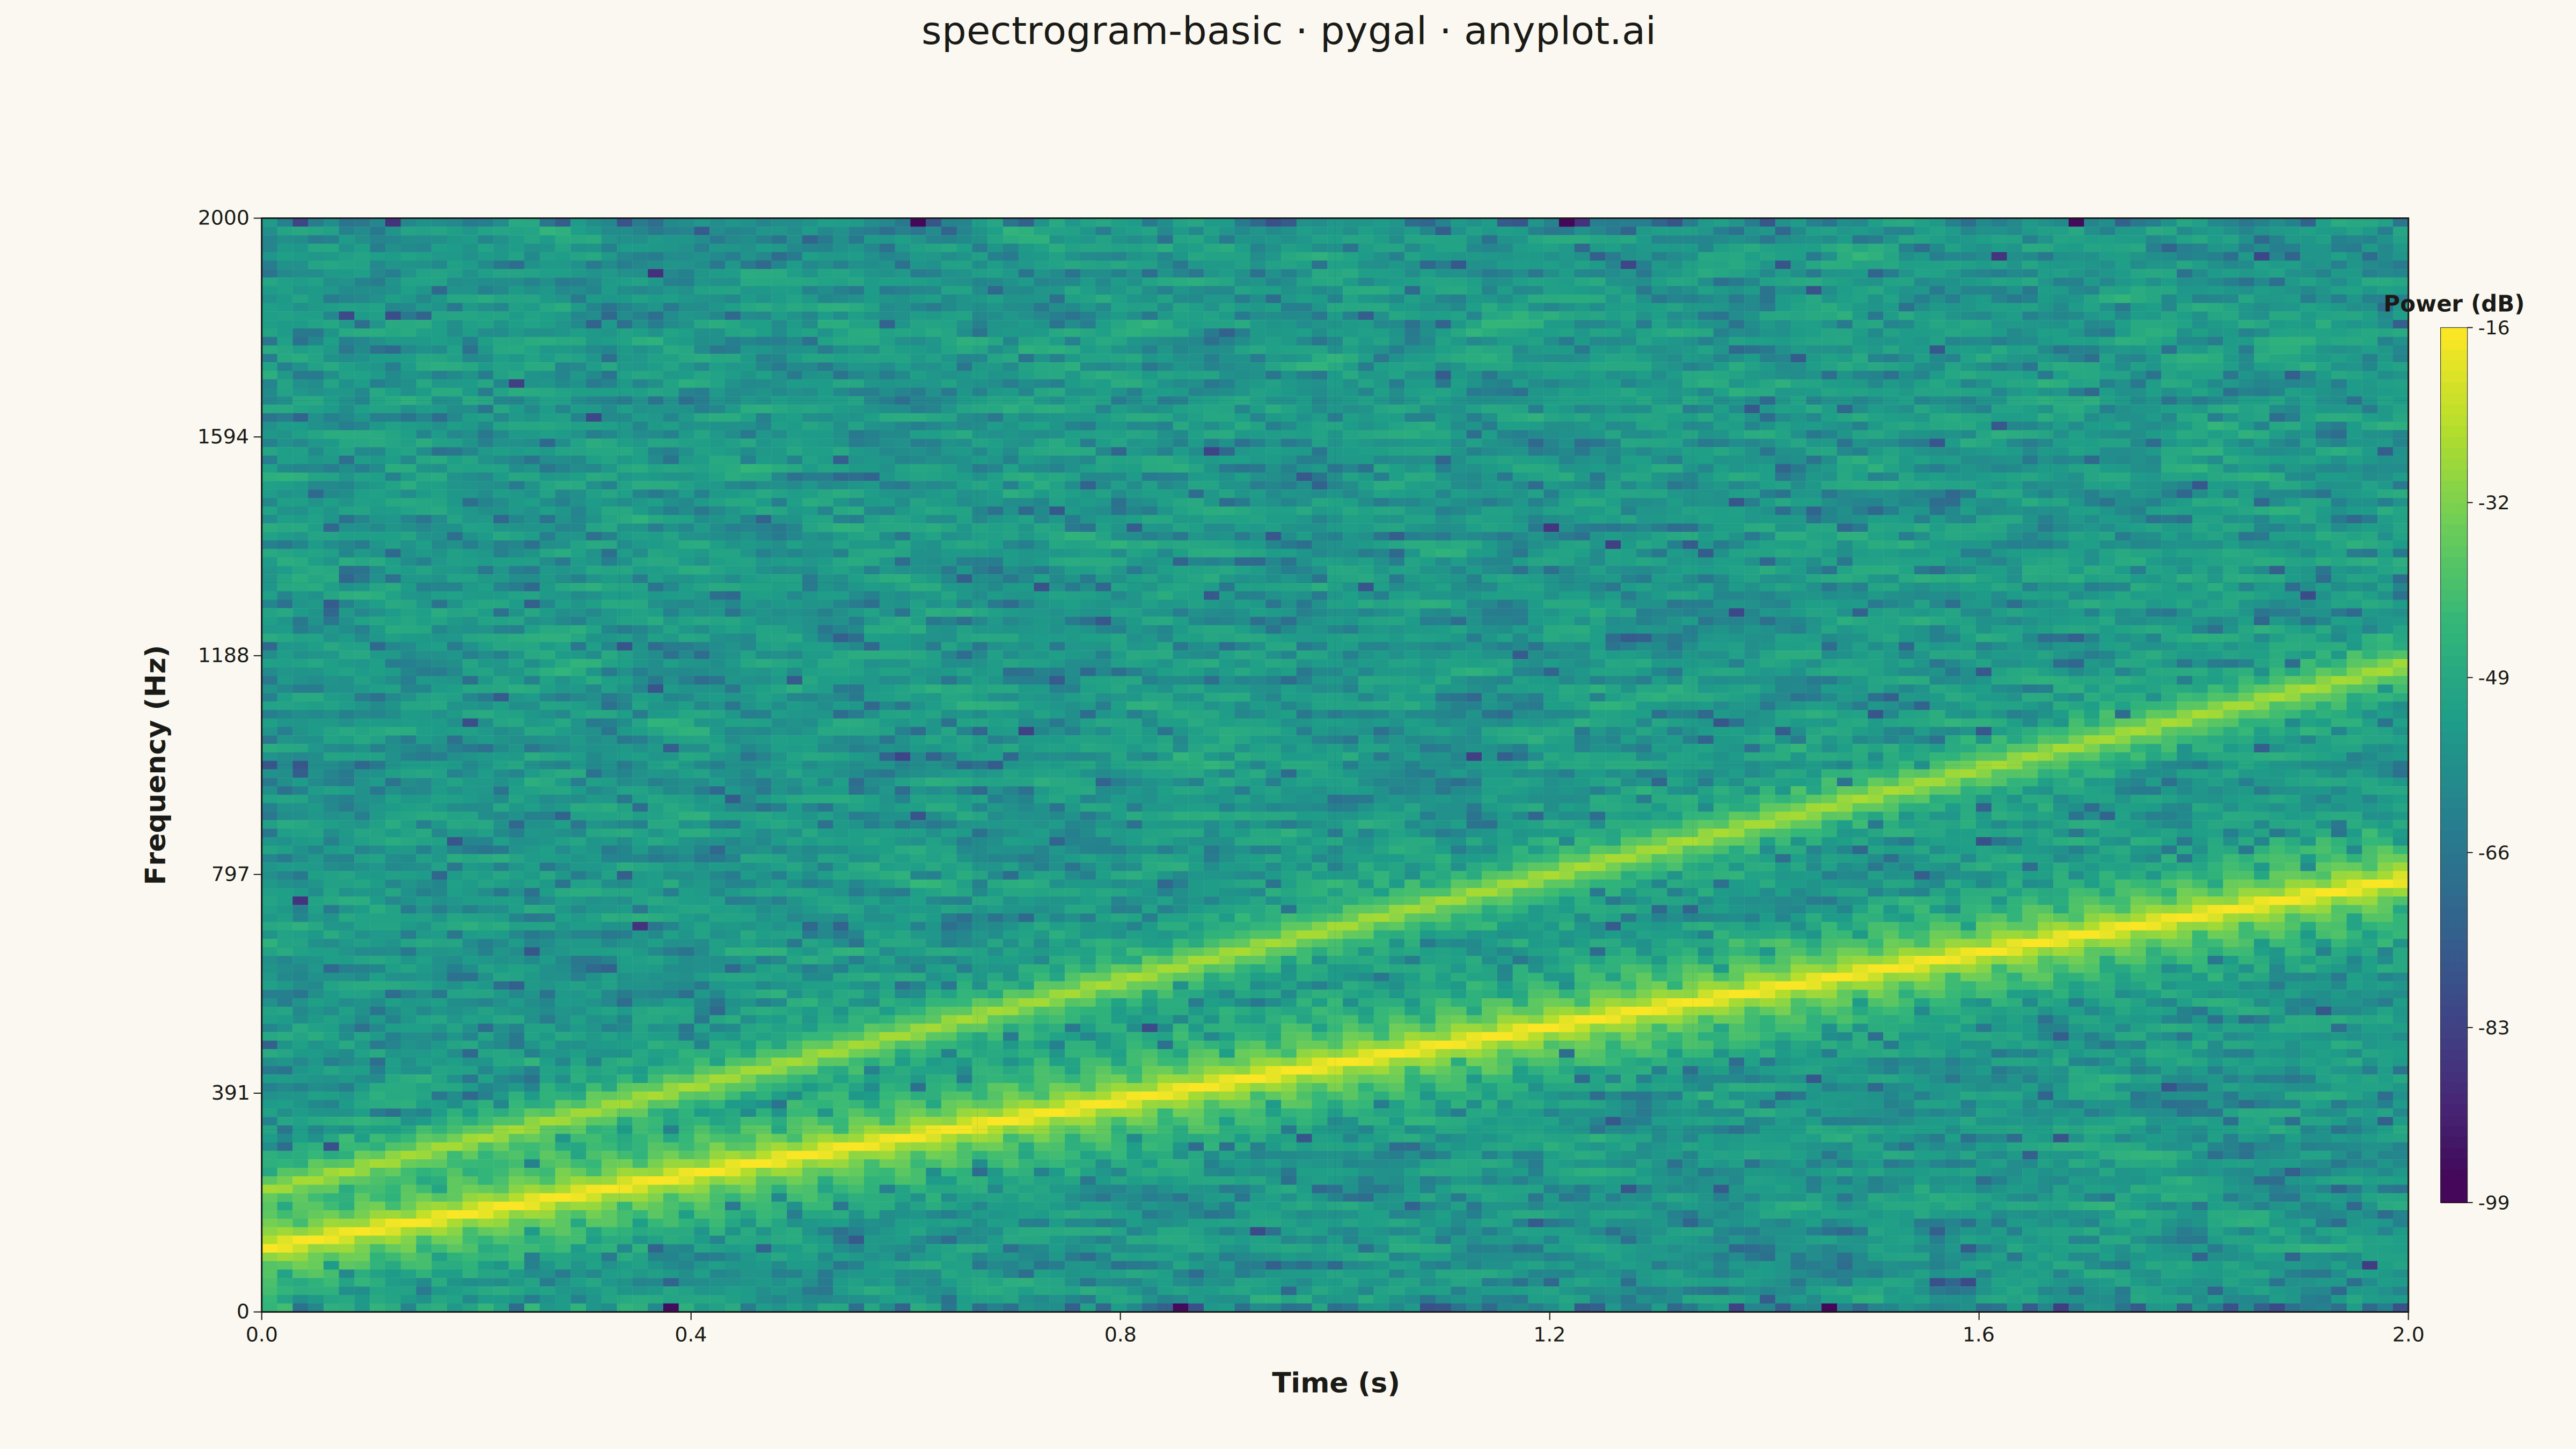
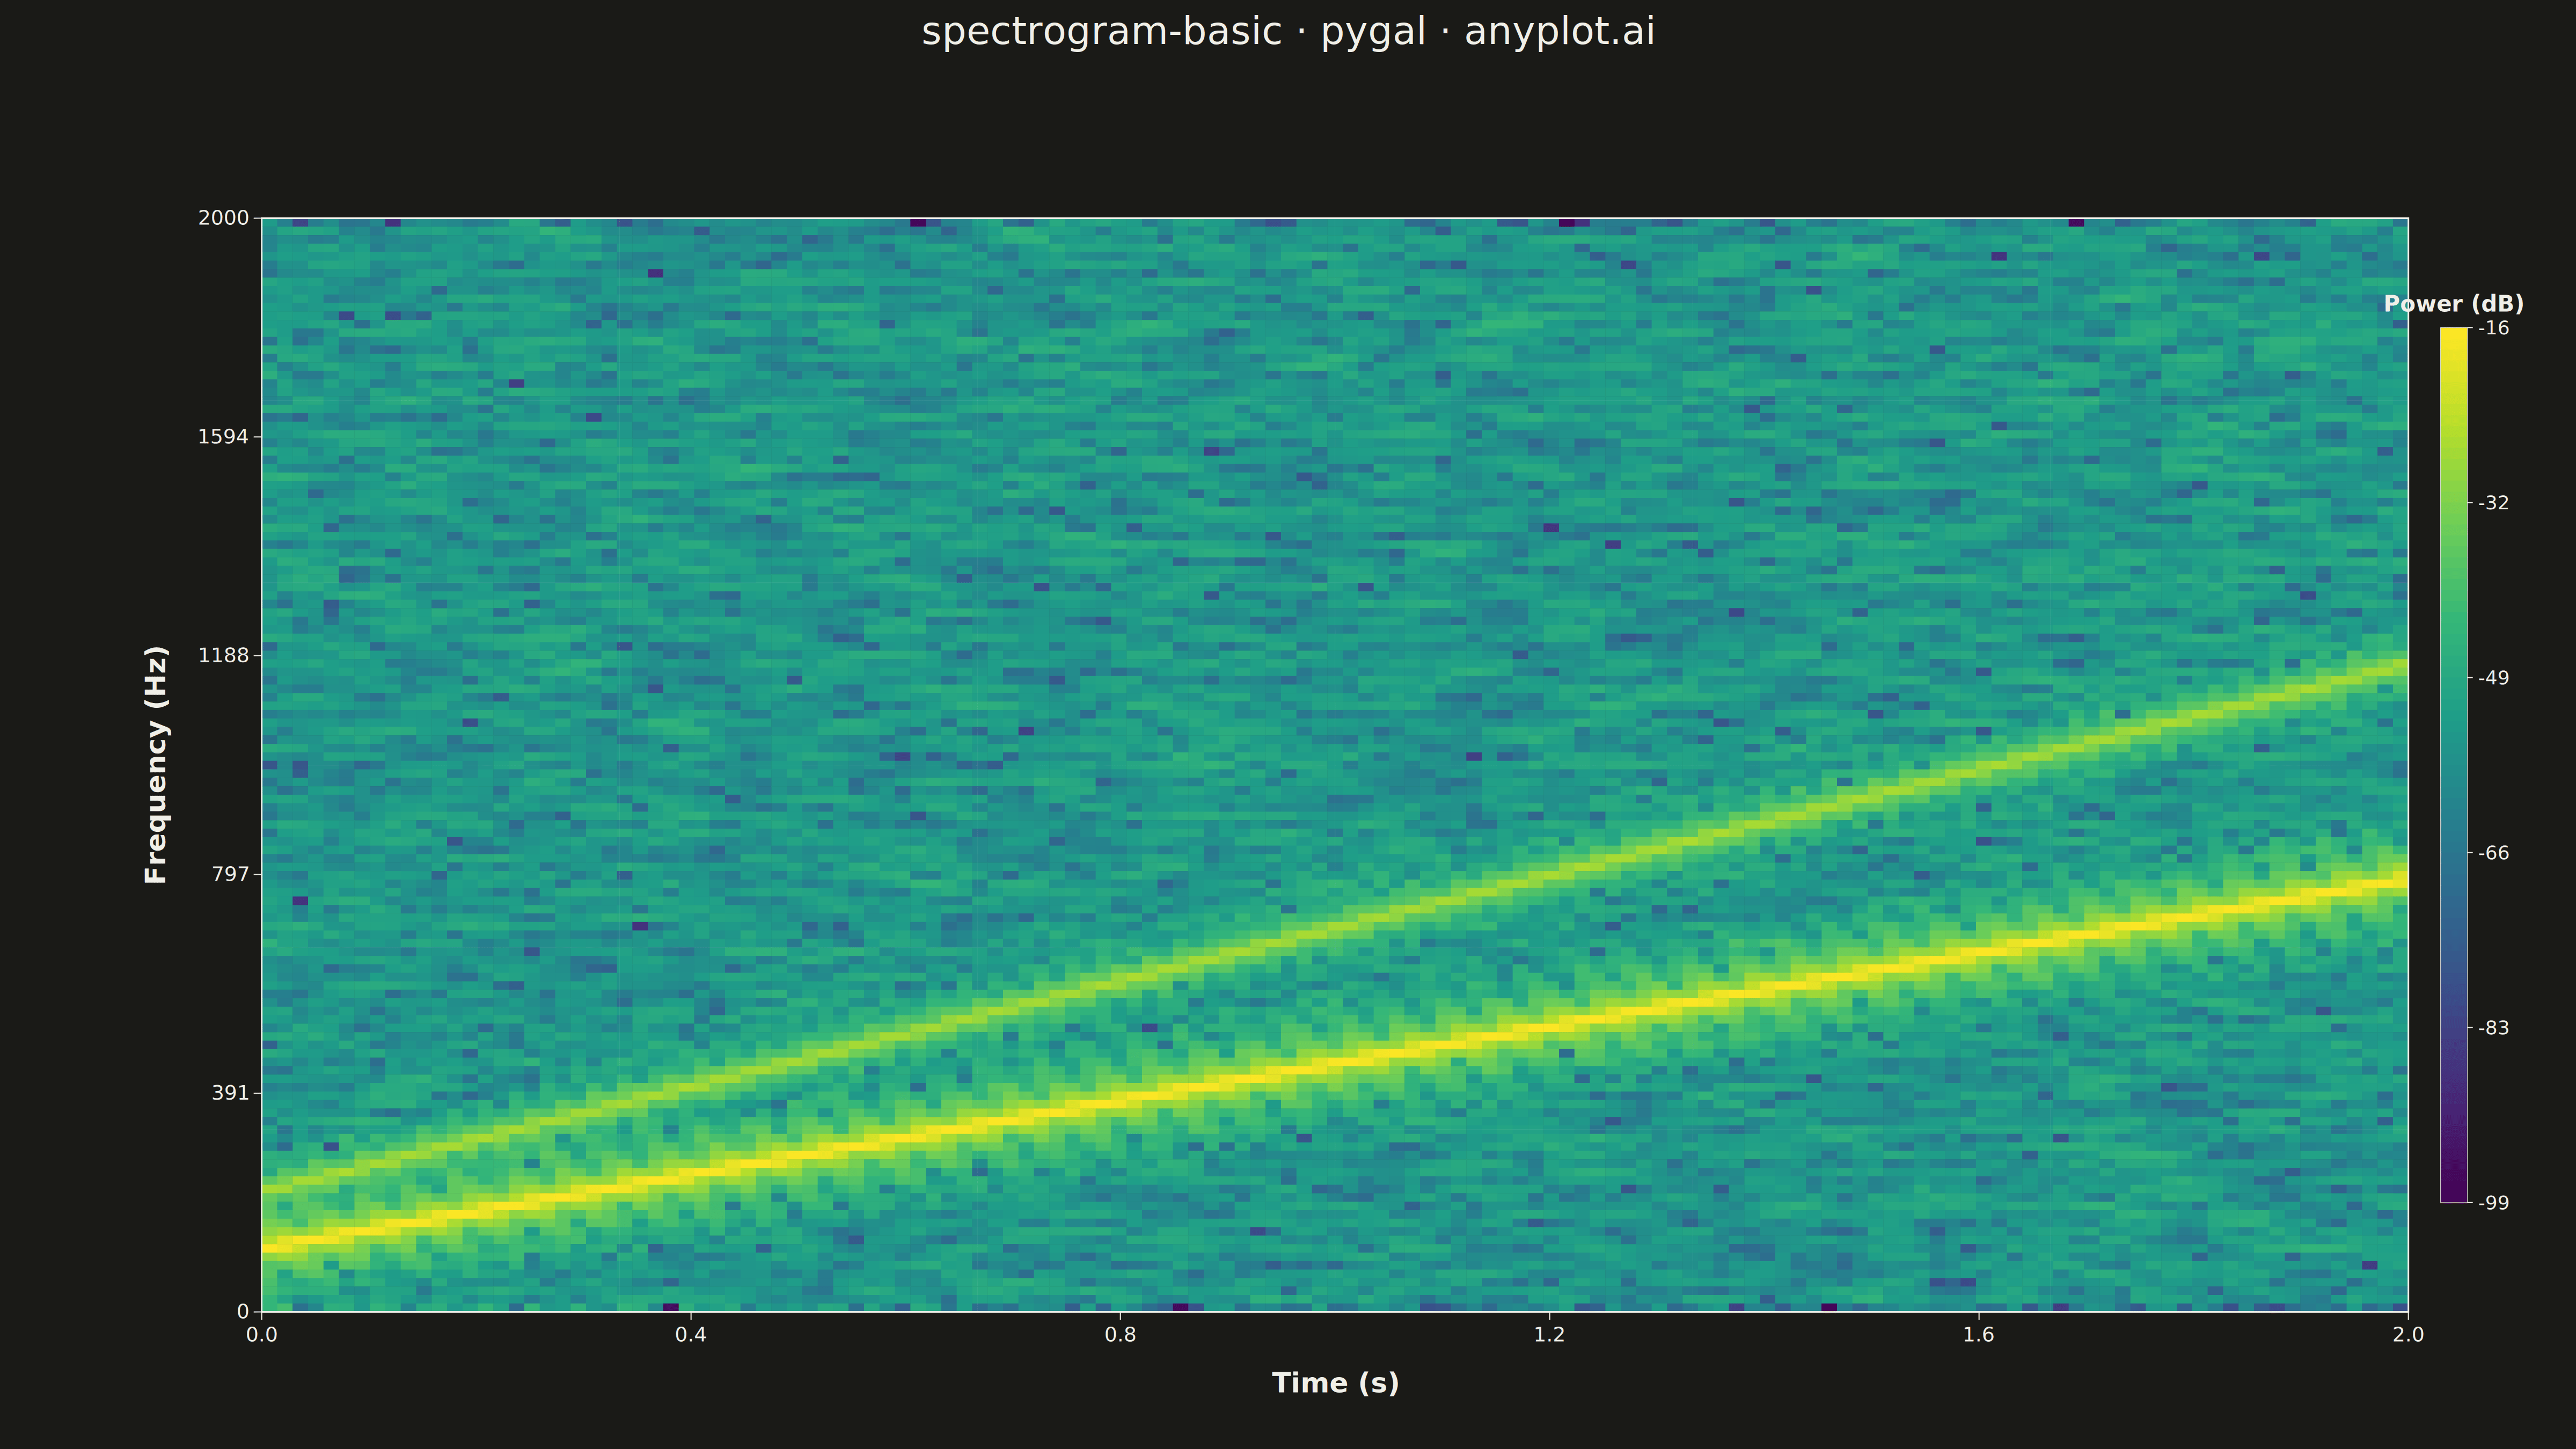
A spectrogram displaying time-frequency representation of a signal as a heatmap. It shows how the frequency content of a signal changes over time, with color intensity representing the amplitude or power at each time-frequency point. Essential for analyzing non-stationary signals where frequency characteristics vary, revealing patterns invisible in time-domain or frequency-domain views alone.
""" anyplot.ai
spectrogram-basic: Spectrogram Time-Frequency Heatmap
Library: pygal 3.1.0 | Python 3.13.13
Quality: 90/100 | Updated: 2026-05-15
"""

import os
import sys

import numpy as np
from scipy import signal


# Temporarily remove current directory from path to avoid name collision
_cwd = sys.path[0] if sys.path[0] else "."
if _cwd in sys.path:
    sys.path.remove(_cwd)

from pygal.graph.graph import Graph
from pygal.style import Style


# Restore path
sys.path.insert(0, _cwd)

# Theme tokens (from default-style-guide.md)
THEME = os.getenv("ANYPLOT_THEME", "light")
PAGE_BG = "#FAF8F1" if THEME == "light" else "#1A1A17"
INK = "#1A1A17" if THEME == "light" else "#F0EFE8"
INK_SOFT = "#4A4A44" if THEME == "light" else "#B8B7B0"
GRID_COLOR = "rgba(26,26,23,0.10)" if THEME == "light" else "rgba(240,239,232,0.10)"


class SpectrogramHeatmap(Graph):
    """Custom Spectrogram visualization for pygal - displays time-frequency representation."""

    def __init__(self, *args, **kwargs):
        self.spectrogram_data = kwargs.pop("spectrogram_data", [])
        self.time_bins = kwargs.pop("time_bins", [])
        self.freq_bins = kwargs.pop("freq_bins", [])
        self.colormap = kwargs.pop(
            "colormap",
            [
                "#440154",
                "#482878",
                "#3e4a89",
                "#31688e",
                "#26828e",
                "#1f9e89",
                "#35b779",
                "#6ece58",
                "#b5de2b",
                "#fde725",
            ],
        )
        self.ink_color = kwargs.pop("ink_color", INK)
        self.grid_color_rgb = kwargs.pop("grid_color_rgb", GRID_COLOR)
        super().__init__(*args, **kwargs)

    def _interpolate_color(self, value, min_val, max_val):
        """Interpolate color for smooth gradient."""
        if max_val == min_val:
            return self.colormap[-1]

        normalized = (value - min_val) / (max_val - min_val)
        normalized = max(0, min(1, normalized))

        pos = normalized * (len(self.colormap) - 1)
        idx1 = int(pos)
        idx2 = min(idx1 + 1, len(self.colormap) - 1)
        frac = pos - idx1

        c1 = self.colormap[idx1]
        c2 = self.colormap[idx2]

        r1, g1, b1 = int(c1[1:3], 16), int(c1[3:5], 16), int(c1[5:7], 16)
        r2, g2, b2 = int(c2[1:3], 16), int(c2[3:5], 16), int(c2[5:7], 16)

        r = int(r1 + (r2 - r1) * frac)
        g = int(g1 + (g2 - g1) * frac)
        b = int(b1 + (b2 - b1) * frac)

        return f"#{r:02x}{g:02x}{b:02x}"

    def _plot(self):
        """Draw the spectrogram heatmap."""
        if len(self.spectrogram_data) == 0:
            return

        n_freq = len(self.spectrogram_data)
        n_time = len(self.spectrogram_data[0]) if n_freq > 0 else 0

        # Find value range
        min_val = np.min(self.spectrogram_data)
        max_val = np.max(self.spectrogram_data)

        # Get plot dimensions
        plot_width = self.view.width
        plot_height = self.view.height

        # Calculate margins for labels
        label_margin_left = 280
        label_margin_bottom = 200
        label_margin_top = 80
        label_margin_right = 280

        available_width = plot_width - label_margin_left - label_margin_right
        available_height = plot_height - label_margin_bottom - label_margin_top

        cell_width = available_width / n_time
        cell_height = available_height / n_freq

        x_offset = self.view.x(0) + label_margin_left
        y_offset = self.view.y(n_freq) + label_margin_top

        # Create group for the spectrogram
        plot_node = self.nodes["plot"]
        spec_group = self.svg.node(plot_node, class_="spectrogram-heatmap")

        # Draw cells (frequency is from top to bottom, highest freq at top)
        for i in range(n_freq):
            for j in range(n_time):
                value = self.spectrogram_data[n_freq - 1 - i][j]
                color = self._interpolate_color(value, min_val, max_val)

                x = x_offset + j * cell_width
                y = y_offset + i * cell_height

                rect = self.svg.node(spec_group, "rect", x=x, y=y, width=cell_width + 0.5, height=cell_height + 0.5)
                rect.set("fill", color)
                rect.set("stroke", "none")

        # Draw subtle grid lines to help read values
        grid_alpha = 0.10
        n_grid_x = 6
        n_grid_y = 6

        # Vertical grid lines
        for i in range(1, n_grid_x):
            grid_x = x_offset + (i / n_grid_x) * available_width
            grid_line = self.svg.node(
                spec_group, "line", x1=grid_x, y1=y_offset, x2=grid_x, y2=y_offset + available_height
            )
            grid_line.set("stroke", self.ink_color)
            grid_line.set("stroke-width", "1")
            grid_line.set("opacity", str(grid_alpha))

        # Horizontal grid lines
        for i in range(1, n_grid_y):
            grid_y = y_offset + (i / n_grid_y) * available_height
            grid_line = self.svg.node(
                spec_group, "line", x1=x_offset, y1=grid_y, x2=x_offset + available_width, y2=grid_y
            )
            grid_line.set("stroke", self.ink_color)
            grid_line.set("stroke-width", "1")
            grid_line.set("opacity", str(grid_alpha))

        # Draw axes border
        border = self.svg.node(
            spec_group, "rect", x=x_offset, y=y_offset, width=available_width, height=available_height
        )
        border.set("fill", "none")
        border.set("stroke", self.ink_color)
        border.set("stroke-width", "3")

        # Draw x-axis label (Time)
        x_label_size = 52
        x_label_x = x_offset + available_width / 2
        x_label_y = y_offset + available_height + 150
        text_node = self.svg.node(spec_group, "text", x=x_label_x, y=x_label_y)
        text_node.set("text-anchor", "middle")
        text_node.set("fill", self.ink_color)
        text_node.set("style", f"font-size:{x_label_size}px;font-weight:bold;font-family:sans-serif")
        text_node.text = "Time (s)"

        # Draw y-axis label (Frequency)
        y_label_size = 52
        y_label_x = x_offset - 180
        y_label_y = y_offset + available_height / 2
        text_node = self.svg.node(
            spec_group, "text", x=y_label_x, y=y_label_y, transform=f"rotate(-90, {y_label_x}, {y_label_y})"
        )
        text_node.set("text-anchor", "middle")
        text_node.set("fill", self.ink_color)
        text_node.set("style", f"font-size:{y_label_size}px;font-weight:bold;font-family:sans-serif")
        text_node.text = "Frequency (Hz)"

        # Draw x-axis ticks and labels
        tick_font_size = 38
        n_x_ticks = 6
        for i in range(n_x_ticks):
            tick_x = x_offset + (i / (n_x_ticks - 1)) * available_width
            tick_y = y_offset + available_height

            # Tick line
            line = self.svg.node(spec_group, "line", x1=tick_x, y1=tick_y, x2=tick_x, y2=tick_y + 15)
            line.set("stroke", self.ink_color)
            line.set("stroke-width", "2")

            # Tick label
            time_val = self.time_bins[int(i / (n_x_ticks - 1) * (len(self.time_bins) - 1))]
            text_node = self.svg.node(spec_group, "text", x=tick_x, y=tick_y + 55)
            text_node.set("text-anchor", "middle")
            text_node.set("fill", self.ink_color)
            text_node.set("style", f"font-size:{tick_font_size}px;font-family:sans-serif")
            text_node.text = f"{time_val:.1f}"

        # Draw y-axis ticks and labels
        n_y_ticks = 6
        for i in range(n_y_ticks):
            tick_x = x_offset
            tick_y = y_offset + (i / (n_y_ticks - 1)) * available_height

            # Tick line
            line = self.svg.node(spec_group, "line", x1=tick_x - 15, y1=tick_y, x2=tick_x, y2=tick_y)
            line.set("stroke", self.ink_color)
            line.set("stroke-width", "2")

            # Tick label (frequency decreases from top to bottom)
            freq_idx = int((1 - i / (n_y_ticks - 1)) * (len(self.freq_bins) - 1))
            freq_val = self.freq_bins[freq_idx]
            text_node = self.svg.node(spec_group, "text", x=tick_x - 25, y=tick_y + 12)
            text_node.set("text-anchor", "end")
            text_node.set("fill", self.ink_color)
            text_node.set("style", f"font-size:{tick_font_size}px;font-family:sans-serif")
            text_node.text = f"{freq_val:.0f}"

        # Draw colorbar
        colorbar_width = 50
        colorbar_height = available_height * 0.8
        colorbar_x = x_offset + available_width + 60
        colorbar_y = y_offset + (available_height - colorbar_height) / 2

        # Draw gradient colorbar
        n_segments = 80
        segment_height = colorbar_height / n_segments
        for i in range(n_segments):
            seg_value = min_val + (max_val - min_val) * (n_segments - 1 - i) / (n_segments - 1)
            seg_color = self._interpolate_color(seg_value, min_val, max_val)
            seg_y = colorbar_y + i * segment_height

            self.svg.node(
                spec_group,
                "rect",
                x=colorbar_x,
                y=seg_y,
                width=colorbar_width,
                height=segment_height + 1,
                fill=seg_color,
            )

        # Colorbar border
        self.svg.node(
            spec_group,
            "rect",
            x=colorbar_x,
            y=colorbar_y,
            width=colorbar_width,
            height=colorbar_height,
            fill="none",
            stroke=self.ink_color,
        )

        # Colorbar labels - 6 tick marks for more granular scale
        cb_label_size = 36
        n_cb_ticks = 6
        cb_positions = [i / (n_cb_ticks - 1) for i in range(n_cb_ticks)]
        cb_values = [max_val - (max_val - min_val) * pos for pos in cb_positions]
        for val, pos in zip(cb_values, cb_positions, strict=True):
            text_y = colorbar_y + pos * colorbar_height + cb_label_size * 0.35
            # Add tick line on colorbar
            tick_line = self.svg.node(
                spec_group,
                "line",
                x1=colorbar_x + colorbar_width,
                y1=colorbar_y + pos * colorbar_height,
                x2=colorbar_x + colorbar_width + 10,
                y2=colorbar_y + pos * colorbar_height,
            )
            tick_line.set("stroke", self.ink_color)
            tick_line.set("stroke-width", "2")
            text_node = self.svg.node(spec_group, "text", x=colorbar_x + colorbar_width + 20, y=text_y)
            text_node.set("fill", self.ink_color)
            text_node.set("style", f"font-size:{cb_label_size}px;font-family:sans-serif")
            text_node.text = f"{val:.0f}"

        # Colorbar title
        cb_title_size = 42
        cb_title_x = colorbar_x + colorbar_width / 2
        cb_title_y = colorbar_y - 30
        text_node = self.svg.node(spec_group, "text", x=cb_title_x, y=cb_title_y)
        text_node.set("text-anchor", "middle")
        text_node.set("fill", self.ink_color)
        text_node.set("style", f"font-size:{cb_title_size}px;font-weight:bold;font-family:sans-serif")
        text_node.text = "Power (dB)"

    def _compute(self):
        """Compute the box for rendering."""
        n_freq = len(self.spectrogram_data) if len(self.spectrogram_data) > 0 else 1
        n_time = (
            len(self.spectrogram_data[0]) if len(self.spectrogram_data) > 0 and len(self.spectrogram_data[0]) > 0 else 1
        )
        self._box.xmin = 0
        self._box.xmax = n_time
        self._box.ymin = 0
        self._box.ymax = n_freq


# Generate data - chirp signal with increasing frequency
np.random.seed(42)

# Signal parameters
sample_rate = 4000  # Hz
duration = 2.0  # seconds
t = np.linspace(0, duration, int(sample_rate * duration))

# Create chirp signal: frequency increases from 100 Hz to 800 Hz
f0 = 100  # Start frequency
f1 = 800  # End frequency
chirp_signal = signal.chirp(t, f0=f0, f1=f1, t1=duration, method="linear")

# Add some harmonics and noise for interest
chirp_signal += 0.3 * signal.chirp(t, f0=f0 * 2, f1=f1 * 1.5, t1=duration, method="linear")
chirp_signal += 0.1 * np.random.randn(len(t))

# Compute spectrogram
nperseg = 256
noverlap = 200
frequencies, times, Sxx = signal.spectrogram(chirp_signal, fs=sample_rate, nperseg=nperseg, noverlap=noverlap)

# Convert to dB scale
Sxx_db = 10 * np.log10(Sxx + 1e-10)

# Downsample for visualization (pygal renders individual cells)
# Higher resolution for smoother appearance while maintaining performance
freq_step = max(1, len(frequencies) // 80)
time_step = max(1, len(times) // 128)

freq_subset = frequencies[::freq_step]
time_subset = times[::time_step]
Sxx_subset = Sxx_db[::freq_step, ::time_step]

# Custom style (theme-adaptive)
custom_style = Style(
    background=PAGE_BG,
    plot_background=PAGE_BG,
    foreground=INK,
    foreground_strong=INK,
    foreground_subtle=INK_SOFT,
    colors=("#009E73",),
    title_font_size=72,
    legend_font_size=48,
    label_font_size=42,
    value_font_size=36,
    font_family="sans-serif",
)

# Viridis colormap for perceptually uniform magnitude representation
viridis_colormap = [
    "#440154",
    "#482878",
    "#3e4a89",
    "#31688e",
    "#26828e",
    "#1f9e89",
    "#35b779",
    "#6ece58",
    "#b5de2b",
    "#fde725",
]

# Create spectrogram chart (16:9 aspect ratio)
chart = SpectrogramHeatmap(
    width=4800,
    height=2700,
    style=custom_style,
    title="spectrogram-basic · pygal · anyplot.ai",
    spectrogram_data=Sxx_subset.tolist(),
    time_bins=time_subset.tolist(),
    freq_bins=freq_subset.tolist(),
    colormap=viridis_colormap,
    ink_color=INK,
    grid_color_rgb=GRID_COLOR,
    show_legend=False,
    margin=120,
    margin_top=200,
    margin_bottom=100,
    show_x_labels=False,
    show_y_labels=False,
)

# Add a dummy series to trigger _plot
chart.add("", [0])

# Save output with theme-suffixed filenames
chart.render_to_file(f"plot-{THEME}.svg")
chart.render_to_png(f"plot-{THEME}.png")

# Also save HTML for interactivity
html_content = f"""<!DOCTYPE html>
<html>
<head>
    <meta charset="utf-8">
    <title>spectrogram-basic - pygal</title>
    <style>
        body {{ margin: 0; display: flex; justify-content: center; align-items: center; min-height: 100vh; background: {PAGE_BG}; }}
        .chart {{ max-width: 100%; height: auto; }}
    </style>
</head>
<body>
    <figure class="chart">
        {chart.render(is_unicode=True)}
    </figure>
</body>
</html>
"""

with open(f"plot-{THEME}.html", "w", encoding="utf-8") as f:
    f.write(html_content)
Runnable source as JSON, for any HTTP client: https://api.anyplot.ai/specs/spectrogram-basic/pygal/code. Any spec id and library id listed in llms-full.txt fit the same URL shape; every URL below is complete and callable.
{
  "spec_id": "spectrogram-basic",
  "language": "python",
  "library": "pygal",
  "page": "https://anyplot.ai/spectrogram-basic/python/pygal",
  "hub": "https://anyplot.ai/spectrogram-basic",
  "code_json": "https://api.anyplot.ai/specs/spectrogram-basic/pygal/code",
  "spec_json": "https://api.anyplot.ai/specs/spectrogram-basic",
  "render_light_png": "https://storage.googleapis.com/anyplot-images/plots/spectrogram-basic/python/pygal/plot-light.png",
  "render_dark_png": "https://storage.googleapis.com/anyplot-images/plots/spectrogram-basic/python/pygal/plot-dark.png",
  "interactive_light_html": "https://storage.googleapis.com/anyplot-images/plots/spectrogram-basic/python/pygal/plot-light.html",
  "interactive_dark_html": "https://storage.googleapis.com/anyplot-images/plots/spectrogram-basic/python/pygal/plot-dark.html",
  "quality_score": 90.0,
  "license": "MIT",
  "guide": "https://anyplot.ai/llms.txt"
}
Part of Spectrogram Time-Frequency Heatmap on anyplot.ai.