The same plot in 14 other libraries — JavaScript: Chart.js, D3.js, Highcharts, MUI X Charts; Python: Altair, Bokeh, lets-plot, Matplotlib, Plotly, plotnine, Pygal, Seaborn; R: ggplot2; Julia: Makie.jl. Compare all 15 side by side: Spectrogram Time-Frequency Heatmap in Python, R, Julia and JavaScript.
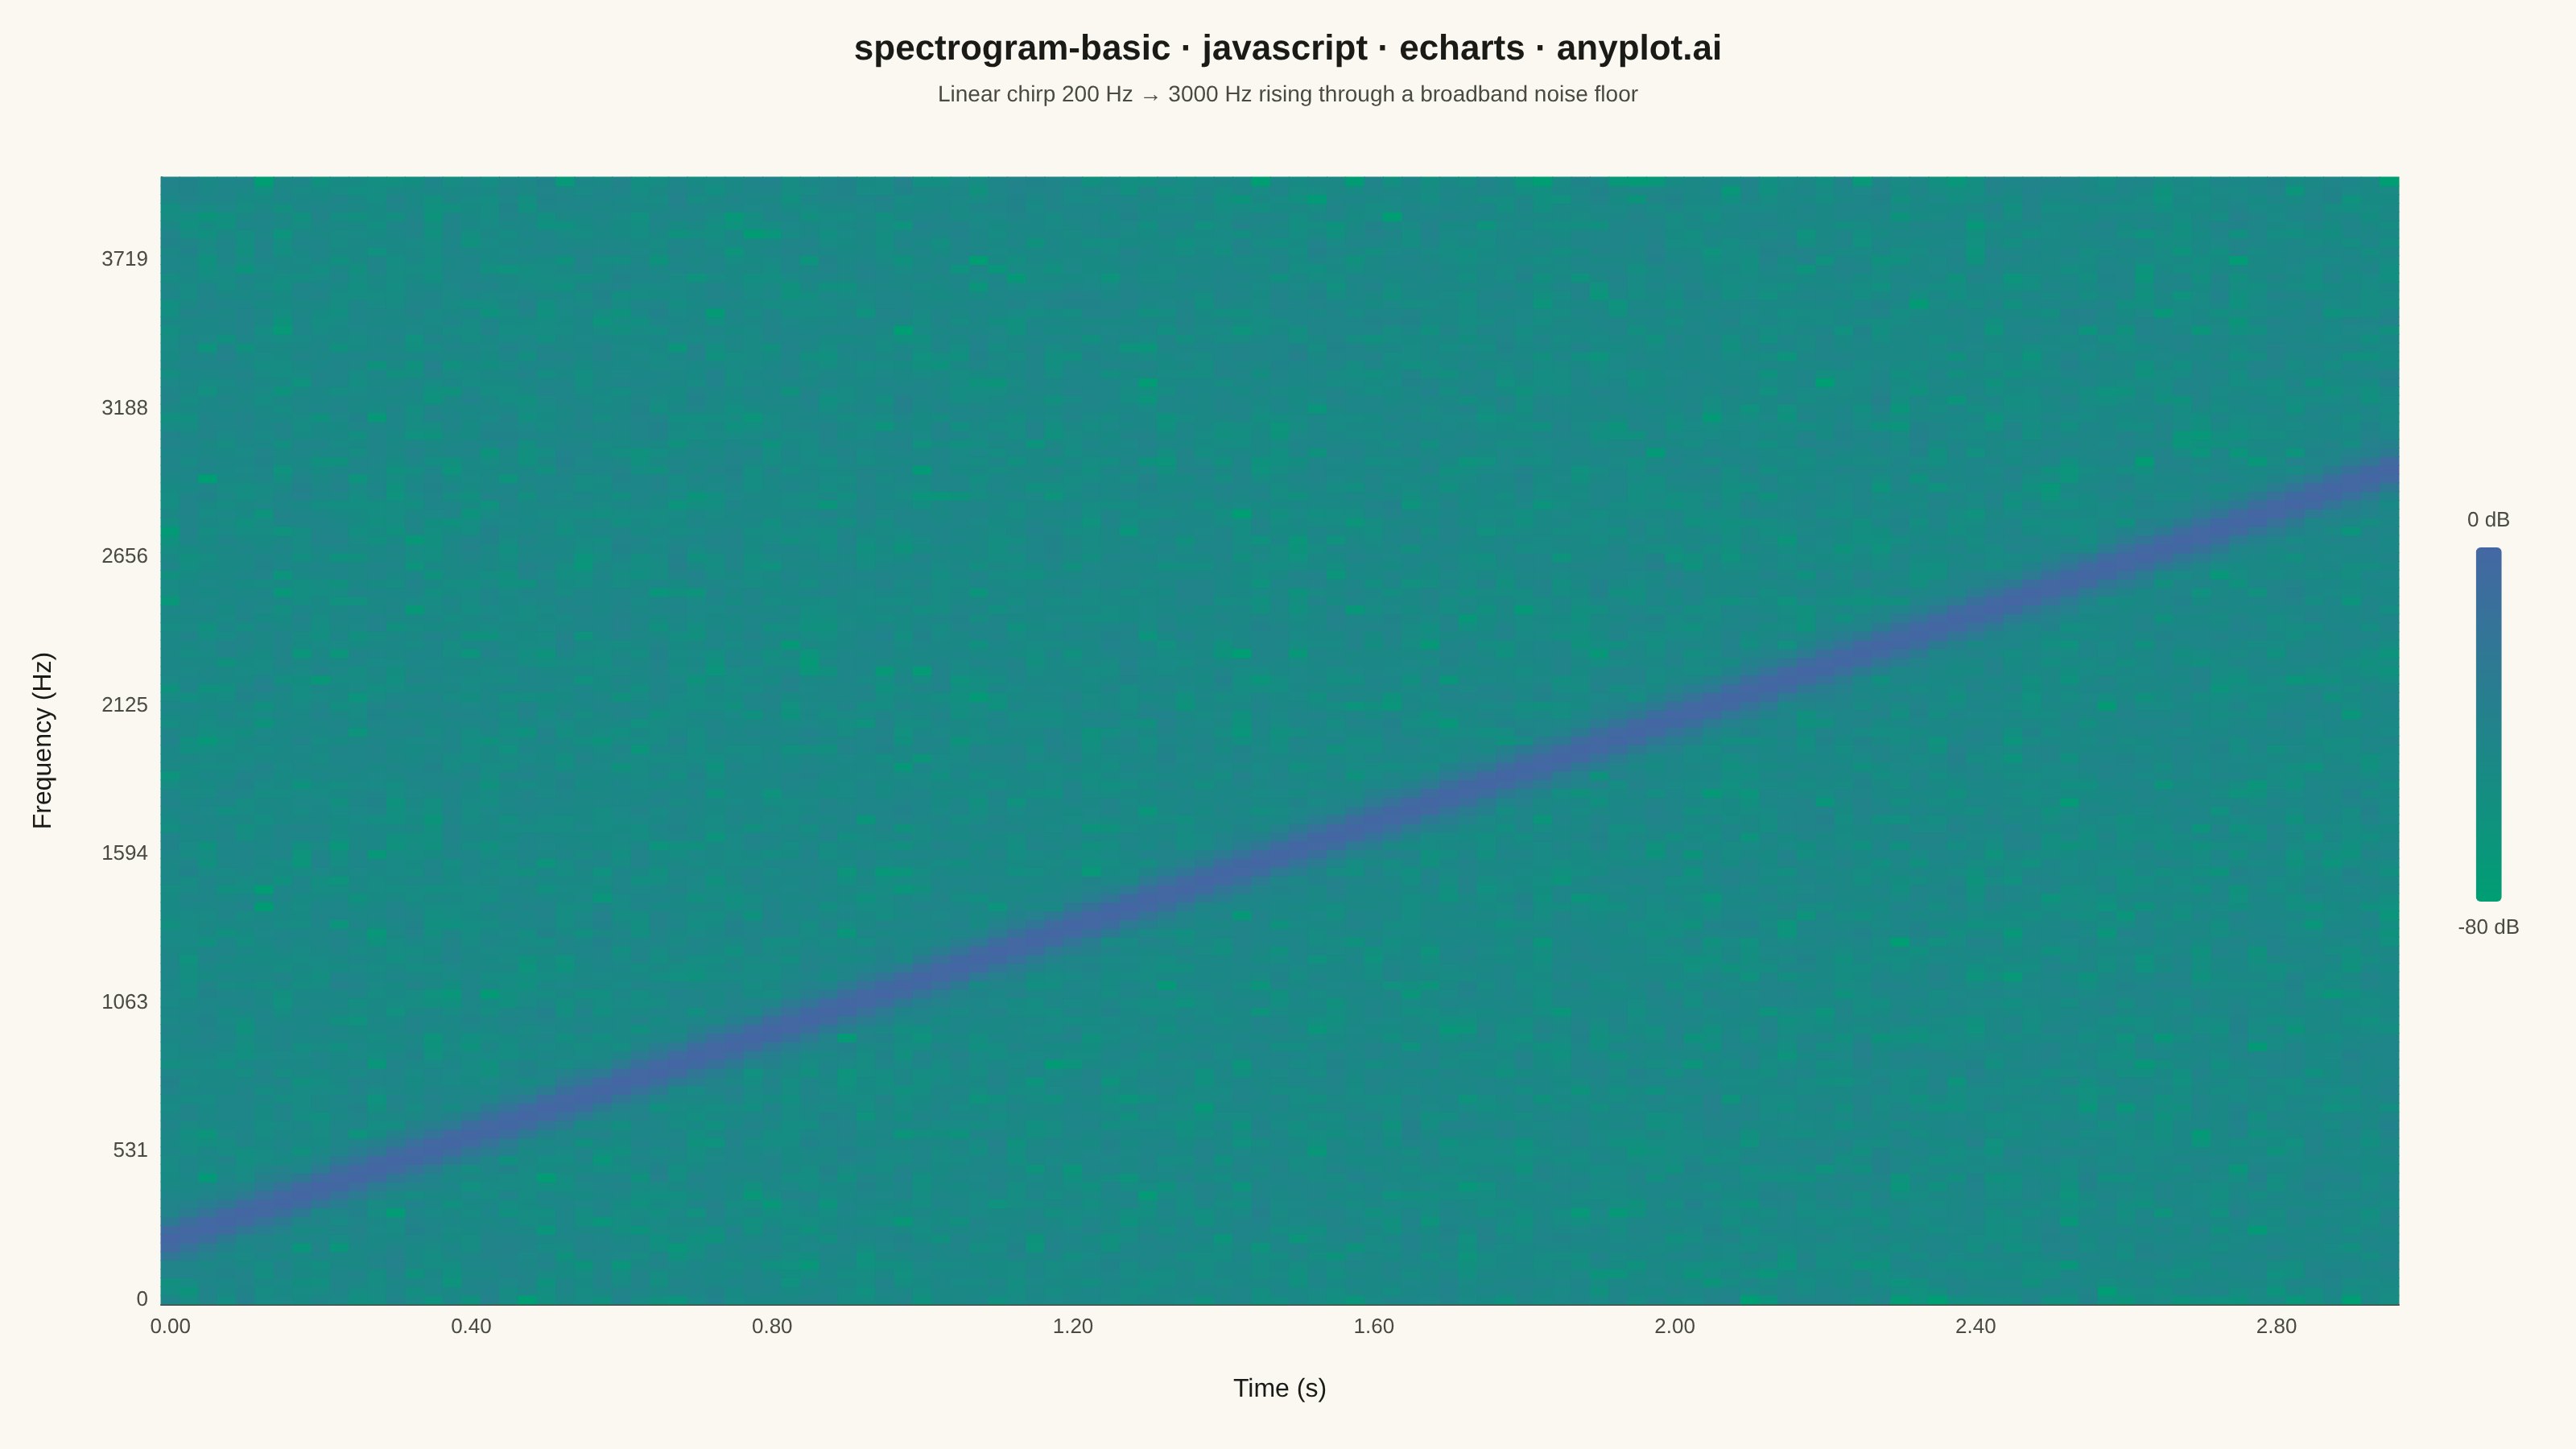
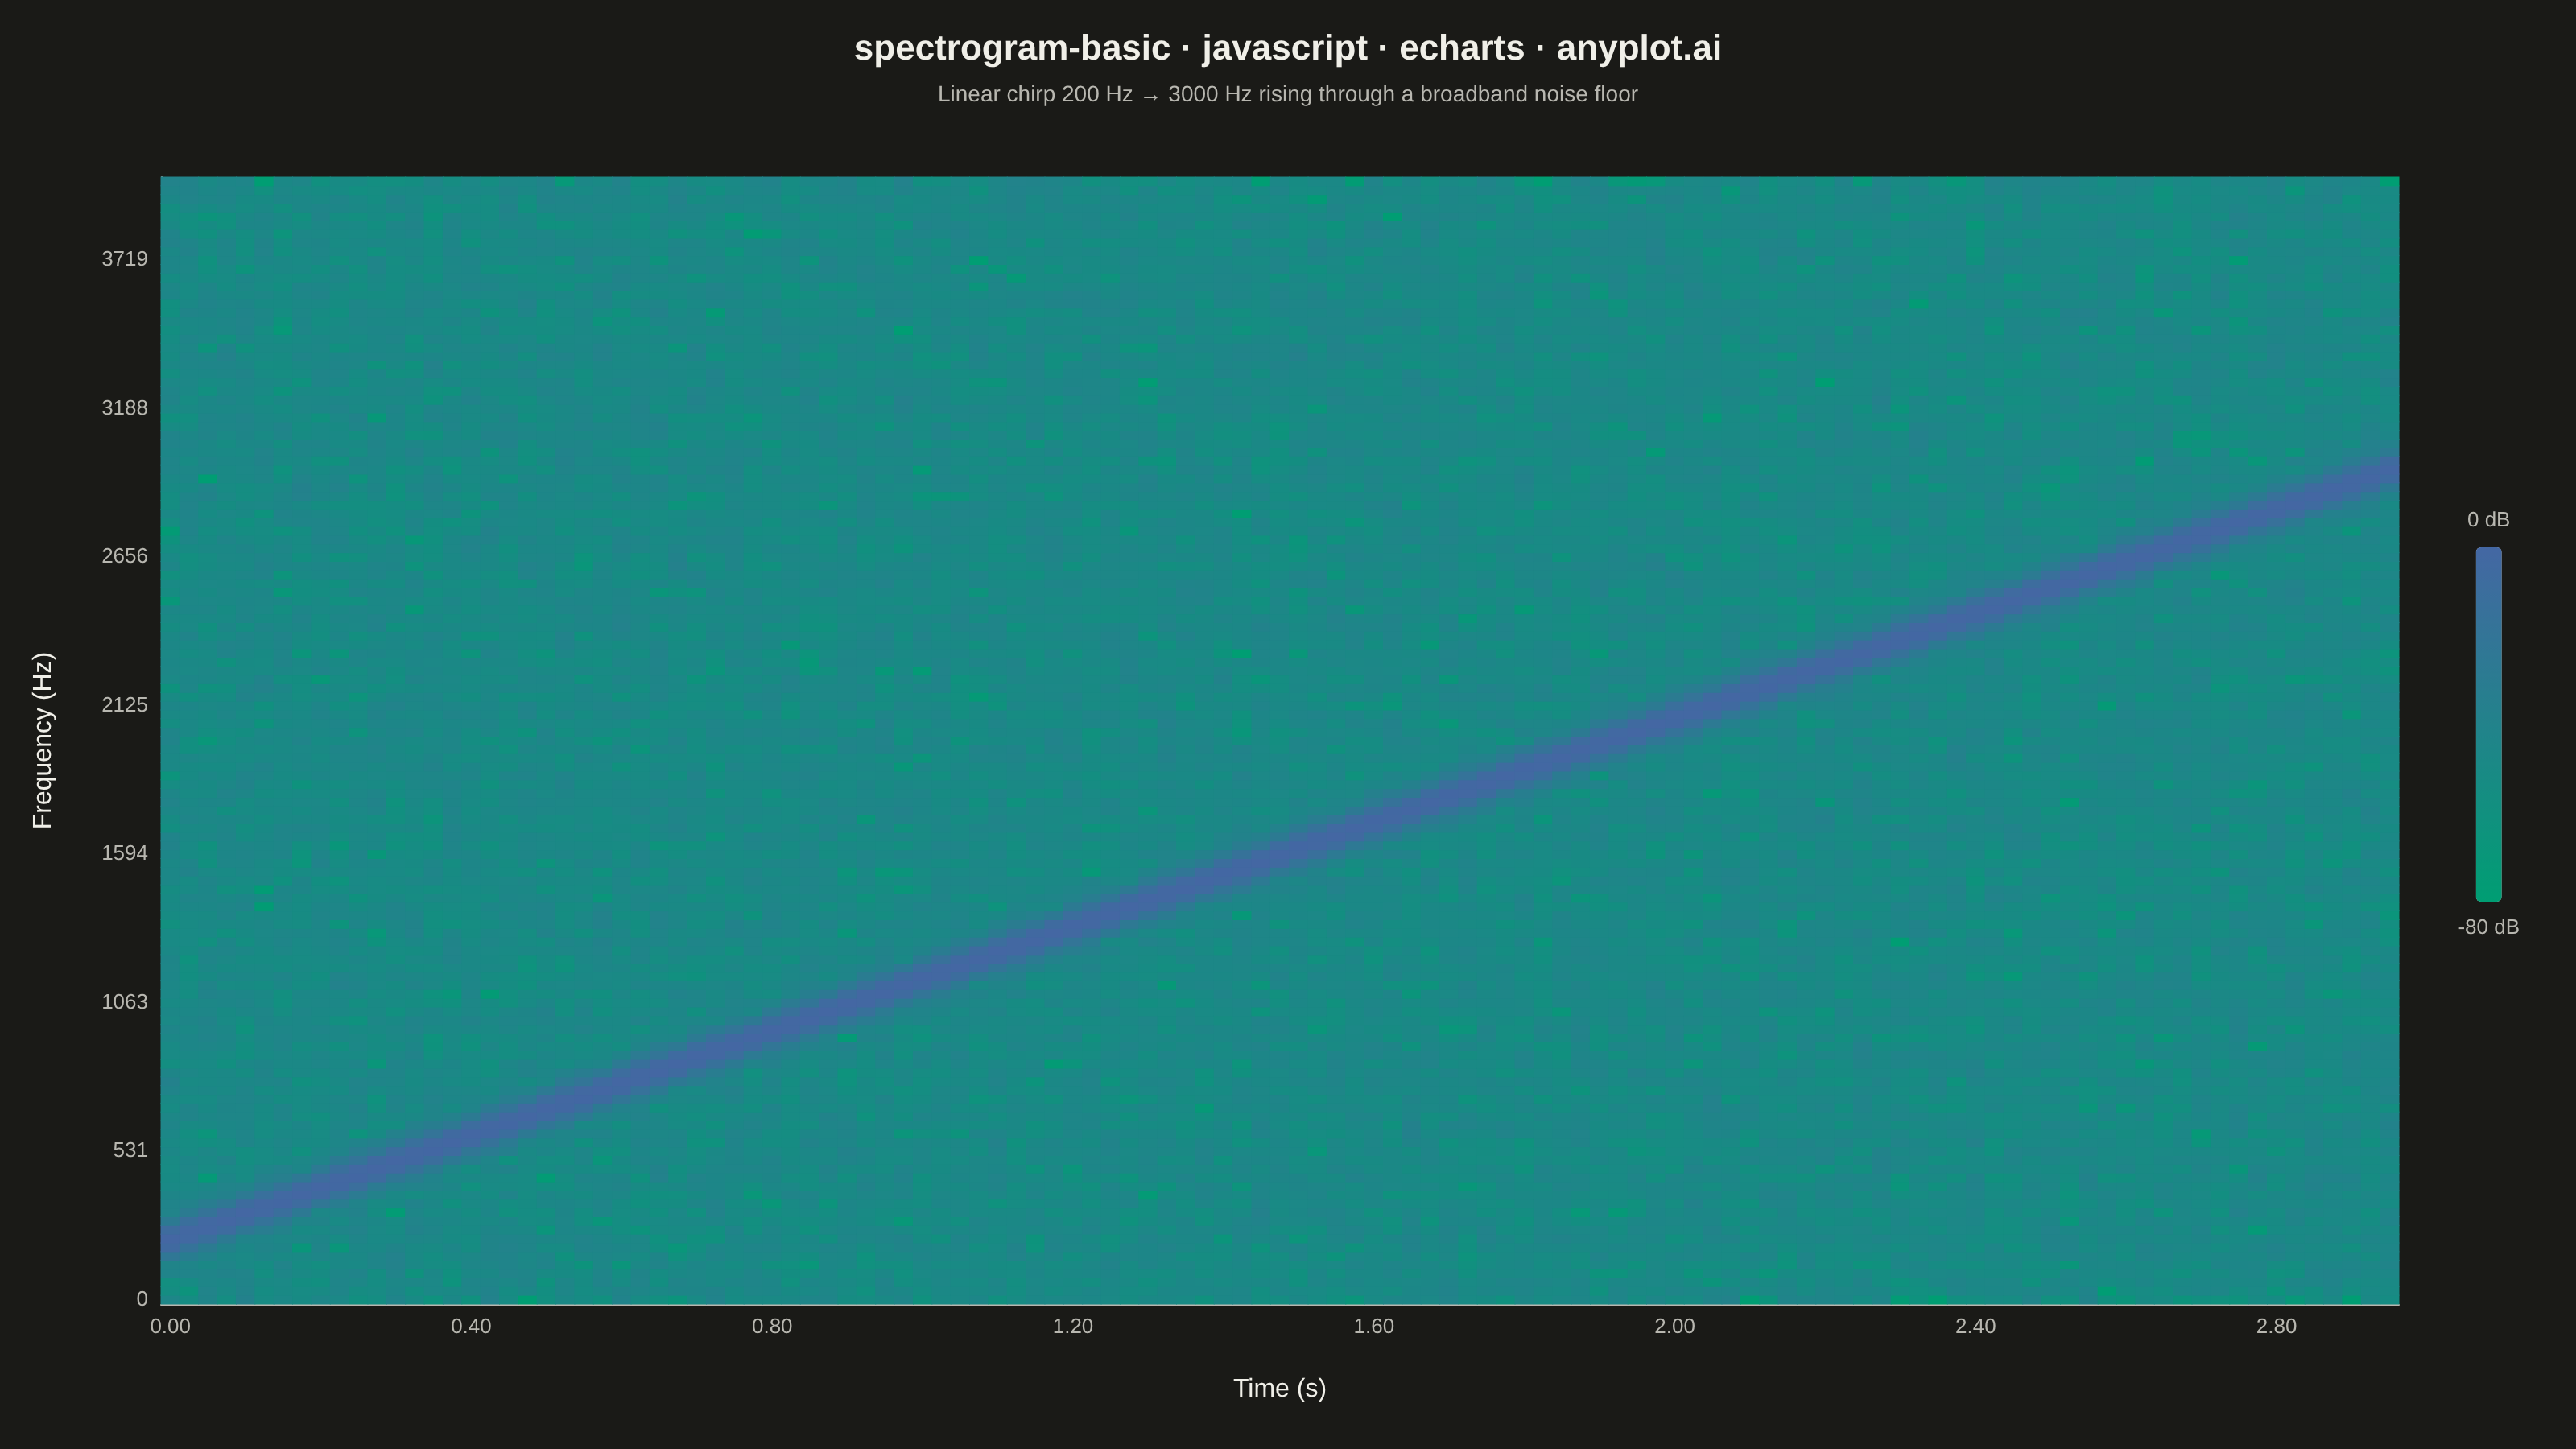
A spectrogram displaying time-frequency representation of a signal as a heatmap. It shows how the frequency content of a signal changes over time, with color intensity representing the amplitude or power at each time-frequency point. Essential for analyzing non-stationary signals where frequency characteristics vary, revealing patterns invisible in time-domain or frequency-domain views alone.
// anyplot.ai
// spectrogram-basic: Spectrogram Time-Frequency Heatmap
// Library: echarts 6.1.0 | JavaScript 22.23.2
// Quality: 89/100 | Created: 2026-09-09

const t = window.ANYPLOT_TOKENS;

// --- Signal (deterministic linear chirp, no RNG needed) --------------------
const sampleRate = 8000; // Hz
const duration = 3.0; // seconds
const numSamples = Math.round(sampleRate * duration);
const startFreq = 200; // Hz
const endFreq = 3000; // Hz
const chirpRate = (endFreq - startFreq) / duration;

// Small fixed-seed LCG for reproducible broadband background noise (no Math.random).
let noiseSeed = 42;
function nextNoise() {
  noiseSeed = (noiseSeed * 1103515245 + 12345) & 0x7fffffff;
  return (noiseSeed / 0x7fffffff) * 2 - 1;
}

const noiseAmplitude = 0.05;
const signal = new Float64Array(numSamples);
for (let n = 0; n < numSamples; n++) {
  const time = n / sampleRate;
  const phase = 2 * Math.PI * (startFreq * time + (chirpRate * time * time) / 2);
  signal[n] = Math.sin(phase) + noiseAmplitude * nextNoise();
}

// --- Short-time Fourier transform --------------------------------------------
const windowSize = 256; // must be a power of two for the FFT below
const hopSize = 200;
const numFreqBins = windowSize / 2 + 1;
const numFrames = Math.floor((numSamples - windowSize) / hopSize) + 1;

const hannWindow = new Float64Array(windowSize);
for (let i = 0; i < windowSize; i++) {
  hannWindow[i] = 0.5 - 0.5 * Math.cos((2 * Math.PI * i) / (windowSize - 1));
}

// In-place iterative radix-2 Cooley-Tukey FFT (real/imag arrays, length = power of two).
function fft(real, imag) {
  const n = real.length;
  for (let i = 1, j = 0; i < n; i++) {
    let bit = n >> 1;
    for (; j & bit; bit >>= 1) j ^= bit;
    j ^= bit;
    if (i < j) {
      [real[i], real[j]] = [real[j], real[i]];
      [imag[i], imag[j]] = [imag[j], imag[i]];
    }
  }
  for (let len = 2; len <= n; len <<= 1) {
    const angle = (-2 * Math.PI) / len;
    const wr = Math.cos(angle);
    const wi = Math.sin(angle);
    for (let i = 0; i < n; i += len) {
      let curWr = 1;
      let curWi = 0;
      for (let k = 0; k < len / 2; k++) {
        const evenR = real[i + k];
        const evenI = imag[i + k];
        const oddR = real[i + k + len / 2] * curWr - imag[i + k + len / 2] * curWi;
        const oddI = real[i + k + len / 2] * curWi + imag[i + k + len / 2] * curWr;
        real[i + k] = evenR + oddR;
        imag[i + k] = evenI + oddI;
        real[i + k + len / 2] = evenR - oddR;
        imag[i + k + len / 2] = evenI - oddI;
        const nextWr = curWr * wr - curWi * wi;
        const nextWi = curWr * wi + curWi * wr;
        curWr = nextWr;
        curWi = nextWi;
      }
    }
  }
}

const timeLabels = [];
const freqLabels = [];
for (let f = 0; f < numFreqBins; f++) {
  freqLabels.push(Math.round((f * sampleRate) / windowSize));
}

let peakDb = -Infinity;
const powerDb = [];
for (let frame = 0; frame < numFrames; frame++) {
  const start = frame * hopSize;
  timeLabels.push((start / sampleRate).toFixed(2));

  const real = new Float64Array(windowSize);
  const imag = new Float64Array(windowSize);
  for (let i = 0; i < windowSize; i++) {
    real[i] = signal[start + i] * hannWindow[i];
  }
  fft(real, imag);

  for (let f = 0; f < numFreqBins; f++) {
    const magnitude = Math.sqrt(real[f] * real[f] + imag[f] * imag[f]) / windowSize;
    const db = 20 * Math.log10(magnitude + 1e-8);
    if (db > peakDb) peakDb = db;
    powerDb.push([frame, f, db]);
  }
}

// Normalize to dB relative to the signal's peak, floored at -80 dB.
const heatmapData = powerDb.map(([frame, f, db]) => [frame, f, Math.round(Math.max(db - peakDb, -80) * 10) / 10]);

// --- Init ---------------------------------------------------------------
const chart = echarts.init(document.getElementById("container"));

// --- Option ---------------------------------------------------------------
chart.setOption({
  animation: false,
  backgroundColor: "transparent",
  title: {
    text: "spectrogram-basic · javascript · echarts · anyplot.ai",
    subtext: "Linear chirp 200 Hz → 3000 Hz rising through a broadband noise floor",
    left: "center",
    textStyle: { color: t.ink, fontSize: 22 },
    subtextStyle: { color: t.inkSoft, fontSize: 14 },
  },
  tooltip: {
    formatter: (params) => `${params.value[2]} dB`,
  },
  grid: { left: 100, right: 110, top: 110, bottom: 90 },
  xAxis: {
    type: "category",
    data: timeLabels,
    name: "Time (s)",
    nameLocation: "middle",
    nameGap: 45,
    nameTextStyle: { color: t.ink, fontSize: 16 },
    axisLabel: { color: t.inkSoft, fontSize: 13, interval: Math.round(numFrames / 8) },
    axisLine: { lineStyle: { color: t.inkSoft } },
    axisTick: { show: false },
    splitLine: { show: false },
  },
  yAxis: {
    type: "category",
    data: freqLabels,
    name: "Frequency (Hz)",
    nameLocation: "middle",
    nameGap: 65,
    nameTextStyle: { color: t.ink, fontSize: 16 },
    axisLabel: { color: t.inkSoft, fontSize: 13, interval: Math.round(numFreqBins / 8) },
    axisLine: { lineStyle: { color: t.inkSoft } },
    axisTick: { show: false },
    splitLine: { show: false },
  },
  visualMap: {
    min: -80,
    max: 0,
    calculable: false,
    orient: "vertical",
    itemWidth: 16,
    itemHeight: 220,
    right: 20,
    top: "middle",
    text: ["0 dB", "-80 dB"],
    textStyle: { color: t.inkSoft, fontSize: 13 },
    inRange: { color: t.seq },
  },
  series: [
    {
      type: "heatmap",
      data: heatmapData,
      itemStyle: { borderWidth: 0 },
      progressive: 4000,
    },
  ],
});
Runnable source as JSON, for any HTTP client: https://api.anyplot.ai/specs/spectrogram-basic/echarts/code. Any spec id and library id listed in llms-full.txt fit the same URL shape; every URL below is complete and callable.
{
  "spec_id": "spectrogram-basic",
  "language": "javascript",
  "library": "echarts",
  "page": "https://anyplot.ai/spectrogram-basic/javascript/echarts",
  "hub": "https://anyplot.ai/spectrogram-basic",
  "code_json": "https://api.anyplot.ai/specs/spectrogram-basic/echarts/code",
  "spec_json": "https://api.anyplot.ai/specs/spectrogram-basic",
  "render_light_png": "https://storage.googleapis.com/anyplot-images/plots/spectrogram-basic/javascript/echarts/plot-light.png",
  "render_dark_png": "https://storage.googleapis.com/anyplot-images/plots/spectrogram-basic/javascript/echarts/plot-dark.png",
  "interactive_light_html": "https://storage.googleapis.com/anyplot-images/plots/spectrogram-basic/javascript/echarts/plot-light.html",
  "interactive_dark_html": "https://storage.googleapis.com/anyplot-images/plots/spectrogram-basic/javascript/echarts/plot-dark.html",
  "quality_score": 89.0,
  "license": "MIT",
  "guide": "https://anyplot.ai/llms.txt"
}
Part of Spectrogram Time-Frequency Heatmap on anyplot.ai.