The same plot in 14 other libraries — Python: Altair, Bokeh, lets-plot, Matplotlib, Plotly, plotnine, Pygal, Seaborn; R: ggplot2; JavaScript: Chart.js, D3.js, Apache ECharts, Highcharts, MUI X Charts. Compare all 15 side by side: Spectrogram Time-Frequency Heatmap in Python, R, Julia and JavaScript.
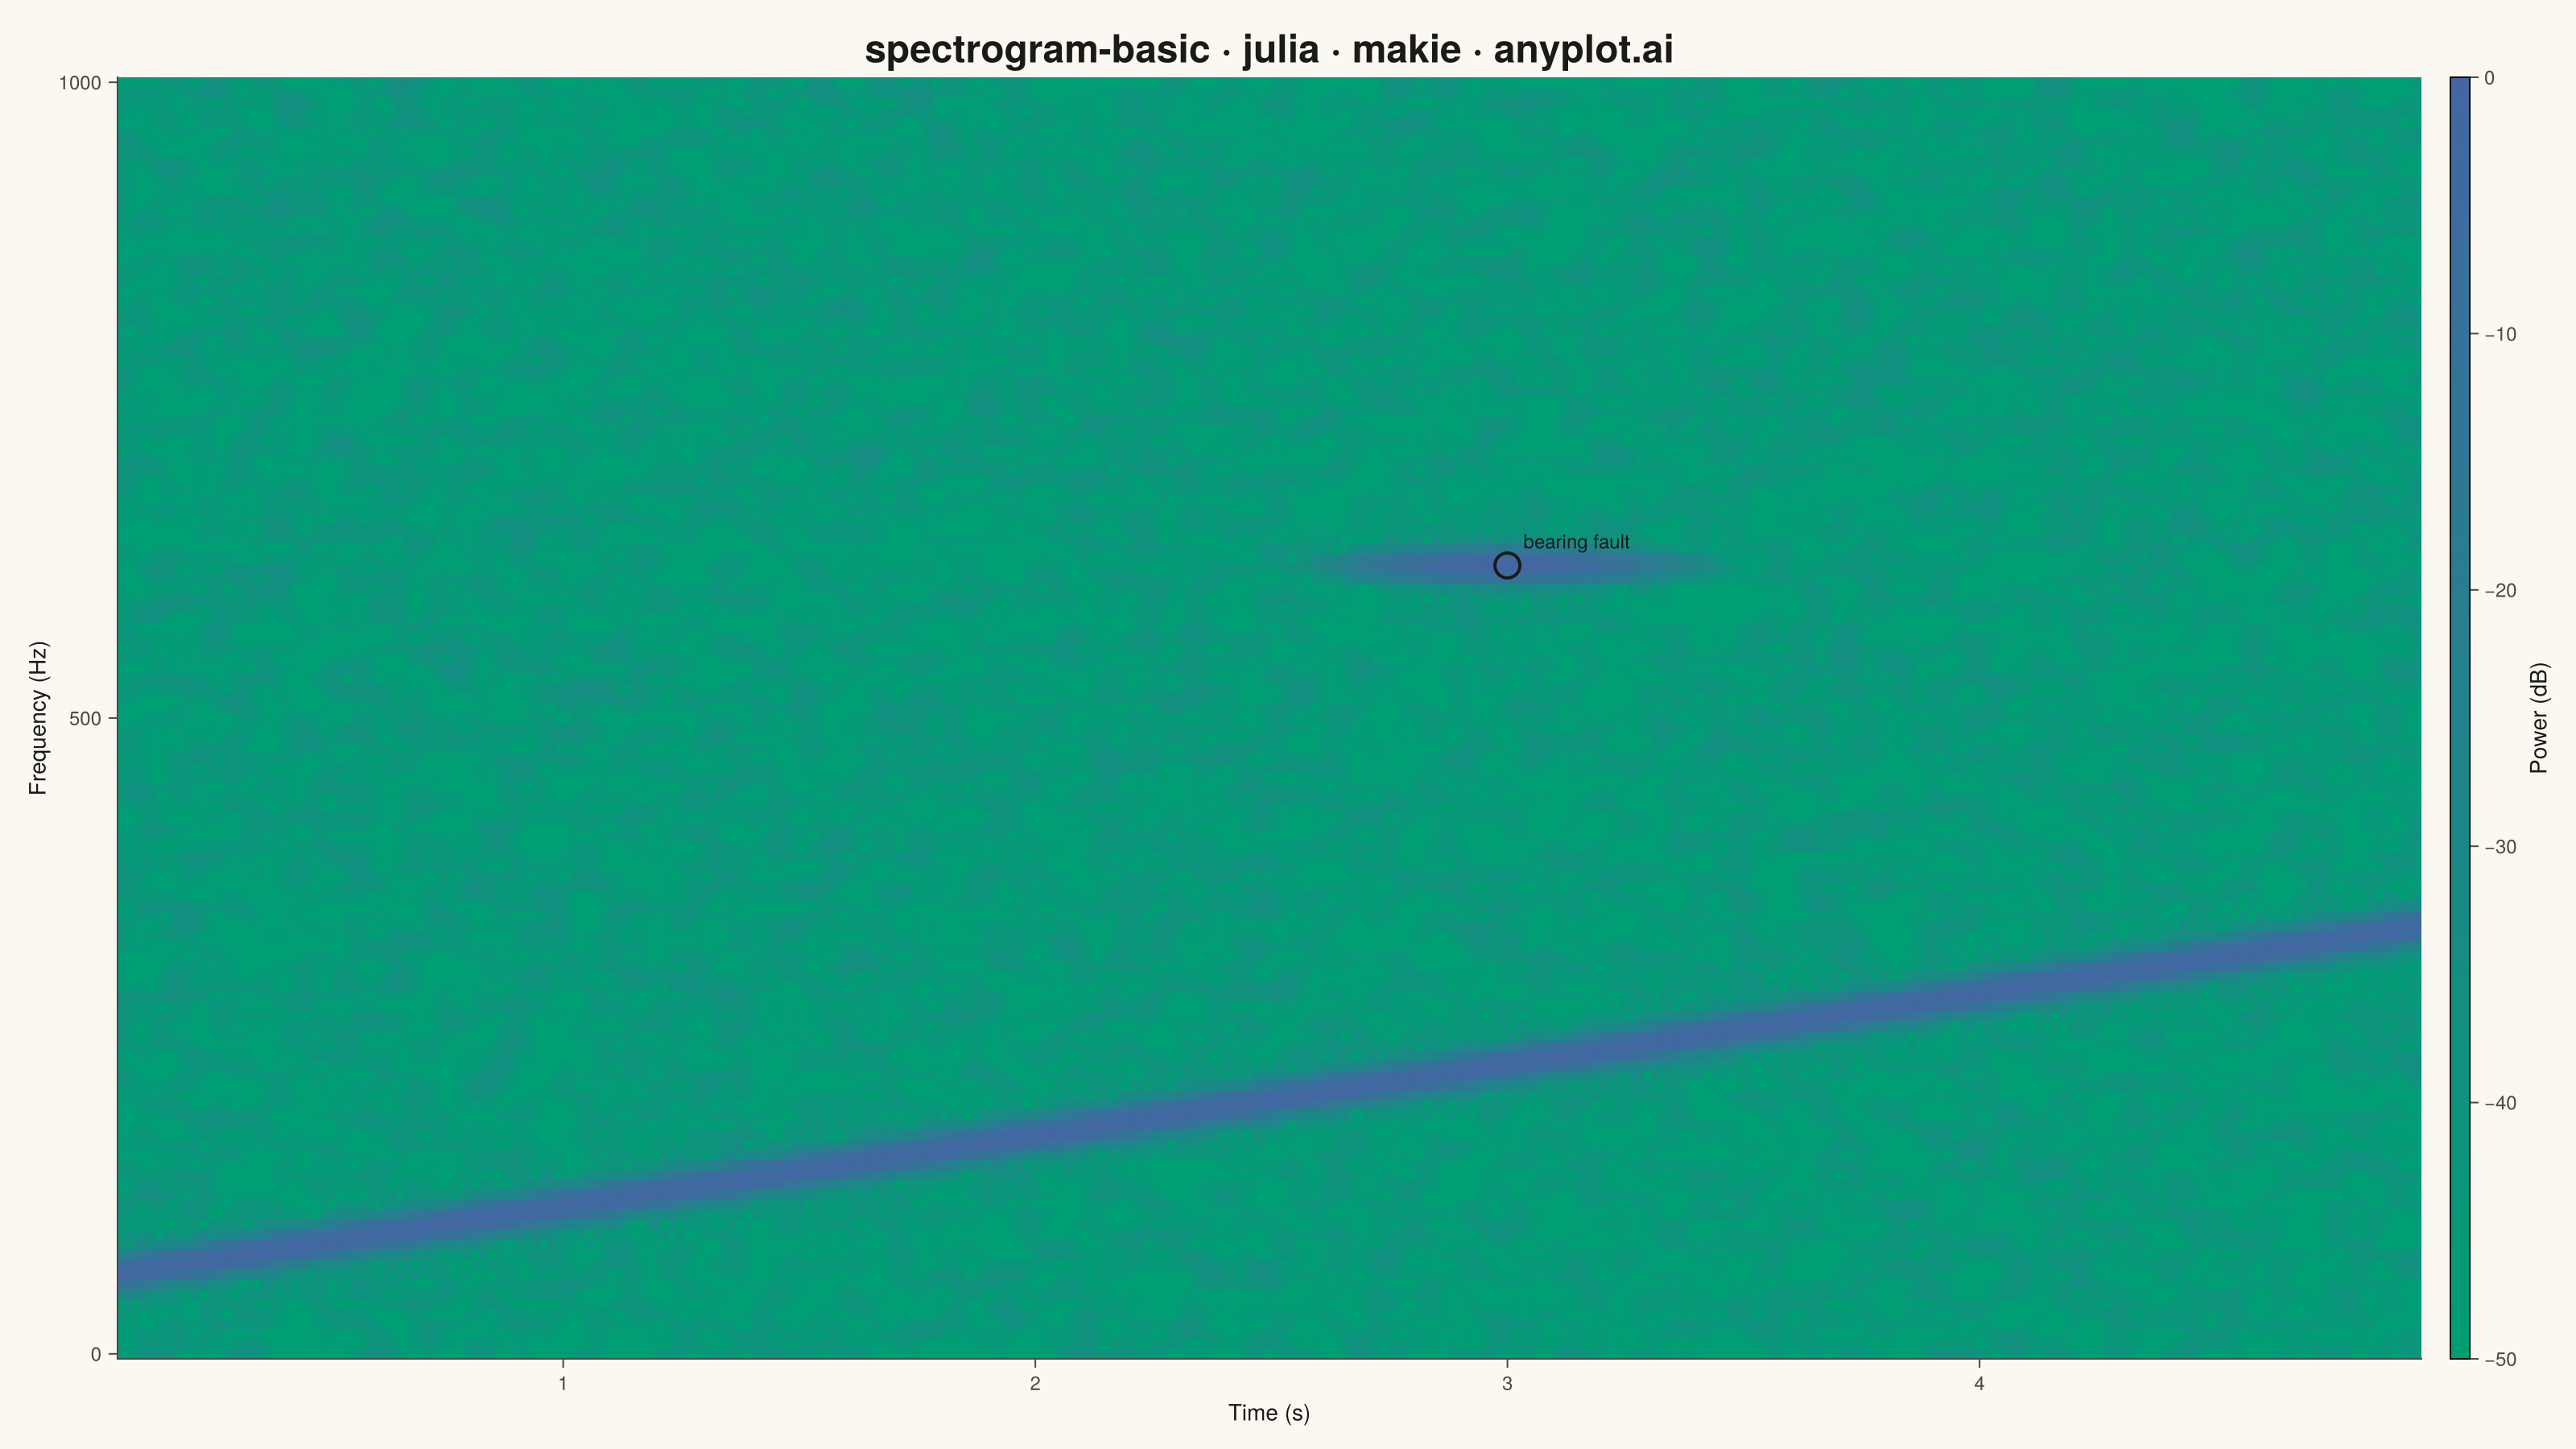
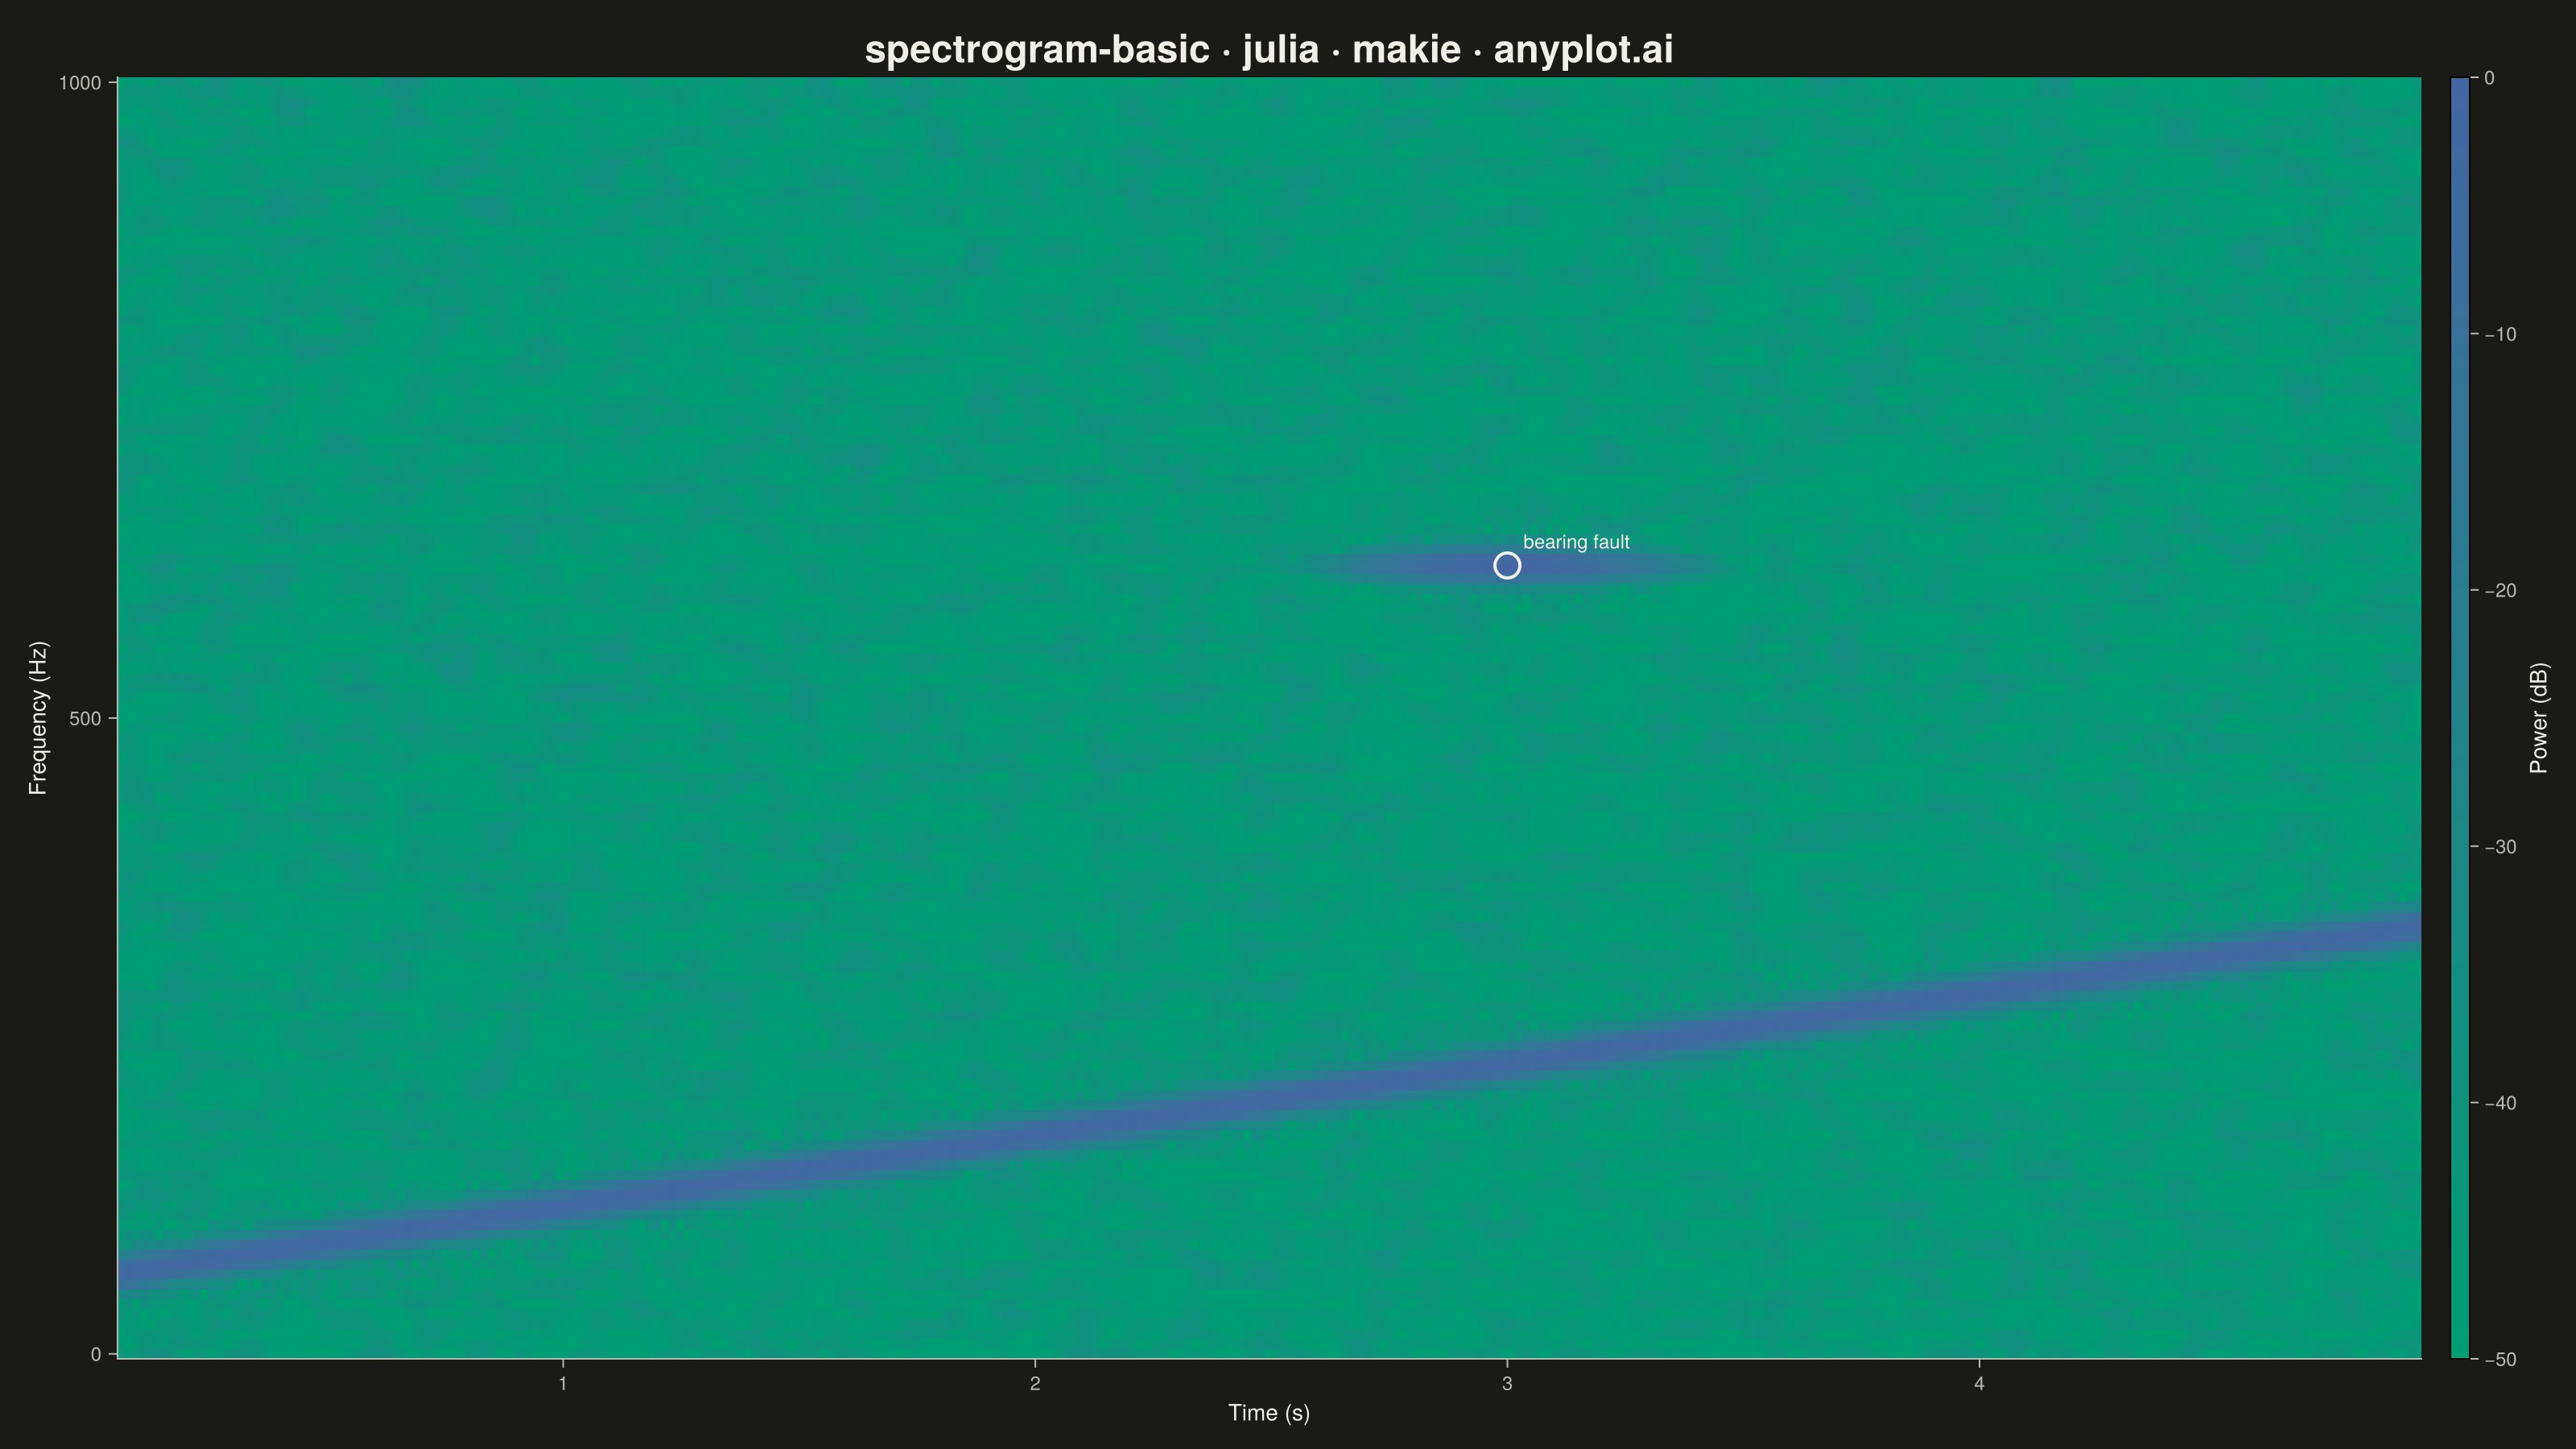
A spectrogram displaying time-frequency representation of a signal as a heatmap. It shows how the frequency content of a signal changes over time, with color intensity representing the amplitude or power at each time-frequency point. Essential for analyzing non-stationary signals where frequency characteristics vary, revealing patterns invisible in time-domain or frequency-domain views alone.
# anyplot.ai
# spectrogram-basic: Spectrogram Time-Frequency Heatmap
# Library: makie 0.21.9 | Julia 1.11.9
# Quality: 89/100 | Created: 2026-09-09

using CairoMakie
using Colors
using Random

Random.seed!(42)

# --- Theme tokens (see prompts/default-style-guide.md "Theme-adaptive Chrome")
const THEME    = get(ENV, "ANYPLOT_THEME", "light")
const PAGE_BG  = THEME == "light" ? colorant"#FAF8F1" : colorant"#1A1A17"
const INK      = THEME == "light" ? colorant"#1A1A17" : colorant"#F0EFE8"
const INK_SOFT = THEME == "light" ? colorant"#4A4A44" : colorant"#B8B7B0"

# --- Data: simulated gearbox vibration signal --------------------------------
# Shaft speeds up steadily (chirp) while a bearing fault produces a brief
# high-frequency impact burst partway through the run.
sample_rate = 2000.0
duration = 5.0
n_samples = round(Int, sample_rate * duration)
t = (0:(n_samples - 1)) ./ sample_rate

f_start, f_end = 60.0, 340.0
shaft_phase = 2π .* (f_start .* t .+ (f_end - f_start) / (2 * duration) .* t .^ 2)
shaft_vibration = sin.(shaft_phase)

fault_center = 3.0
fault_width = 0.15
fault_envelope = exp.(-((t .- fault_center) .^ 2) ./ (2 * fault_width^2))
fault_tone = fault_envelope .* sin.(2π .* 620.0 .* t)

noise = 0.05 .* randn(n_samples)
signal = shaft_vibration .+ 1.2 .* fault_tone .+ noise

# --- Short-time Fourier transform (manual DFT — no FFT package in this env) -
nfft = 256
hopsize = 32
half = nfft ÷ 2
hann_window = 0.5 .* (1 .- cos.(2π .* (0:(nfft - 1)) ./ (nfft - 1)))
n_frames = (n_samples - nfft) ÷ hopsize + 1
sample_idx = 0:(nfft - 1)

freqs = (0:half) .* (sample_rate / nfft)
times = ((0:(n_frames - 1)) .* hopsize .+ nfft / 2) ./ sample_rate
power = zeros(half + 1, n_frames)

for frame in 1:n_frames
    frame_start = (frame - 1) * hopsize + 1
    windowed = signal[frame_start:(frame_start + nfft - 1)] .* hann_window
    for k in 0:half
        angle = -2π .* k .* sample_idx ./ nfft
        re = sum(windowed .* cos.(angle))
        im = sum(windowed .* sin.(angle))
        power[k + 1, frame] = re^2 + im^2
    end
end

power_db = 10 .* log10.(power .+ 1e-12)
power_db .-= maximum(power_db)
power_db = clamp.(power_db, -50.0, 0.0)

# --- Plot ---------------------------------------------------------------
fig = Figure(
    size = (1600, 900),
    fontsize = 14,
    backgroundcolor = PAGE_BG,
)

ax = Axis(
    fig[1, 1];
    title = "spectrogram-basic · julia · makie · anyplot.ai",
    titlesize = 24,
    titlecolor = INK,
    xlabel = "Time (s)",
    ylabel = "Frequency (Hz)",
    xlabelsize = 14,
    ylabelsize = 14,
    xlabelcolor = INK,
    ylabelcolor = INK,
    xticklabelsize = 12,
    yticklabelsize = 12,
    xticklabelcolor = INK_SOFT,
    yticklabelcolor = INK_SOFT,
    xtickcolor = INK_SOFT,
    ytickcolor = INK_SOFT,
    backgroundcolor = PAGE_BG,
    topspinevisible = false,
    rightspinevisible = false,
    leftspinecolor = INK_SOFT,
    bottomspinecolor = INK_SOFT,
    xgridvisible = false,
    ygridvisible = false,
)

imprint_seq = cgrad([colorant"#009E73", colorant"#4467A3"])

hm = heatmap!(ax, times, freqs, power_db'; colormap = imprint_seq, colorrange = (-50.0, 0.0))

Colorbar(
    fig[1, 2],
    hm;
    label = "Power (dB)",
    labelcolor = INK,
    labelsize = 14,
    ticks = -50:10:0,
    ticklabelsize = 12,
    ticklabelcolor = INK_SOFT,
    tickcolor = INK_SOFT,
)

# --- Fault-burst annotation (distinctive Makie touch) ------------------------
fault_freq = 620.0
scatter!(
    ax,
    [fault_center],
    [fault_freq];
    color = :transparent,
    strokecolor = INK,
    strokewidth = 2,
    markersize = 22,
)
text!(
    ax,
    fault_center,
    fault_freq;
    text = "bearing fault",
    align = (:left, :bottom),
    offset = (10, 8),
    color = INK,
    fontsize = 12,
)

# --- Save -------------------------------------------------------------------
save("plot-$(THEME).png", fig; px_per_unit = 2)
Runnable source as JSON, for any HTTP client: https://api.anyplot.ai/specs/spectrogram-basic/makie/code. Any spec id and library id listed in llms-full.txt fit the same URL shape; every URL below is complete and callable.
{
  "spec_id": "spectrogram-basic",
  "language": "julia",
  "library": "makie",
  "page": "https://anyplot.ai/spectrogram-basic/julia/makie",
  "hub": "https://anyplot.ai/spectrogram-basic",
  "code_json": "https://api.anyplot.ai/specs/spectrogram-basic/makie/code",
  "spec_json": "https://api.anyplot.ai/specs/spectrogram-basic",
  "render_light_png": "https://storage.googleapis.com/anyplot-images/plots/spectrogram-basic/julia/makie/plot-light.png",
  "render_dark_png": "https://storage.googleapis.com/anyplot-images/plots/spectrogram-basic/julia/makie/plot-dark.png",
  "quality_score": 89.0,
  "license": "MIT",
  "guide": "https://anyplot.ai/llms.txt"
}
Part of Spectrogram Time-Frequency Heatmap on anyplot.ai.