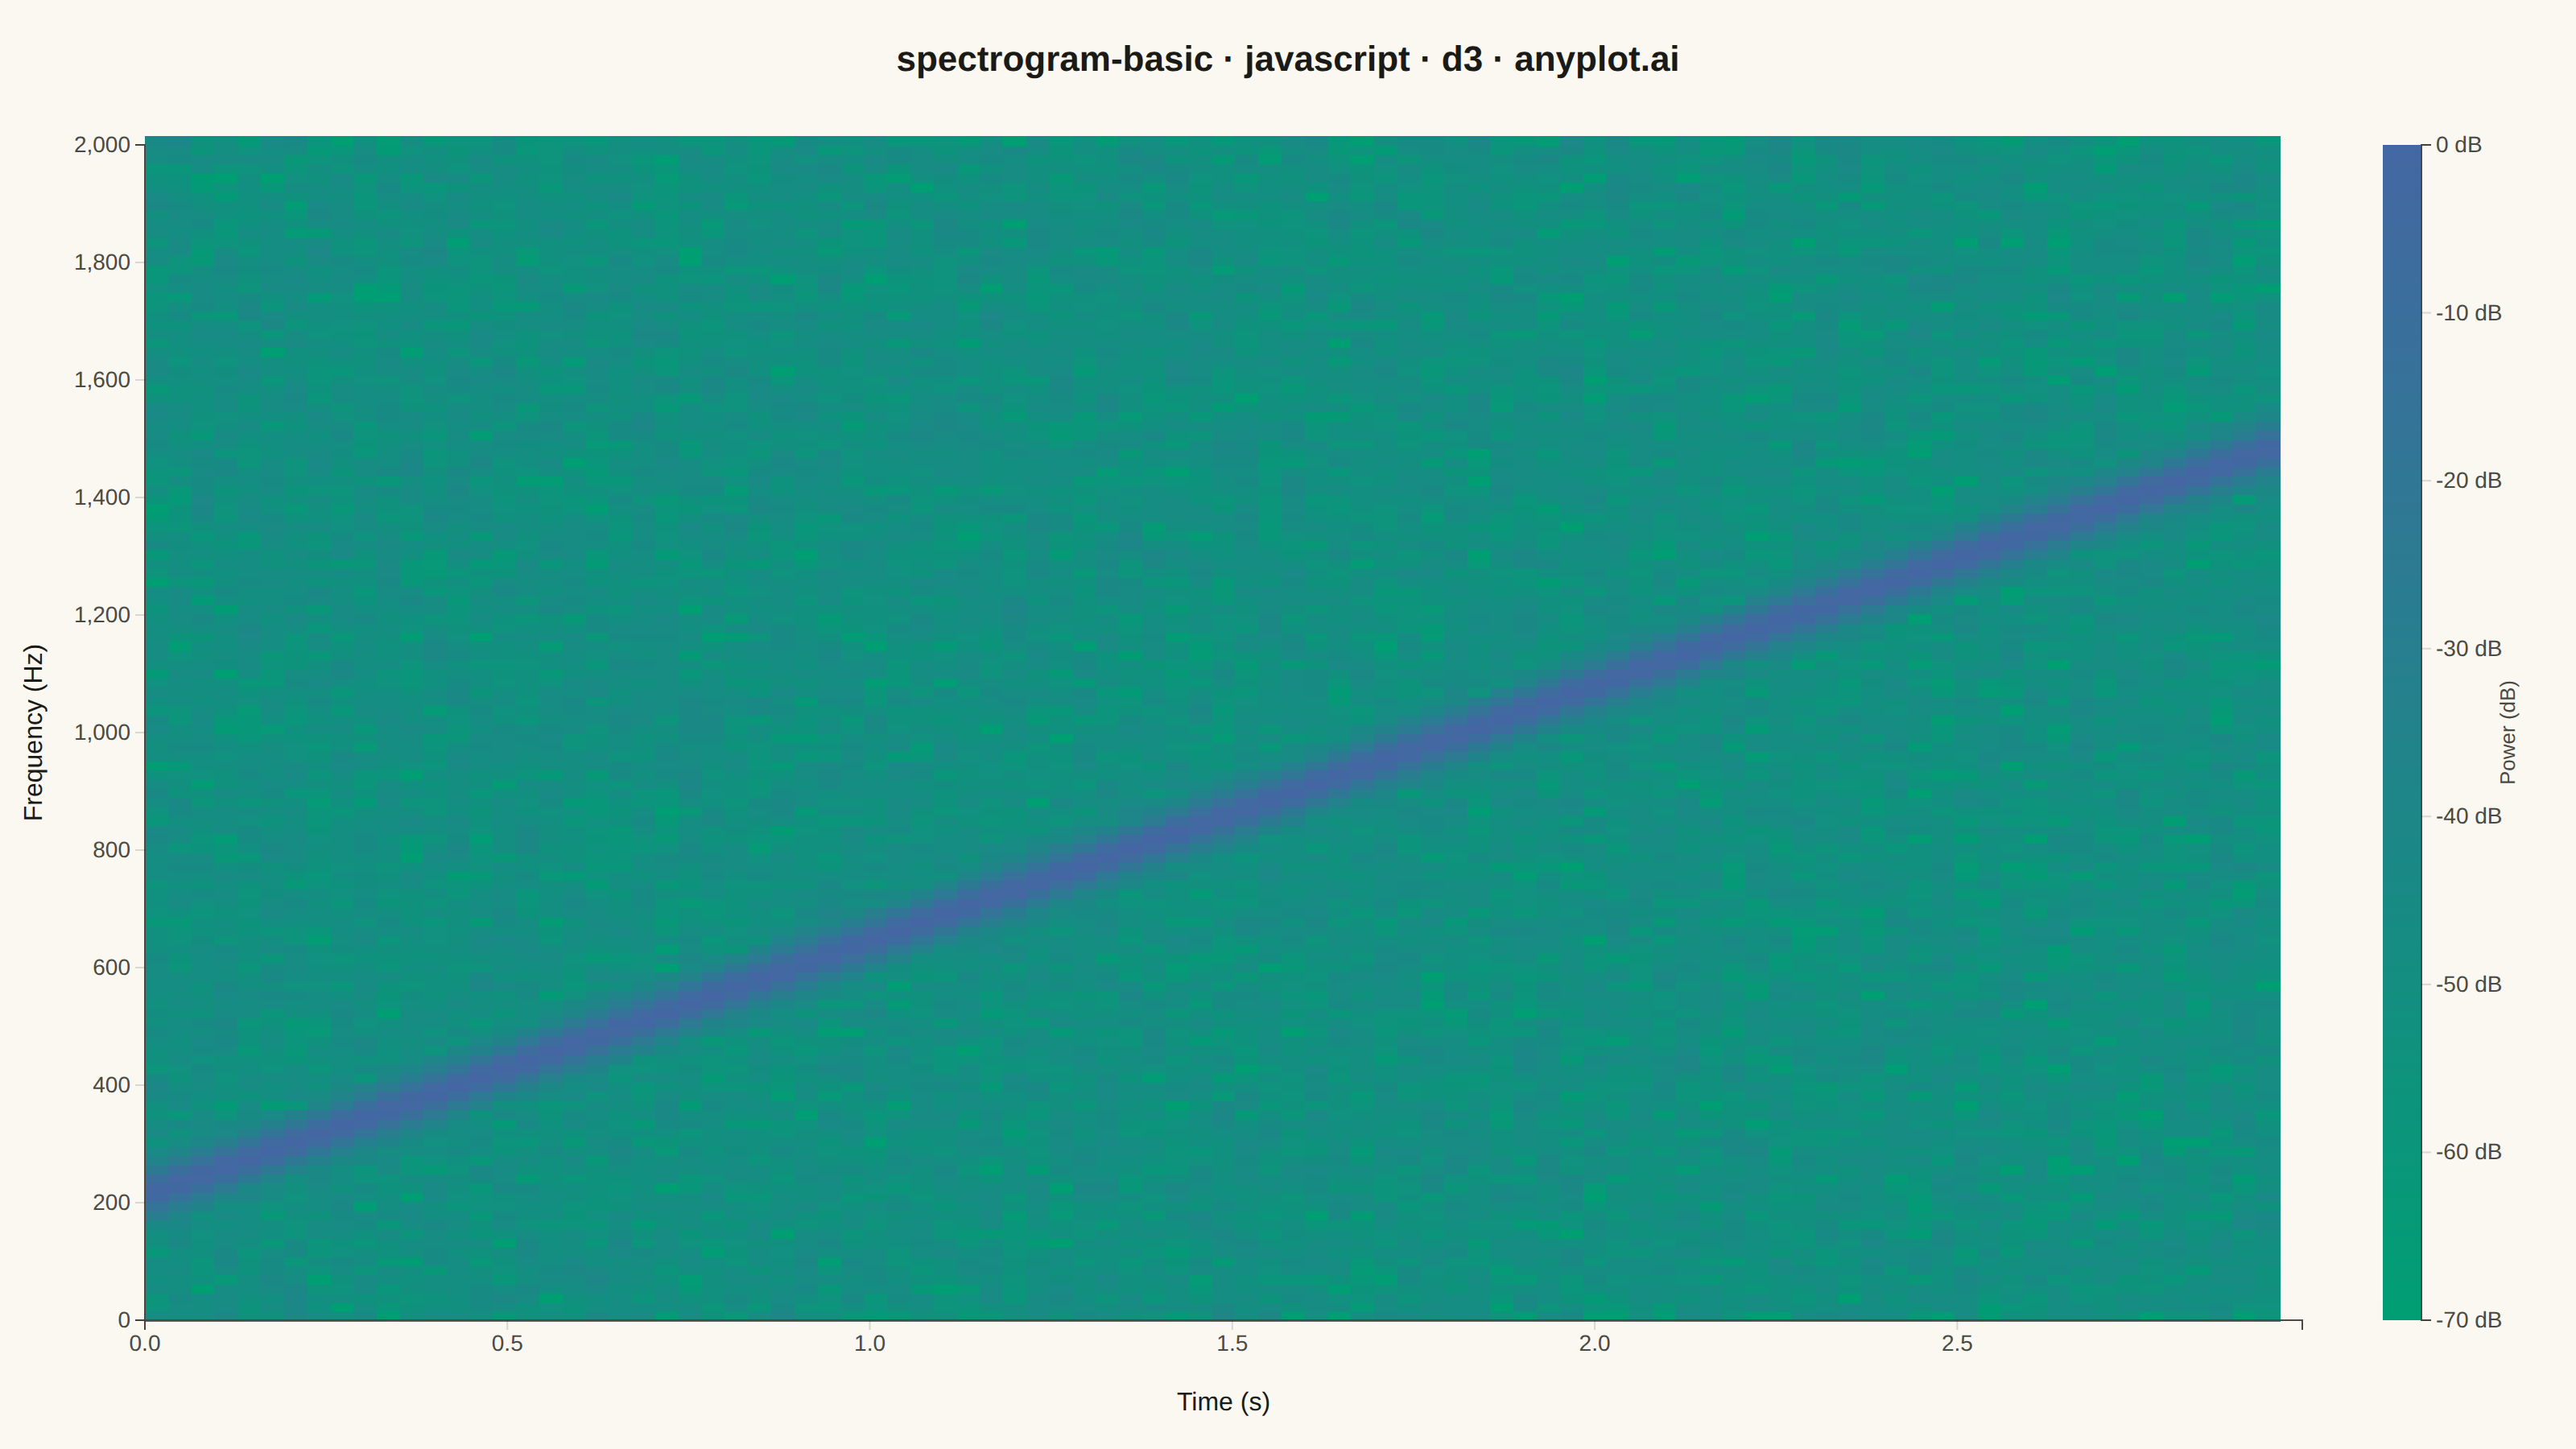
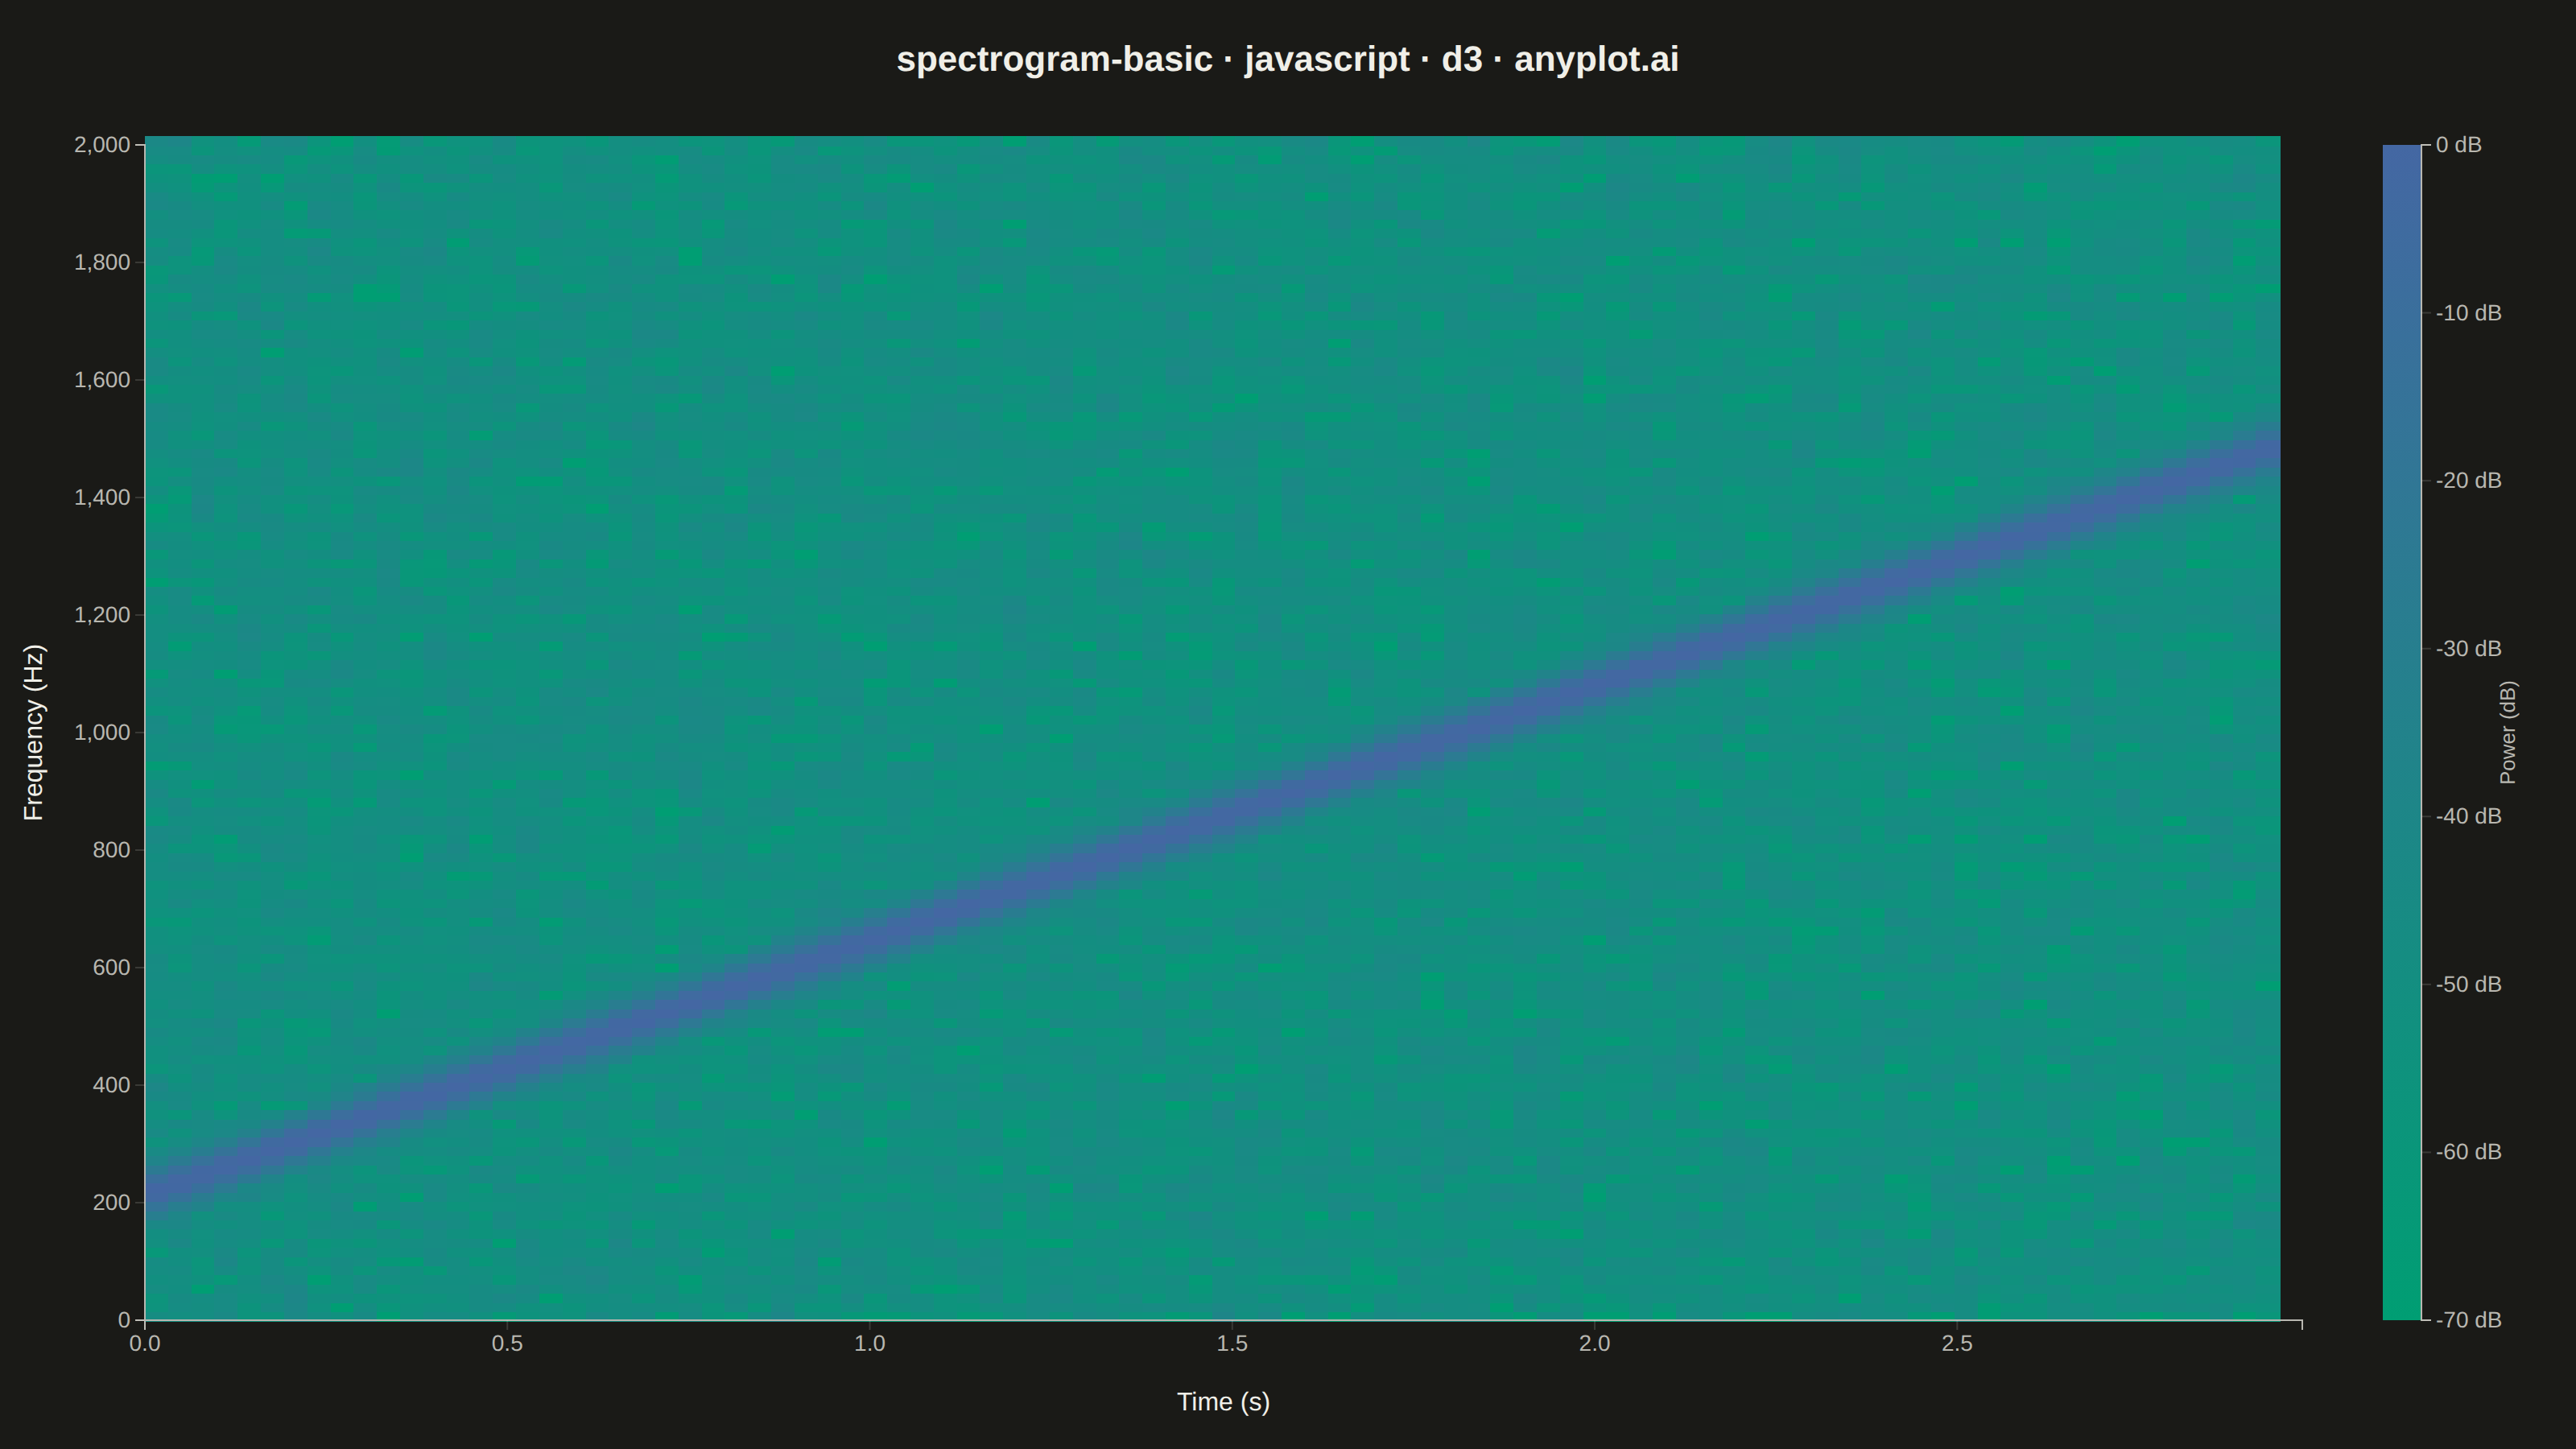
The same plot in 14 other libraries — JavaScript: Chart.js, Apache ECharts, Highcharts, MUI X Charts; Python: Altair, Bokeh, lets-plot, Matplotlib, Plotly, plotnine, Pygal, Seaborn; R: ggplot2; Julia: Makie.jl. Compare all 15 side by side: Spectrogram Time-Frequency Heatmap in Python, R, Julia and JavaScript.
A spectrogram displaying time-frequency representation of a signal as a heatmap. It shows how the frequency content of a signal changes over time, with color intensity representing the amplitude or power at each time-frequency point. Essential for analyzing non-stationary signals where frequency characteristics vary, revealing patterns invisible in time-domain or frequency-domain views alone.
// anyplot.ai
// spectrogram-basic: Spectrogram Time-Frequency Heatmap
// Library: d3 7.9.0 | JavaScript 22.23.2
// Quality: 91/100 | Created: 2026-09-09

const t = window.ANYPLOT_TOKENS;
const { width, height } = window.ANYPLOT_SIZE;

// --- Signal: linear chirp with mild deterministic noise ---------------------
const sampleRate = 4000;
const duration = 3;
const numSamples = sampleRate * duration;
const freqStart = 200;
const freqEnd = 1500;

let seed = 42;
const noise = () => {
  seed = (seed * 1103515245 + 12345) & 0x7fffffff;
  return seed / 0x7fffffff - 0.5;
};

const signal = new Float64Array(numSamples);
for (let i = 0; i < numSamples; i++) {
  const time = i / sampleRate;
  const phase = freqStart * time + ((freqEnd - freqStart) * time * time) / (2 * duration);
  signal[i] = Math.sin(2 * Math.PI * phase) + 0.08 * noise();
}

// --- STFT: Hann-windowed frames, radix-2 FFT ---------------------------------
const winSize = 256;
const hop = 128;
const numBins = winSize / 2 + 1;
const numFrames = Math.floor((numSamples - winSize) / hop) + 1;

const hann = new Float64Array(winSize);
for (let i = 0; i < winSize; i++) {
  hann[i] = 0.5 * (1 - Math.cos((2 * Math.PI * i) / (winSize - 1)));
}

const fft = (re, im) => {
  const n = re.length;
  for (let i = 1, j = 0; i < n; i++) {
    let bit = n >> 1;
    for (; j & bit; bit >>= 1) j ^= bit;
    j ^= bit;
    if (i < j) {
      [re[i], re[j]] = [re[j], re[i]];
      [im[i], im[j]] = [im[j], im[i]];
    }
  }
  for (let len = 2; len <= n; len <<= 1) {
    const ang = -(2 * Math.PI) / len;
    const wr = Math.cos(ang);
    const wi = Math.sin(ang);
    for (let i = 0; i < n; i += len) {
      let curWr = 1;
      let curWi = 0;
      for (let j = 0; j < len / 2; j++) {
        const ur = re[i + j];
        const ui = im[i + j];
        const vr = re[i + j + len / 2] * curWr - im[i + j + len / 2] * curWi;
        const vi = re[i + j + len / 2] * curWi + im[i + j + len / 2] * curWr;
        re[i + j] = ur + vr;
        im[i + j] = ui + vi;
        re[i + j + len / 2] = ur - vr;
        im[i + j + len / 2] = ui - vi;
        const nextWr = curWr * wr - curWi * wi;
        const nextWi = curWr * wi + curWi * wr;
        curWr = nextWr;
        curWi = nextWi;
      }
    }
  }
};

const magnitudeDb = [];
let maxDb = -Infinity;
for (let f = 0; f < numFrames; f++) {
  const start = f * hop;
  const re = new Float64Array(winSize);
  const im = new Float64Array(winSize);
  for (let i = 0; i < winSize; i++) re[i] = signal[start + i] * hann[i];
  fft(re, im);
  const frameDb = new Float64Array(numBins);
  for (let k = 0; k < numBins; k++) {
    const magnitude = Math.hypot(re[k], im[k]) / winSize;
    const db = 20 * Math.log10(magnitude + 1e-9);
    frameDb[k] = db;
    if (db > maxDb) maxDb = db;
  }
  magnitudeDb.push(frameDb);
}

const dbFloor = -70;
const cells = [];
for (let f = 0; f < numFrames; f++) {
  for (let k = 0; k < numBins; k++) {
    cells.push({ frame: f, bin: k, db: Math.max(dbFloor, magnitudeDb[f][k] - maxDb) });
  }
}

// --- Layout -------------------------------------------------------------------
const margin = { top: 90, right: 170, bottom: 80, left: 90 };
const iw = width - margin.left - margin.right;
const ih = height - margin.top - margin.bottom;

const dt = hop / sampleRate;
const df = sampleRate / winSize;
const totalTime = (numFrames - 1) * dt + winSize / sampleRate;
const nyquist = sampleRate / 2;

const xScale = d3.scaleLinear().domain([0, totalTime]).range([0, iw]);
const yScale = d3.scaleLinear().domain([0, nyquist]).range([ih, 0]);
const cellWidth = xScale(dt) - xScale(0);
const cellHeight = yScale(0) - yScale(df);

const color = d3.scaleSequential(d3.interpolateRgbBasis(t.seq)).domain([dbFloor, 0]);

// --- SVG mount ------------------------------------------------------------
const svg = d3.select("#container").append("svg").attr("width", width).attr("height", height);
const g = svg.append("g").attr("transform", `translate(${margin.left},${margin.top})`);

// --- Heatmap cells ----------------------------------------------------------
// A small sub-pixel overlap (plus crispEdges) avoids the anti-aliasing seam
// that otherwise appears as hairlines between adjacent rects.
const heatmap = g.append("g").attr("shape-rendering", "crispEdges");
heatmap
  .selectAll("rect")
  .data(cells)
  .join("rect")
  .attr("x", (d) => xScale(d.frame * dt))
  .attr("y", (d) => yScale((d.bin + 1) * df))
  .attr("width", cellWidth + 0.75)
  .attr("height", cellHeight + 0.75)
  .attr("fill", (d) => color(d.db));

// --- Axes ---------------------------------------------------------------------
const xAxis = g.append("g").attr("transform", `translate(0,${ih})`).call(d3.axisBottom(xScale).ticks(8));
const yAxis = g.append("g").call(d3.axisLeft(yScale).ticks(8));
for (const axisGroup of [xAxis, yAxis]) {
  axisGroup.selectAll("text").attr("fill", t.inkSoft).style("font-size", "14px");
  axisGroup.selectAll("line").attr("stroke", t.grid);
  axisGroup.select(".domain").attr("stroke", t.inkSoft);
}

g.append("text")
  .attr("x", iw / 2)
  .attr("y", ih + 56)
  .attr("text-anchor", "middle")
  .attr("fill", t.ink)
  .style("font-size", "16px")
  .text("Time (s)");

g.append("text")
  .attr("transform", `translate(${-64}, ${ih / 2}) rotate(-90)`)
  .attr("text-anchor", "middle")
  .attr("fill", t.ink)
  .style("font-size", "16px")
  .text("Frequency (Hz)");

// --- Colorbar (power, dB relative to peak) -----------------------------------
const barWidth = 24;
const barX = iw + 50;
const defs = svg.append("defs");
const gradient = defs
  .append("linearGradient")
  .attr("id", "spectrogram-db-gradient")
  .attr("x1", "0").attr("y1", "1").attr("x2", "0").attr("y2", "0");
gradient.append("stop").attr("offset", "0%").attr("stop-color", t.seq[0]);
gradient.append("stop").attr("offset", "100%").attr("stop-color", t.seq[1]);

const bar = g.append("g").attr("transform", `translate(${barX},0)`);
bar
  .append("rect")
  .attr("width", barWidth)
  .attr("height", ih)
  .attr("fill", "url(#spectrogram-db-gradient)");

const barScale = d3.scaleLinear().domain([dbFloor, 0]).range([ih, 0]);
const barAxis = bar
  .append("g")
  .attr("transform", `translate(${barWidth},0)`)
  .call(d3.axisRight(barScale).ticks(5).tickFormat((d) => `${d} dB`));
barAxis.selectAll("text").attr("fill", t.inkSoft).style("font-size", "14px");
barAxis.selectAll("line").attr("stroke", t.grid);
barAxis.select(".domain").attr("stroke", t.inkSoft);

bar
  .append("text")
  .attr("transform", `translate(${barWidth + 58}, ${ih / 2}) rotate(-90)`)
  .attr("text-anchor", "middle")
  .attr("fill", t.inkSoft)
  .style("font-size", "13px")
  .text("Power (dB)");

// --- Title --------------------------------------------------------------------
svg
  .append("text")
  .attr("x", width / 2)
  .attr("y", 44)
  .attr("text-anchor", "middle")
  .attr("fill", t.ink)
  .style("font-size", "22px")
  .style("font-weight", "600")
  .text("spectrogram-basic · javascript · d3 · anyplot.ai");
Runnable source as JSON, for any HTTP client: https://api.anyplot.ai/specs/spectrogram-basic/d3/code. Any spec id and library id listed in llms-full.txt fit the same URL shape; every URL below is complete and callable.
{
  "spec_id": "spectrogram-basic",
  "language": "javascript",
  "library": "d3",
  "page": "https://anyplot.ai/spectrogram-basic/javascript/d3",
  "hub": "https://anyplot.ai/spectrogram-basic",
  "code_json": "https://api.anyplot.ai/specs/spectrogram-basic/d3/code",
  "spec_json": "https://api.anyplot.ai/specs/spectrogram-basic",
  "render_light_png": "https://storage.googleapis.com/anyplot-images/plots/spectrogram-basic/javascript/d3/plot-light.png",
  "render_dark_png": "https://storage.googleapis.com/anyplot-images/plots/spectrogram-basic/javascript/d3/plot-dark.png",
  "interactive_light_html": "https://storage.googleapis.com/anyplot-images/plots/spectrogram-basic/javascript/d3/plot-light.html",
  "interactive_dark_html": "https://storage.googleapis.com/anyplot-images/plots/spectrogram-basic/javascript/d3/plot-dark.html",
  "quality_score": 91.0,
  "license": "MIT",
  "guide": "https://anyplot.ai/llms.txt"
}
Part of Spectrogram Time-Frequency Heatmap on anyplot.ai.