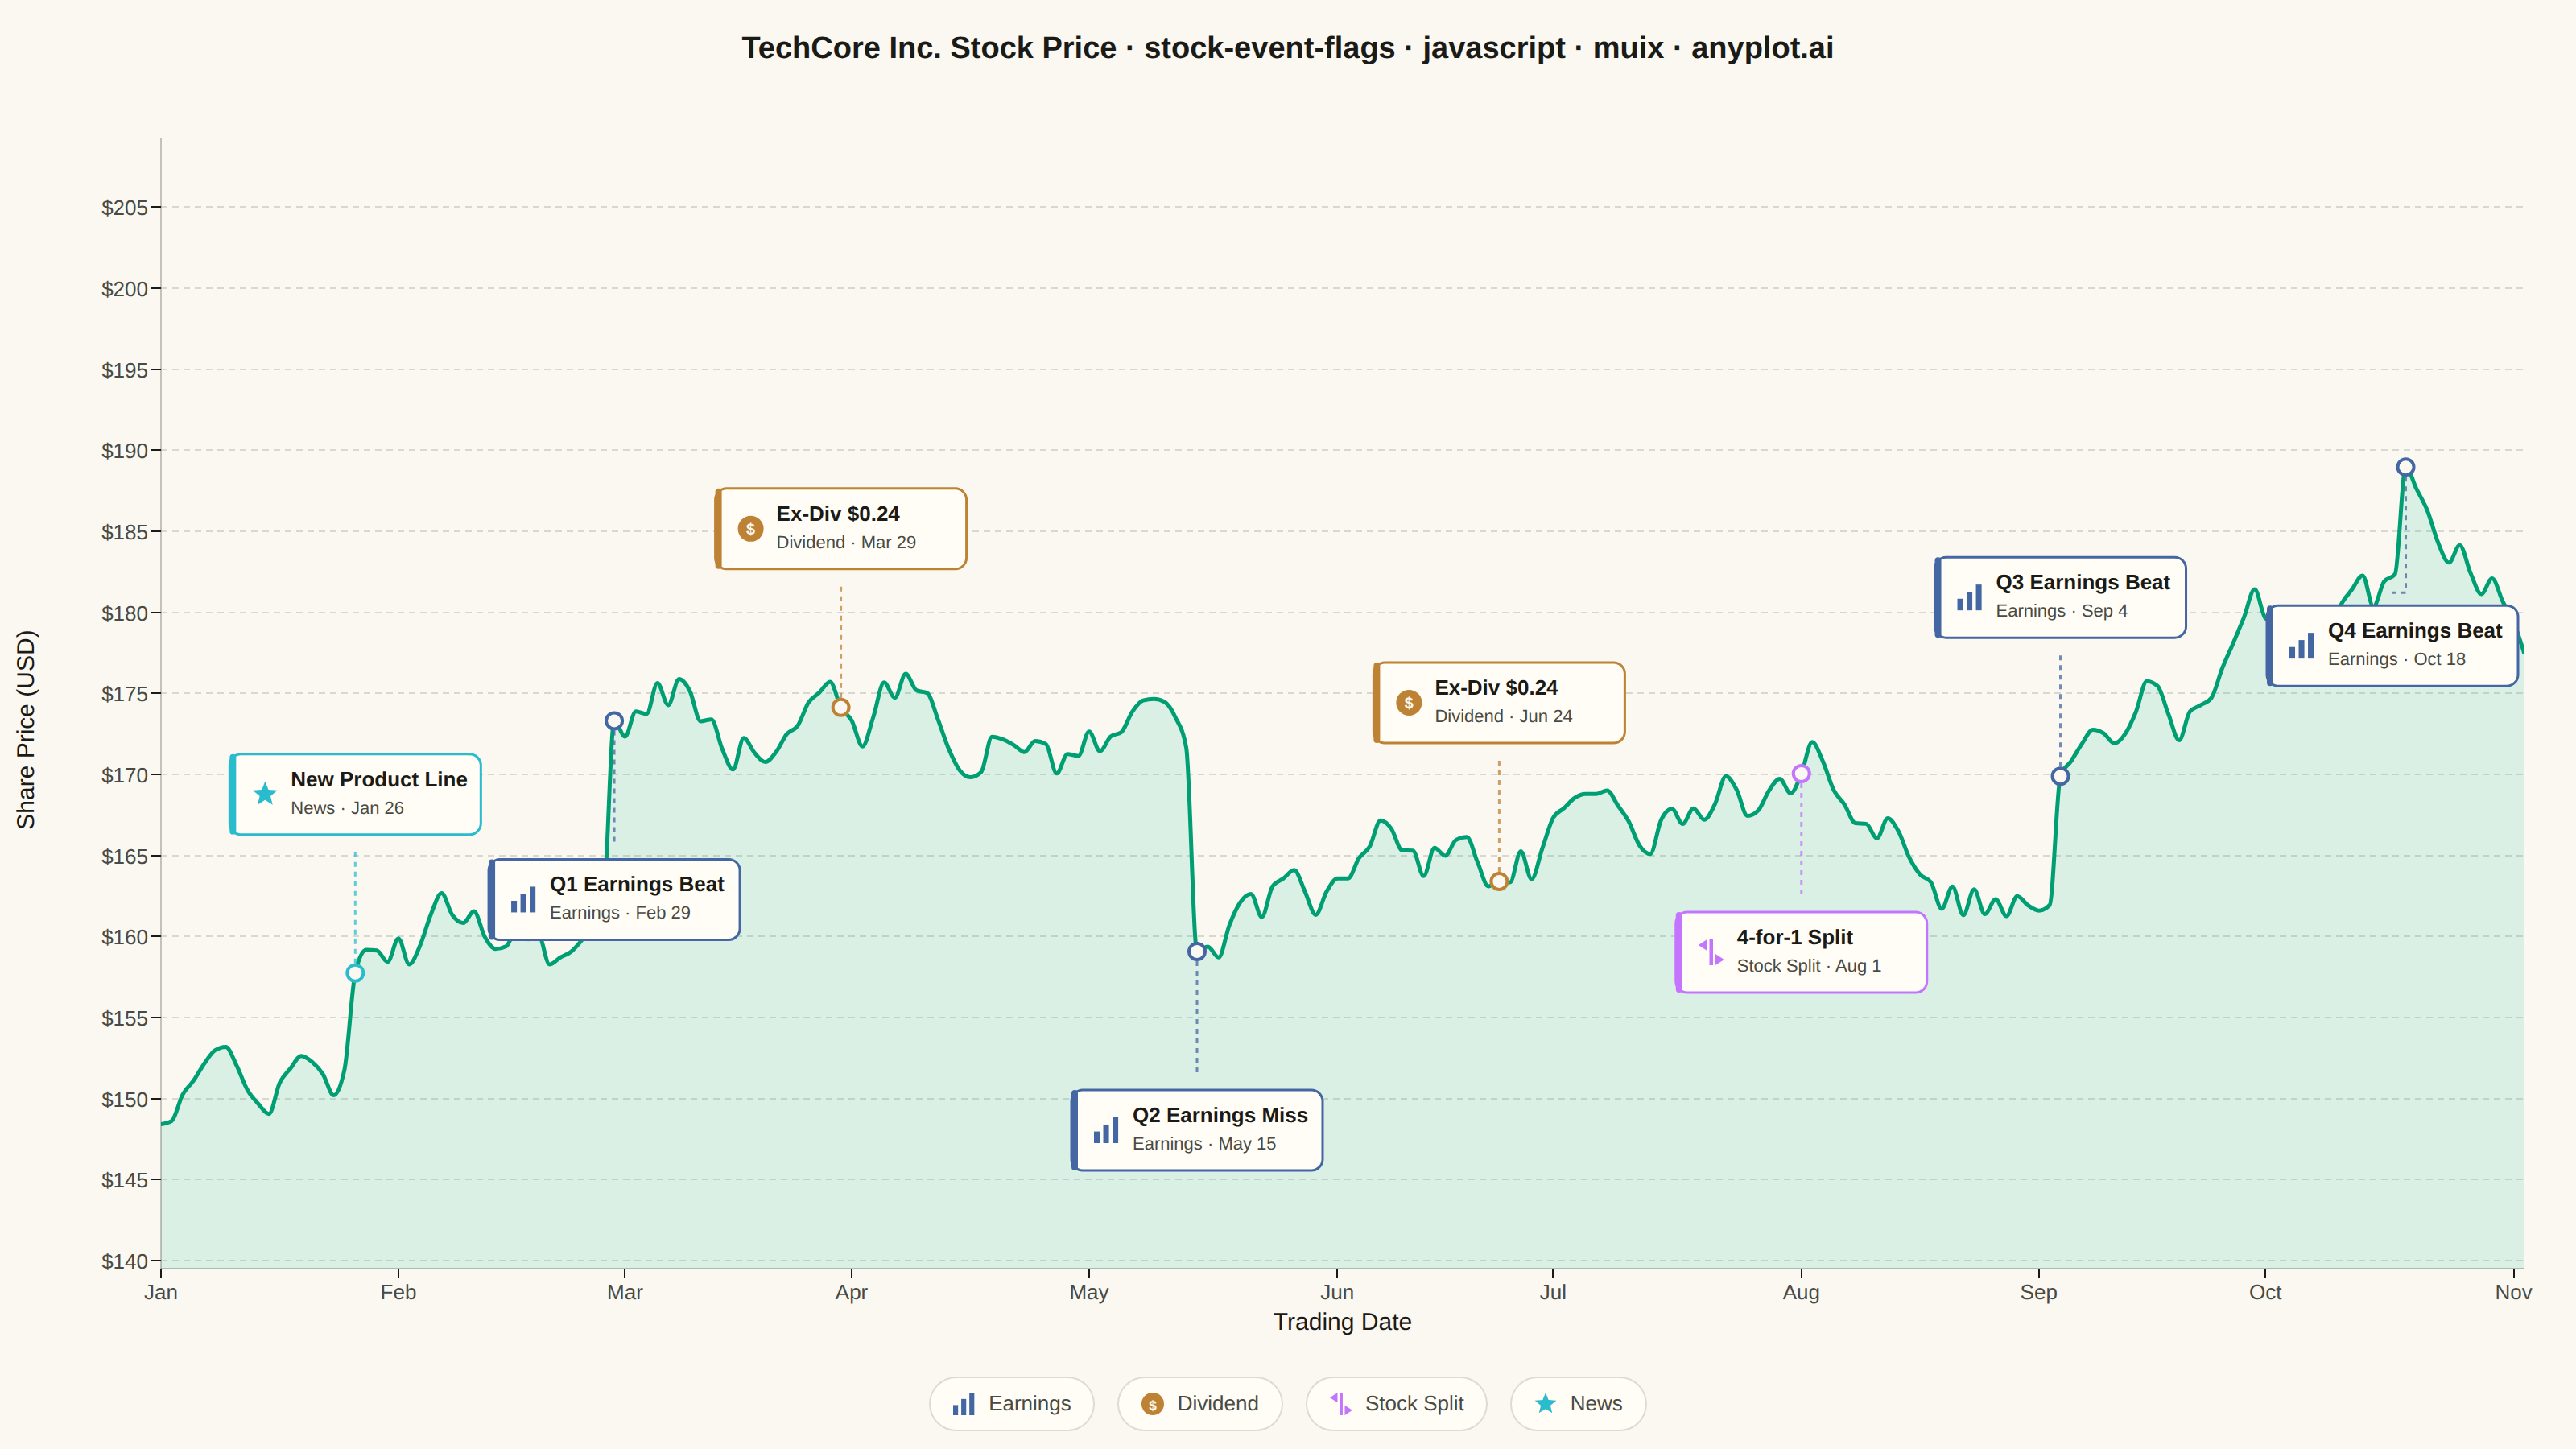
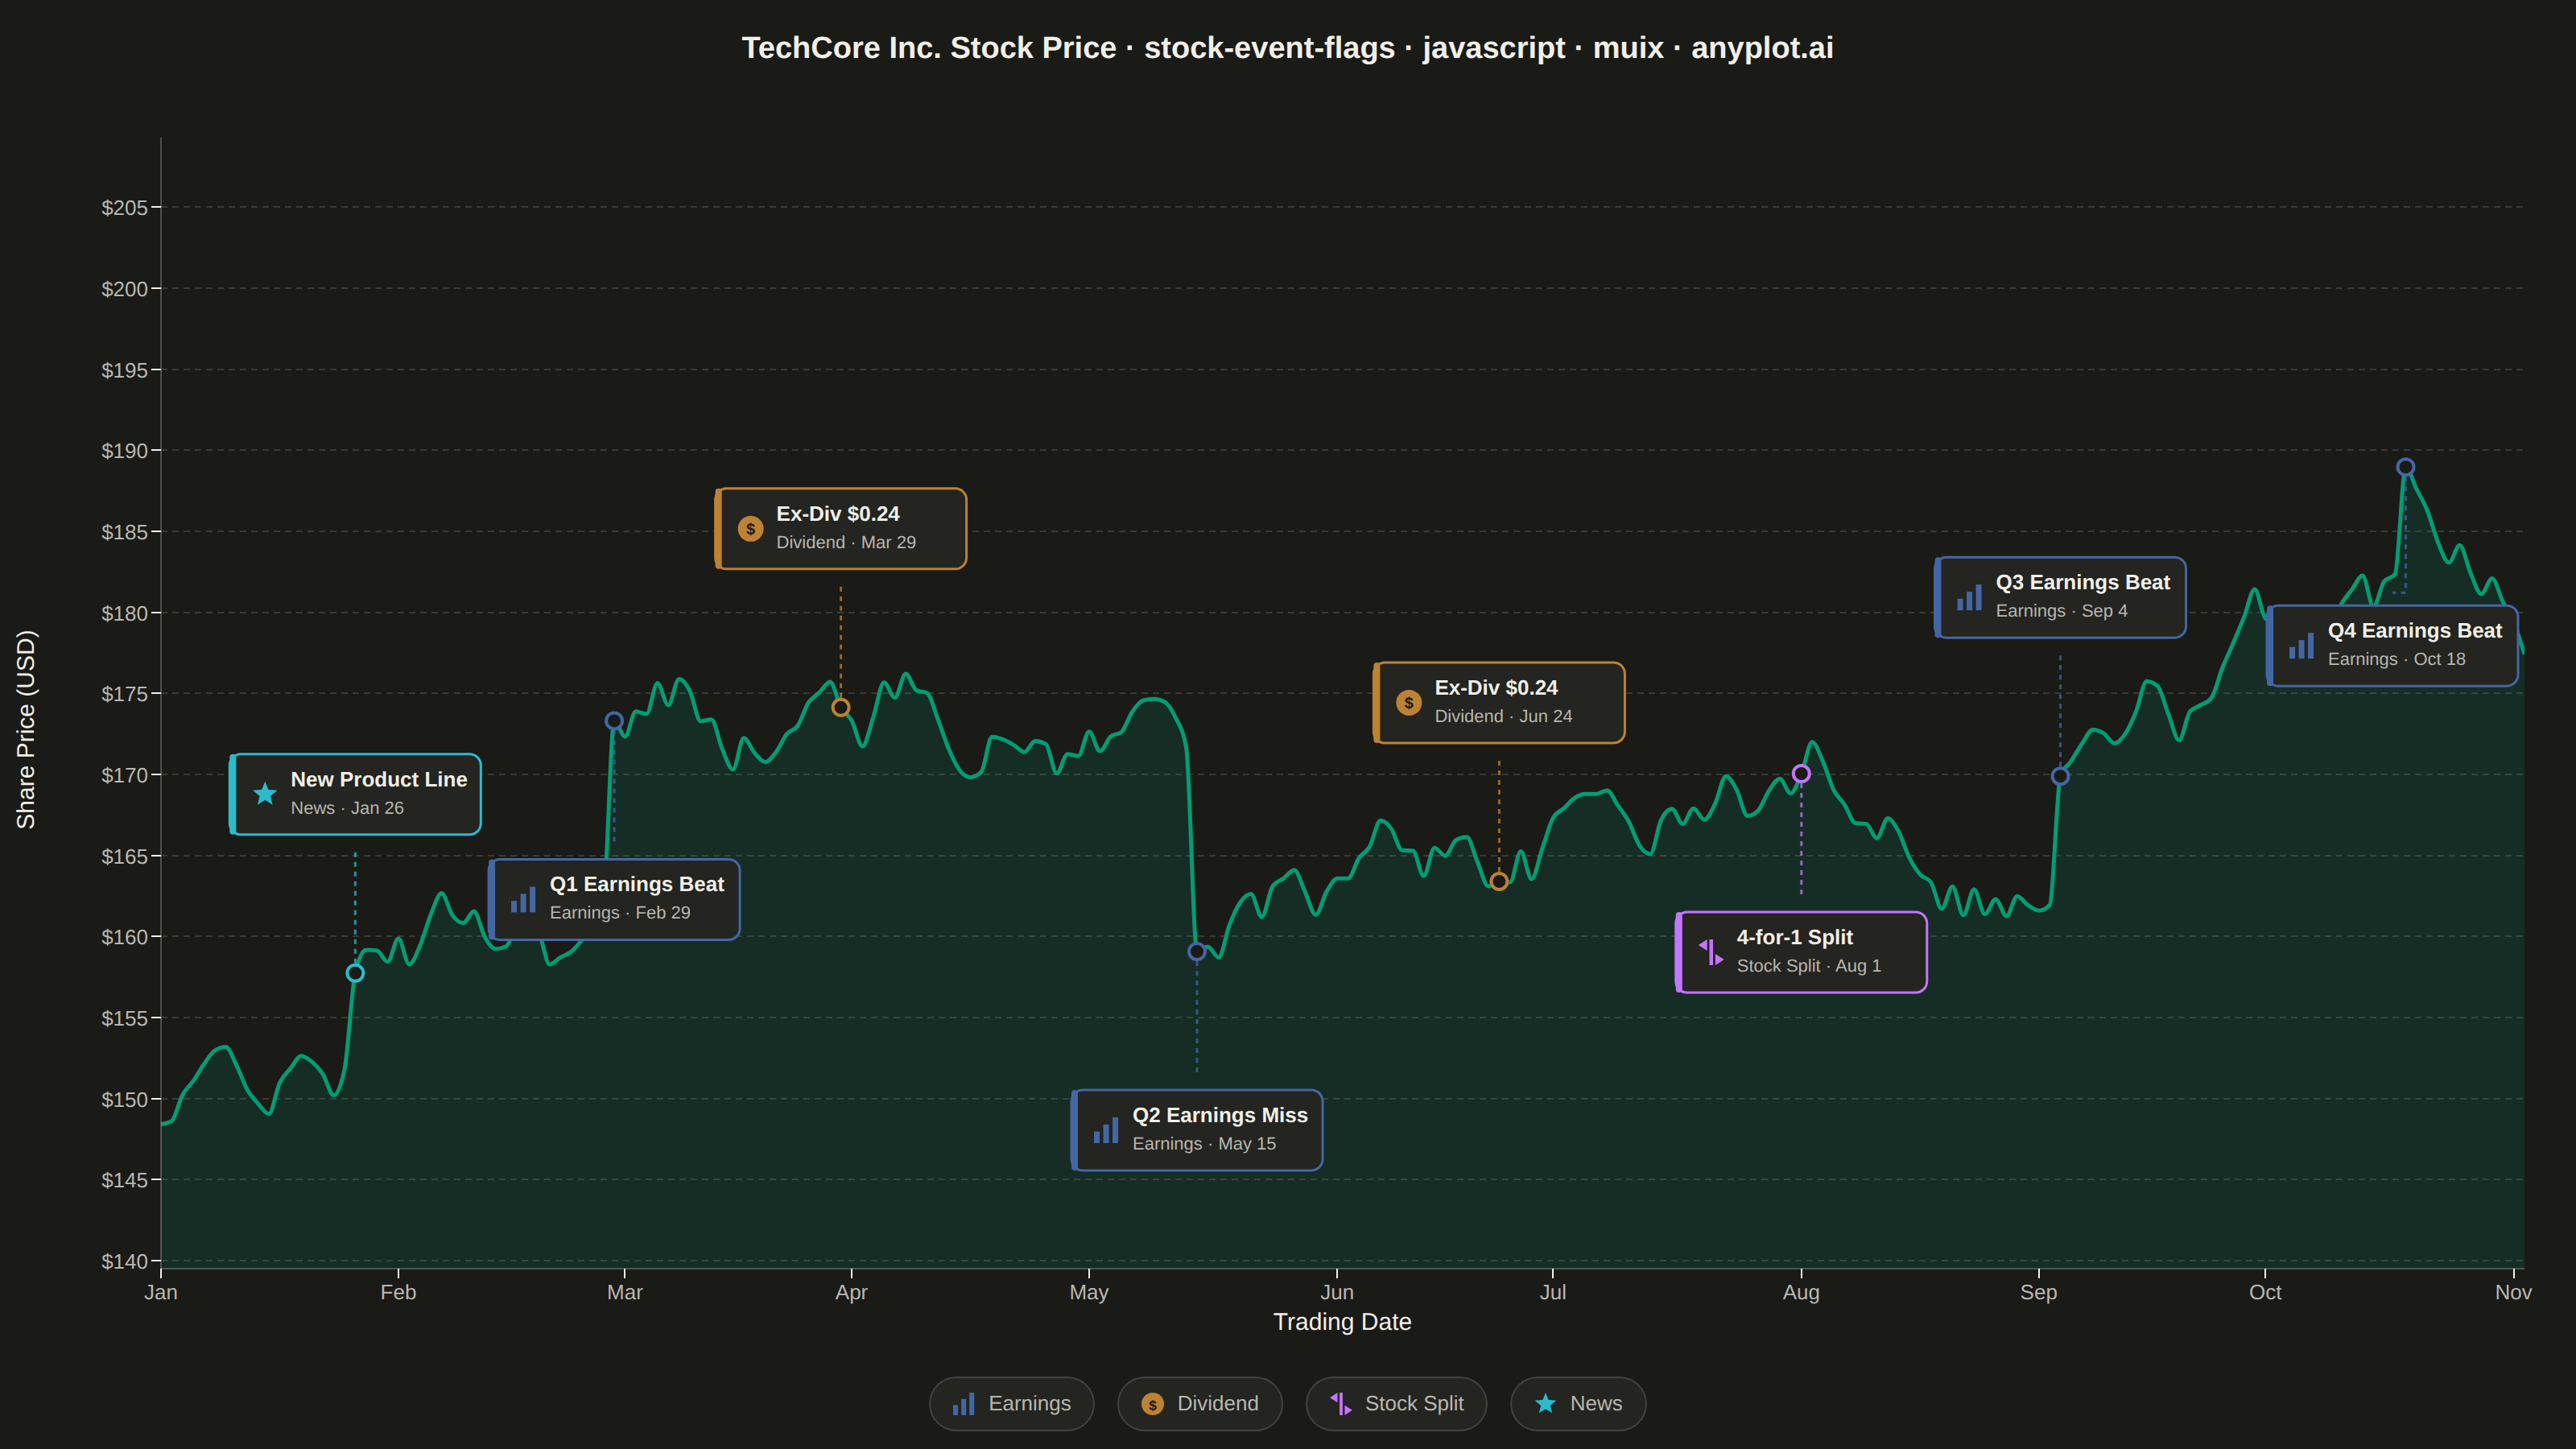
A stock price chart with flag-style markers annotating significant events such as earnings releases, dividends, stock splits, or news events. Unlike simple line annotations, flags are positioned above or below the price data with connector lines and styled icons that distinguish event types. This visualization is standard in financial trading platforms, enabling investors to correlate price movements with corporate actions and market events at a glance.
Preview render from the MUI X Charts implementation.