The same plot in 14 other libraries — Python: Altair, Bokeh, lets-plot, Matplotlib, Plotly, plotnine, Pygal, Seaborn; R: ggplot2; JavaScript: Chart.js, D3.js, Apache ECharts, Highcharts, MUI X Charts. Compare all 15 side by side: Stock Chart with Event Flags in Python, R, Julia and JavaScript.
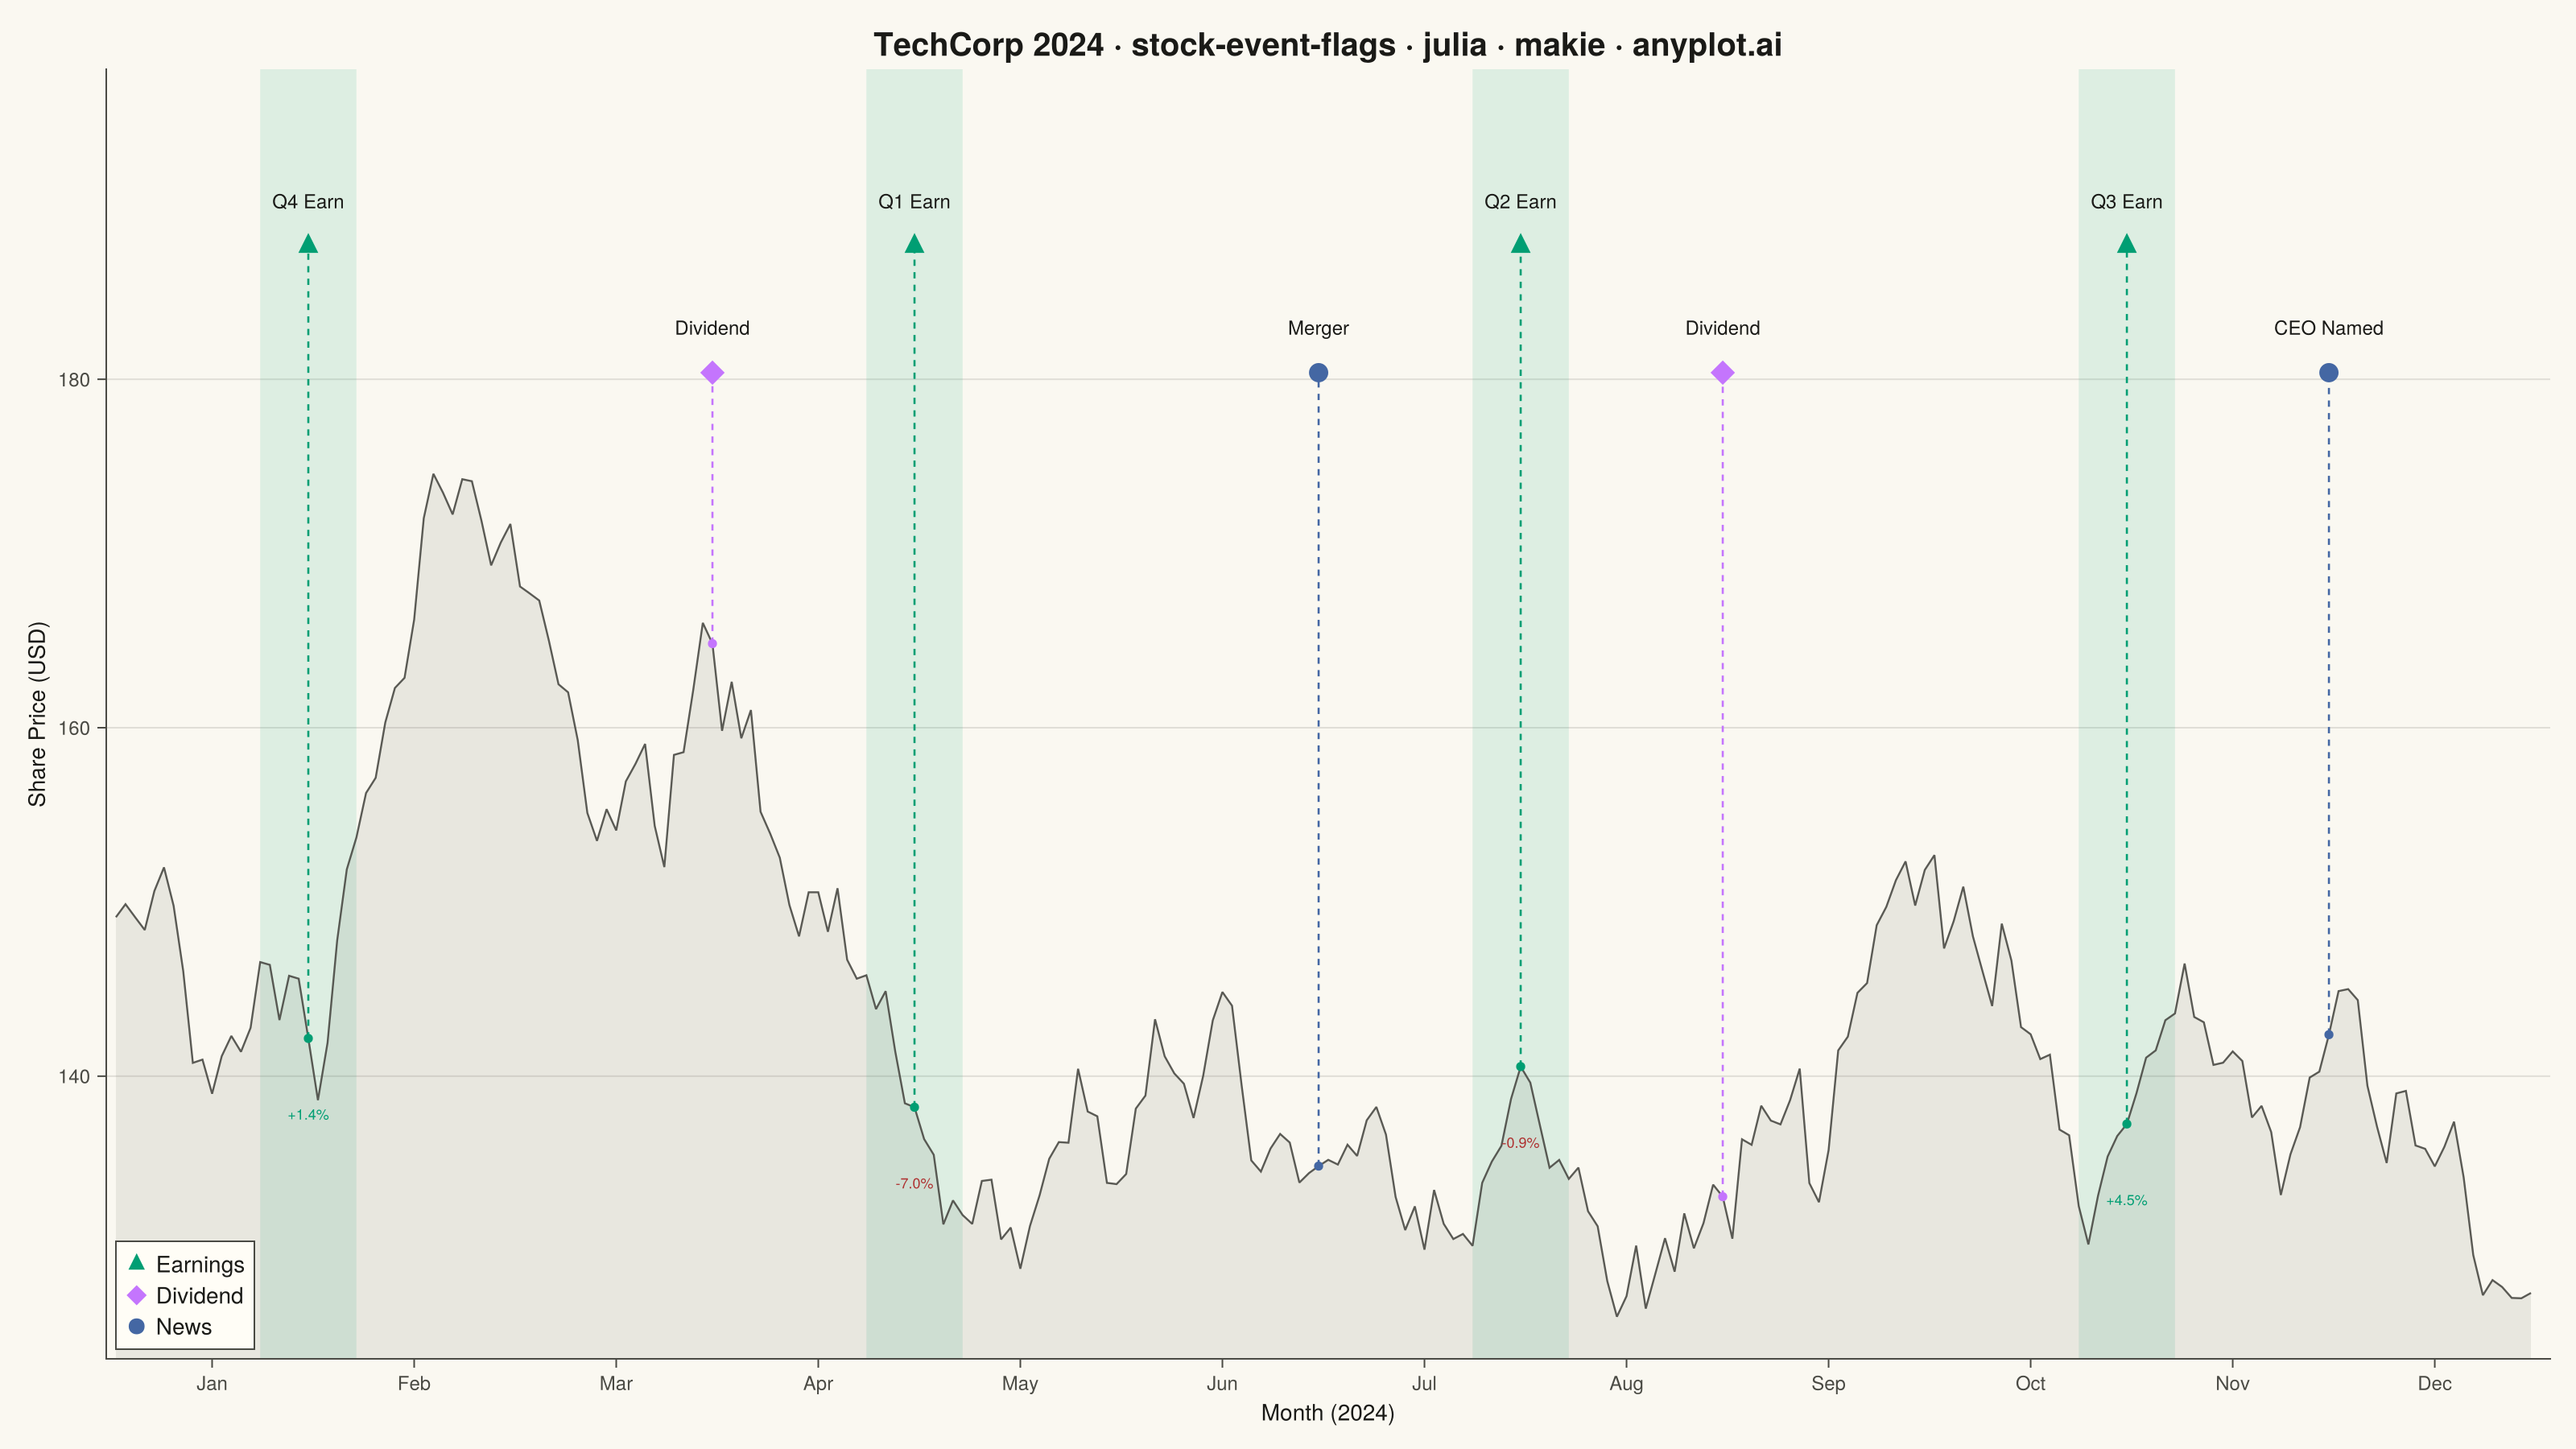
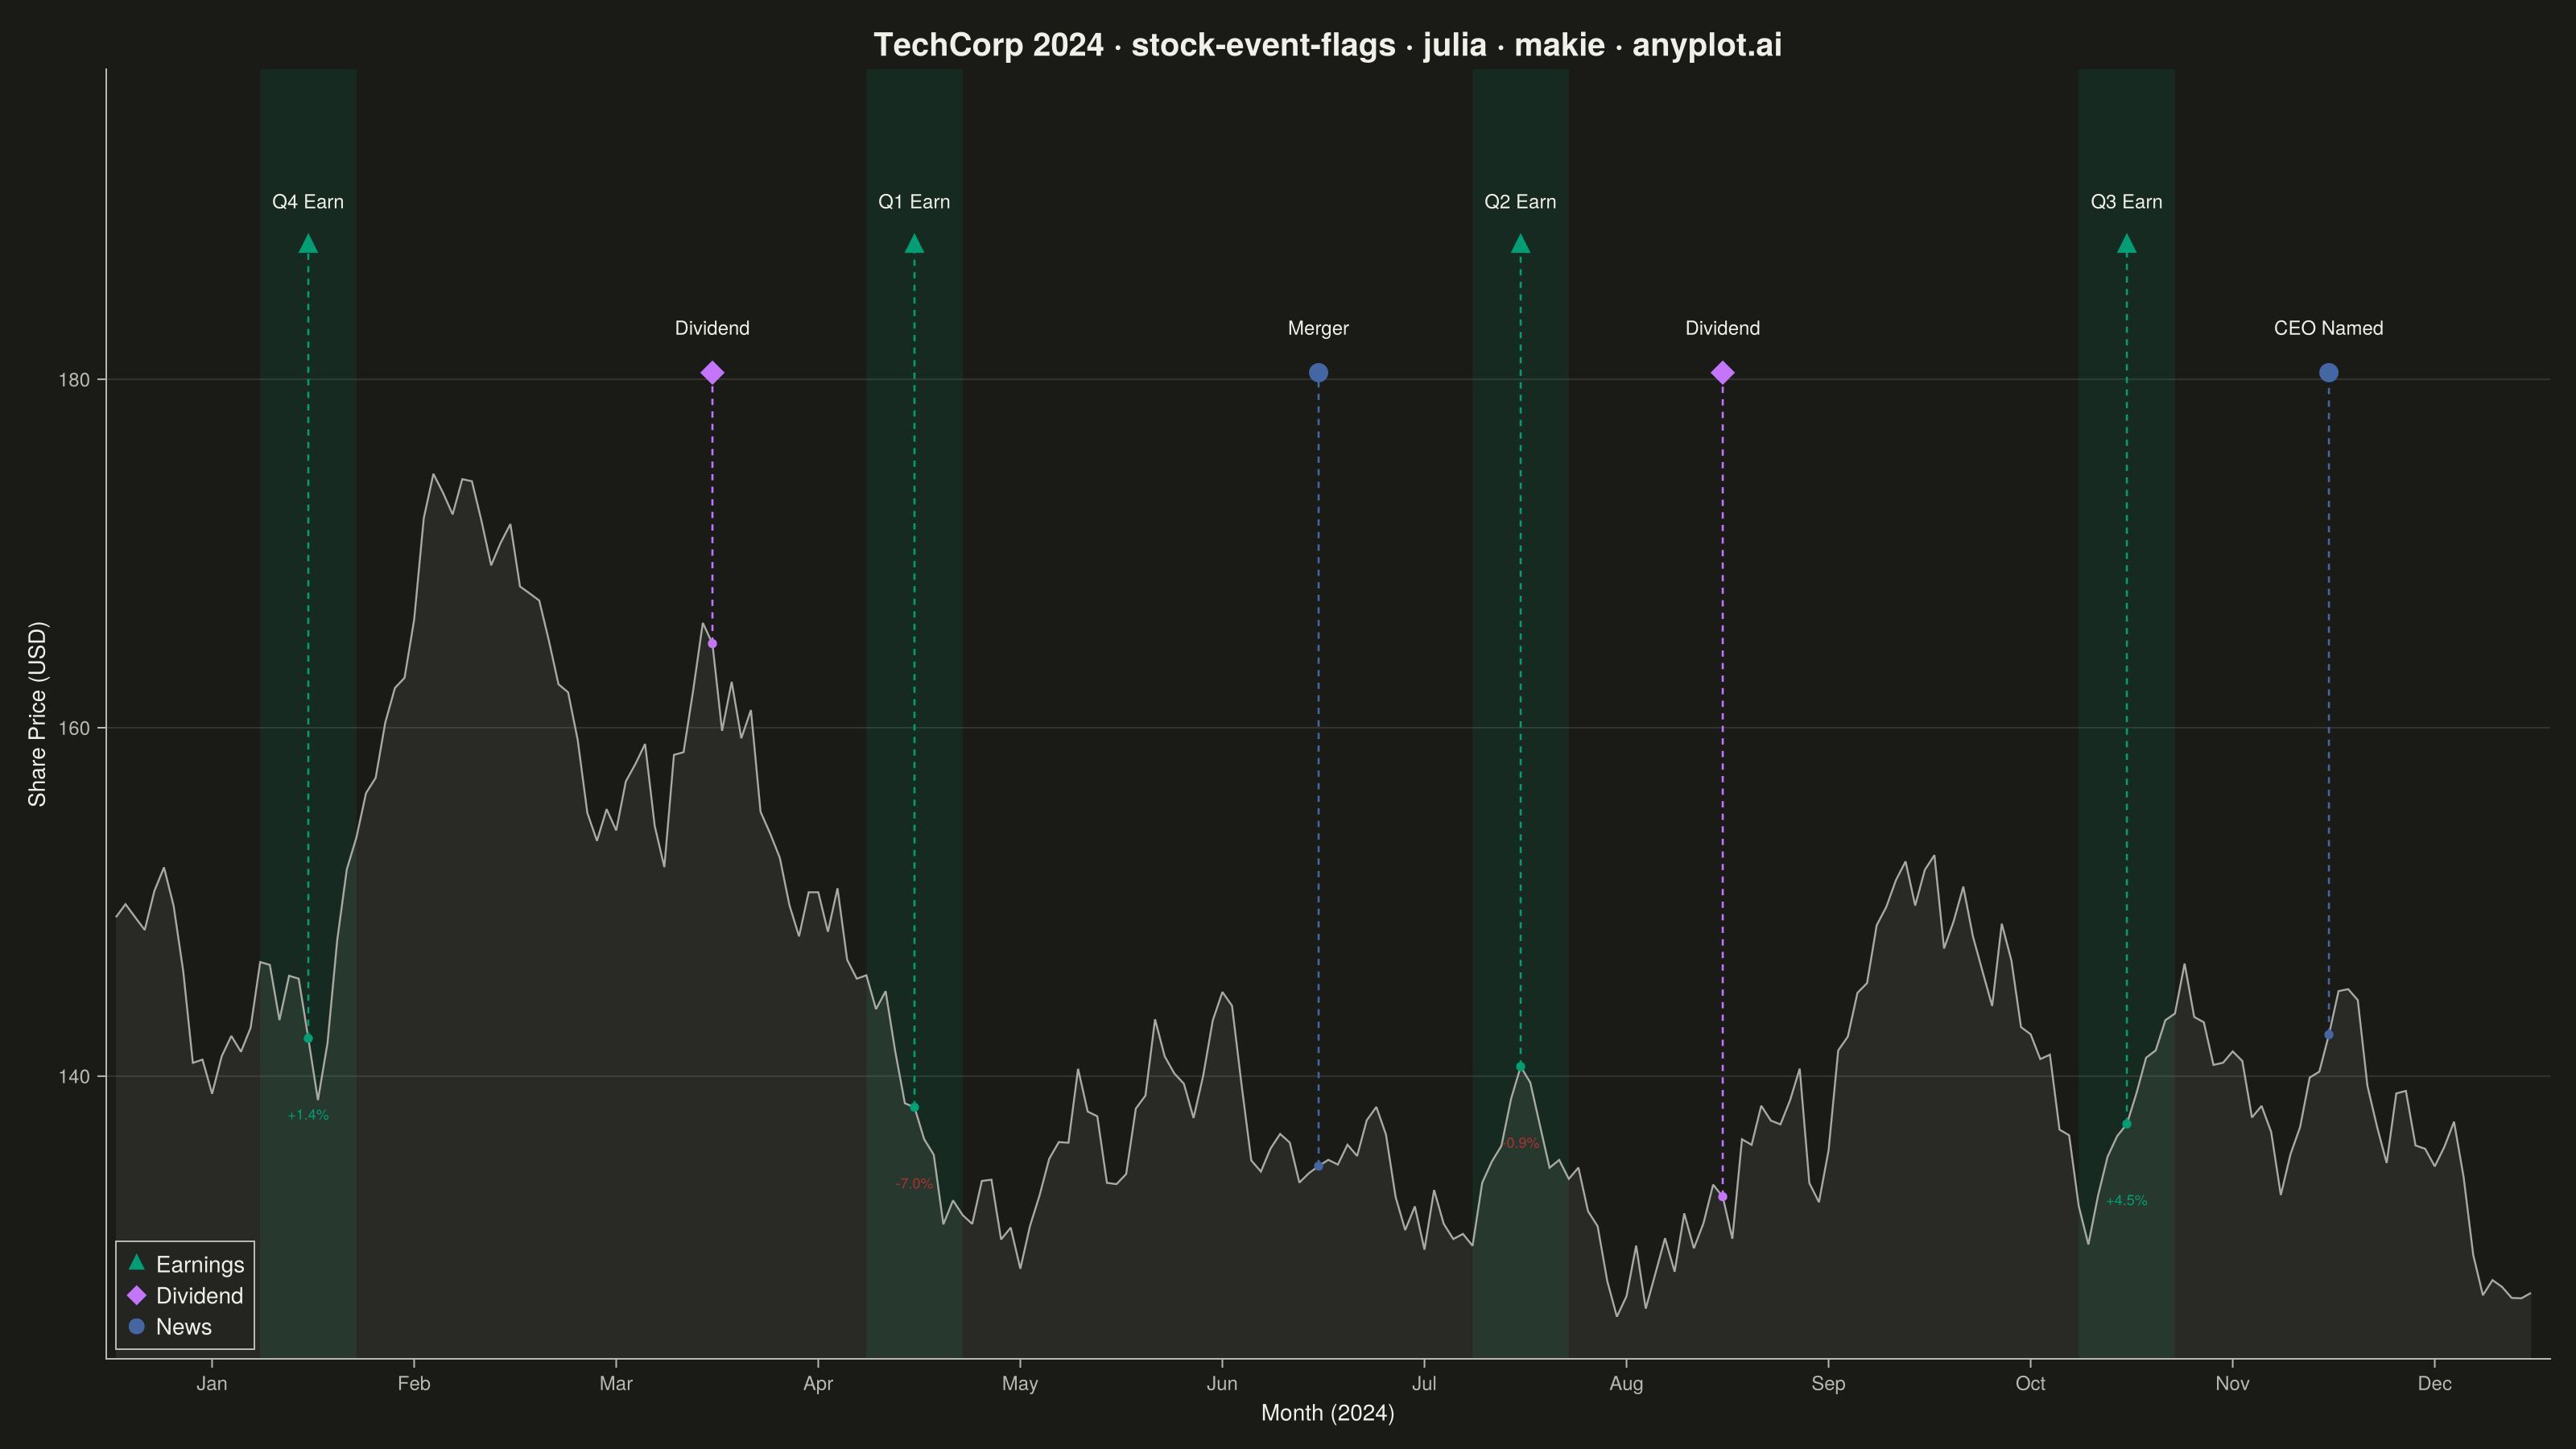
A stock price chart with flag-style markers annotating significant events such as earnings releases, dividends, stock splits, or news events. Unlike simple line annotations, flags are positioned above or below the price data with connector lines and styled icons that distinguish event types. This visualization is standard in financial trading platforms, enabling investors to correlate price movements with corporate actions and market events at a glance.
# anyplot.ai
# stock-event-flags: Stock Chart with Event Flags
# Library: makie 0.22.10 | Julia 1.11.9
# Quality: 89/100 | Updated: 2026-05-28

using CairoMakie
using Colors
using Random

Random.seed!(42)

# Theme tokens
const THEME       = get(ENV, "ANYPLOT_THEME", "light")
const PAGE_BG     = THEME == "light" ? colorant"#FAF8F1" : colorant"#1A1A17"
const ELEVATED_BG = THEME == "light" ? colorant"#FFFDF6" : colorant"#242420"
const INK         = THEME == "light" ? colorant"#1A1A17" : colorant"#F0EFE8"
const INK_SOFT    = THEME == "light" ? colorant"#4A4A44" : colorant"#B8B7B0"

# Imprint palette positions 1→3 for event types; position 5 for negative reactions
const COLOR_EARNINGS = colorant"#009E73"  # 1 — brand green (quarterly earnings)
const COLOR_DIVIDEND = colorant"#C475FD"  # 2 — lavender   (dividend payments)
const COLOR_NEWS     = colorant"#4467A3"  # 3 — blue        (analyst / news events)
const COLOR_LOSS     = colorant"#AE3030"  # 5 — matte red   (negative price reaction)

# Data: simulate one year of tech stock prices via geometric Brownian motion
n_days = 252
mu     = 0.18
sigma  = 0.28
dt     = 1.0 / 252

log_returns = (mu - 0.5 * sigma^2) * dt .+ sigma * sqrt(dt) .* randn(n_days)
prices      = 150.0 .* exp.(cumsum(log_returns))

# Events: (trading_day, event_type, label)
events = [
    (21,  "earnings", "Q4 Earn"),
    (63,  "dividend", "Dividend"),
    (84,  "earnings", "Q1 Earn"),
    (126, "news",     "Merger"),
    (147, "earnings", "Q2 Earn"),
    (168, "dividend", "Dividend"),
    (210, "earnings", "Q3 Earn"),
    (231, "news",     "CEO Named"),
]

event_colors  = Dict("earnings" => COLOR_EARNINGS, "dividend" => COLOR_DIVIDEND, "news" => COLOR_NEWS)
event_markers = Dict("earnings" => :utriangle,     "dividend" => :diamond,       "news" => :circle)

# Month x-axis ticks (~21 trading days per month)
month_centers = collect(11:21:242)
month_labels  = ["Jan", "Feb", "Mar", "Apr", "May", "Jun",
                 "Jul", "Aug", "Sep", "Oct", "Nov", "Dec"]

# Flag heights: alternating above the max price to avoid obscuring data
y_min   = minimum(prices)
y_max   = maximum(prices)
p_range = y_max - y_min
flag_lo = y_max + 0.12 * p_range
flag_hi = y_max + 0.27 * p_range
y_top   = y_max + 0.48 * p_range
y_bot   = y_min - 0.05 * p_range

# Post-earnings price reactions: 3-day post vs 2-day pre window
earn_days = [day for (day, etype, _) in events if etype == "earnings"]
reactions = Dict{Int,Float64}()
for day in earn_days
    pre  = prices[max(day - 2, 1)]
    post = prices[min(day + 3, n_days)]
    reactions[day] = (post - pre) / pre
end

# Title with length-adaptive fontsize
title_str      = "TechCorp 2024 · stock-event-flags · julia · makie · anyplot.ai"
title_fontsize = length(title_str) > 67 ? round(Int, 20 * 67.0 / length(title_str)) : 20

# Figure
fig = Figure(
    size            = (1600, 900),
    fontsize        = 14,
    backgroundcolor = PAGE_BG,
)

ax = Axis(fig[1, 1];
    title             = title_str,
    titlesize         = title_fontsize,
    titlecolor        = INK,
    xlabel            = "Month (2024)",
    ylabel            = "Share Price (USD)",
    xlabelcolor       = INK,
    xlabelsize        = 14,
    ylabelcolor       = INK,
    ylabelsize        = 14,
    xticklabelcolor   = INK_SOFT,
    xticklabelsize    = 12,
    yticklabelcolor   = INK_SOFT,
    yticklabelsize    = 12,
    xtickcolor        = INK_SOFT,
    ytickcolor        = INK_SOFT,
    backgroundcolor   = PAGE_BG,
    topspinevisible   = false,
    rightspinevisible = false,
    leftspinecolor    = INK_SOFT,
    bottomspinecolor  = INK_SOFT,
    xgridvisible      = false,
    ygridcolor        = RGBAf(INK.r, INK.g, INK.b, 0.12),
    xminorgridvisible = false,
    yminorgridvisible = false,
    xticks            = (month_centers, month_labels),
)

# Earnings blackout windows (±5 trading days — clearly visible to guide reader to earnings dates)
for (day, etype, _) in events
    if etype == "earnings"
        poly!(ax, Rect2f(day - 5.0, y_bot, 10.0, y_top - y_bot);
              color       = RGBAf(COLOR_EARNINGS.r, COLOR_EARNINGS.g, COLOR_EARNINGS.b, 0.12),
              strokewidth = 0)
    end
end

# Area fill under price line — creates visual mass for the data layer, recedes behind event flags
band!(ax, 1:n_days, fill(y_bot, n_days), prices;
      color = RGBAf(INK_SOFT.r, INK_SOFT.g, INK_SOFT.b, 0.10))

# Stock price line (thinner so event flags dominate the visual hierarchy)
lines!(ax, 1:n_days, prices;
       color = RGBAf(INK_SOFT.r, INK_SOFT.g, INK_SOFT.b, 0.9), linewidth = 1.2)

# Event flags: dashed connector + price dot + flag marker + label
for (i, (day, etype, label)) in enumerate(events)
    col    = event_colors[etype]
    mkr    = event_markers[etype]
    price  = prices[day]
    flag_y = isodd(i) ? flag_hi : flag_lo

    lines!(ax, [day, day], [price, flag_y]; color = col, linewidth = 1.3, linestyle = :dash)
    scatter!(ax, [day], [price]; color = col, markersize = 8,  strokewidth = 0)
    scatter!(ax, [day], [flag_y]; color = col, marker = mkr, markersize = 17, strokewidth = 0)
    text!(ax, label;
          position = (Float64(day), flag_y + 0.04 * p_range),
          align    = (:center, :bottom),
          fontsize = 12,
          color    = INK)

    # Earnings reaction annotation: green/red % shows how the market responded
    if etype == "earnings"
        pct     = reactions[day]
        pct_str = (pct >= 0 ? "+" : "") * string(round(pct * 100; digits = 1)) * "%"
        ann_y   = max(price - 0.08 * p_range, y_bot + 0.02 * p_range)
        text!(ax, pct_str;
              position = (Float64(day), ann_y),
              align    = (:center, :top),
              fontsize = 9,
              color    = pct >= 0 ? COLOR_EARNINGS : COLOR_LOSS)
    end
end

ylims!(ax, y_bot, y_top)
xlims!(ax, 0, n_days + 2)

# Legend
axislegend(ax,
    [MarkerElement(color = COLOR_EARNINGS, marker = :utriangle, markersize = 14, strokewidth = 0),
     MarkerElement(color = COLOR_DIVIDEND, marker = :diamond,   markersize = 14, strokewidth = 0),
     MarkerElement(color = COLOR_NEWS,     marker = :circle,    markersize = 14, strokewidth = 0)],
    ["Earnings", "Dividend", "News"];
    position        = :lb,
    backgroundcolor = ELEVATED_BG,
    framecolor      = INK_SOFT,
    labelcolor      = INK,
    fontsize        = 11,
    patchsize       = (14.0f0, 14.0f0),
)

save("plot-$(THEME).png", fig; px_per_unit = 2)
Runnable source as JSON, for any HTTP client: https://api.anyplot.ai/specs/stock-event-flags/makie/code. Any spec id and library id listed in llms-full.txt fit the same URL shape; every URL below is complete and callable.
{
  "spec_id": "stock-event-flags",
  "language": "julia",
  "library": "makie",
  "page": "https://anyplot.ai/stock-event-flags/julia/makie",
  "hub": "https://anyplot.ai/stock-event-flags",
  "code_json": "https://api.anyplot.ai/specs/stock-event-flags/makie/code",
  "spec_json": "https://api.anyplot.ai/specs/stock-event-flags",
  "render_light_png": "https://storage.googleapis.com/anyplot-images/plots/stock-event-flags/julia/makie/plot-light.png",
  "render_dark_png": "https://storage.googleapis.com/anyplot-images/plots/stock-event-flags/julia/makie/plot-dark.png",
  "quality_score": 89.0,
  "license": "MIT",
  "guide": "https://anyplot.ai/llms.txt"
}
Part of Stock Chart with Event Flags on anyplot.ai.