The same plot in 14 other libraries — JavaScript: Chart.js, D3.js, Apache ECharts, MUI X Charts; Python: Altair, Bokeh, lets-plot, Matplotlib, Plotly, plotnine, Pygal, Seaborn; R: ggplot2; Julia: Makie.jl. Compare all 15 side by side: Stock Chart with Event Flags in Python, R, Julia and JavaScript.
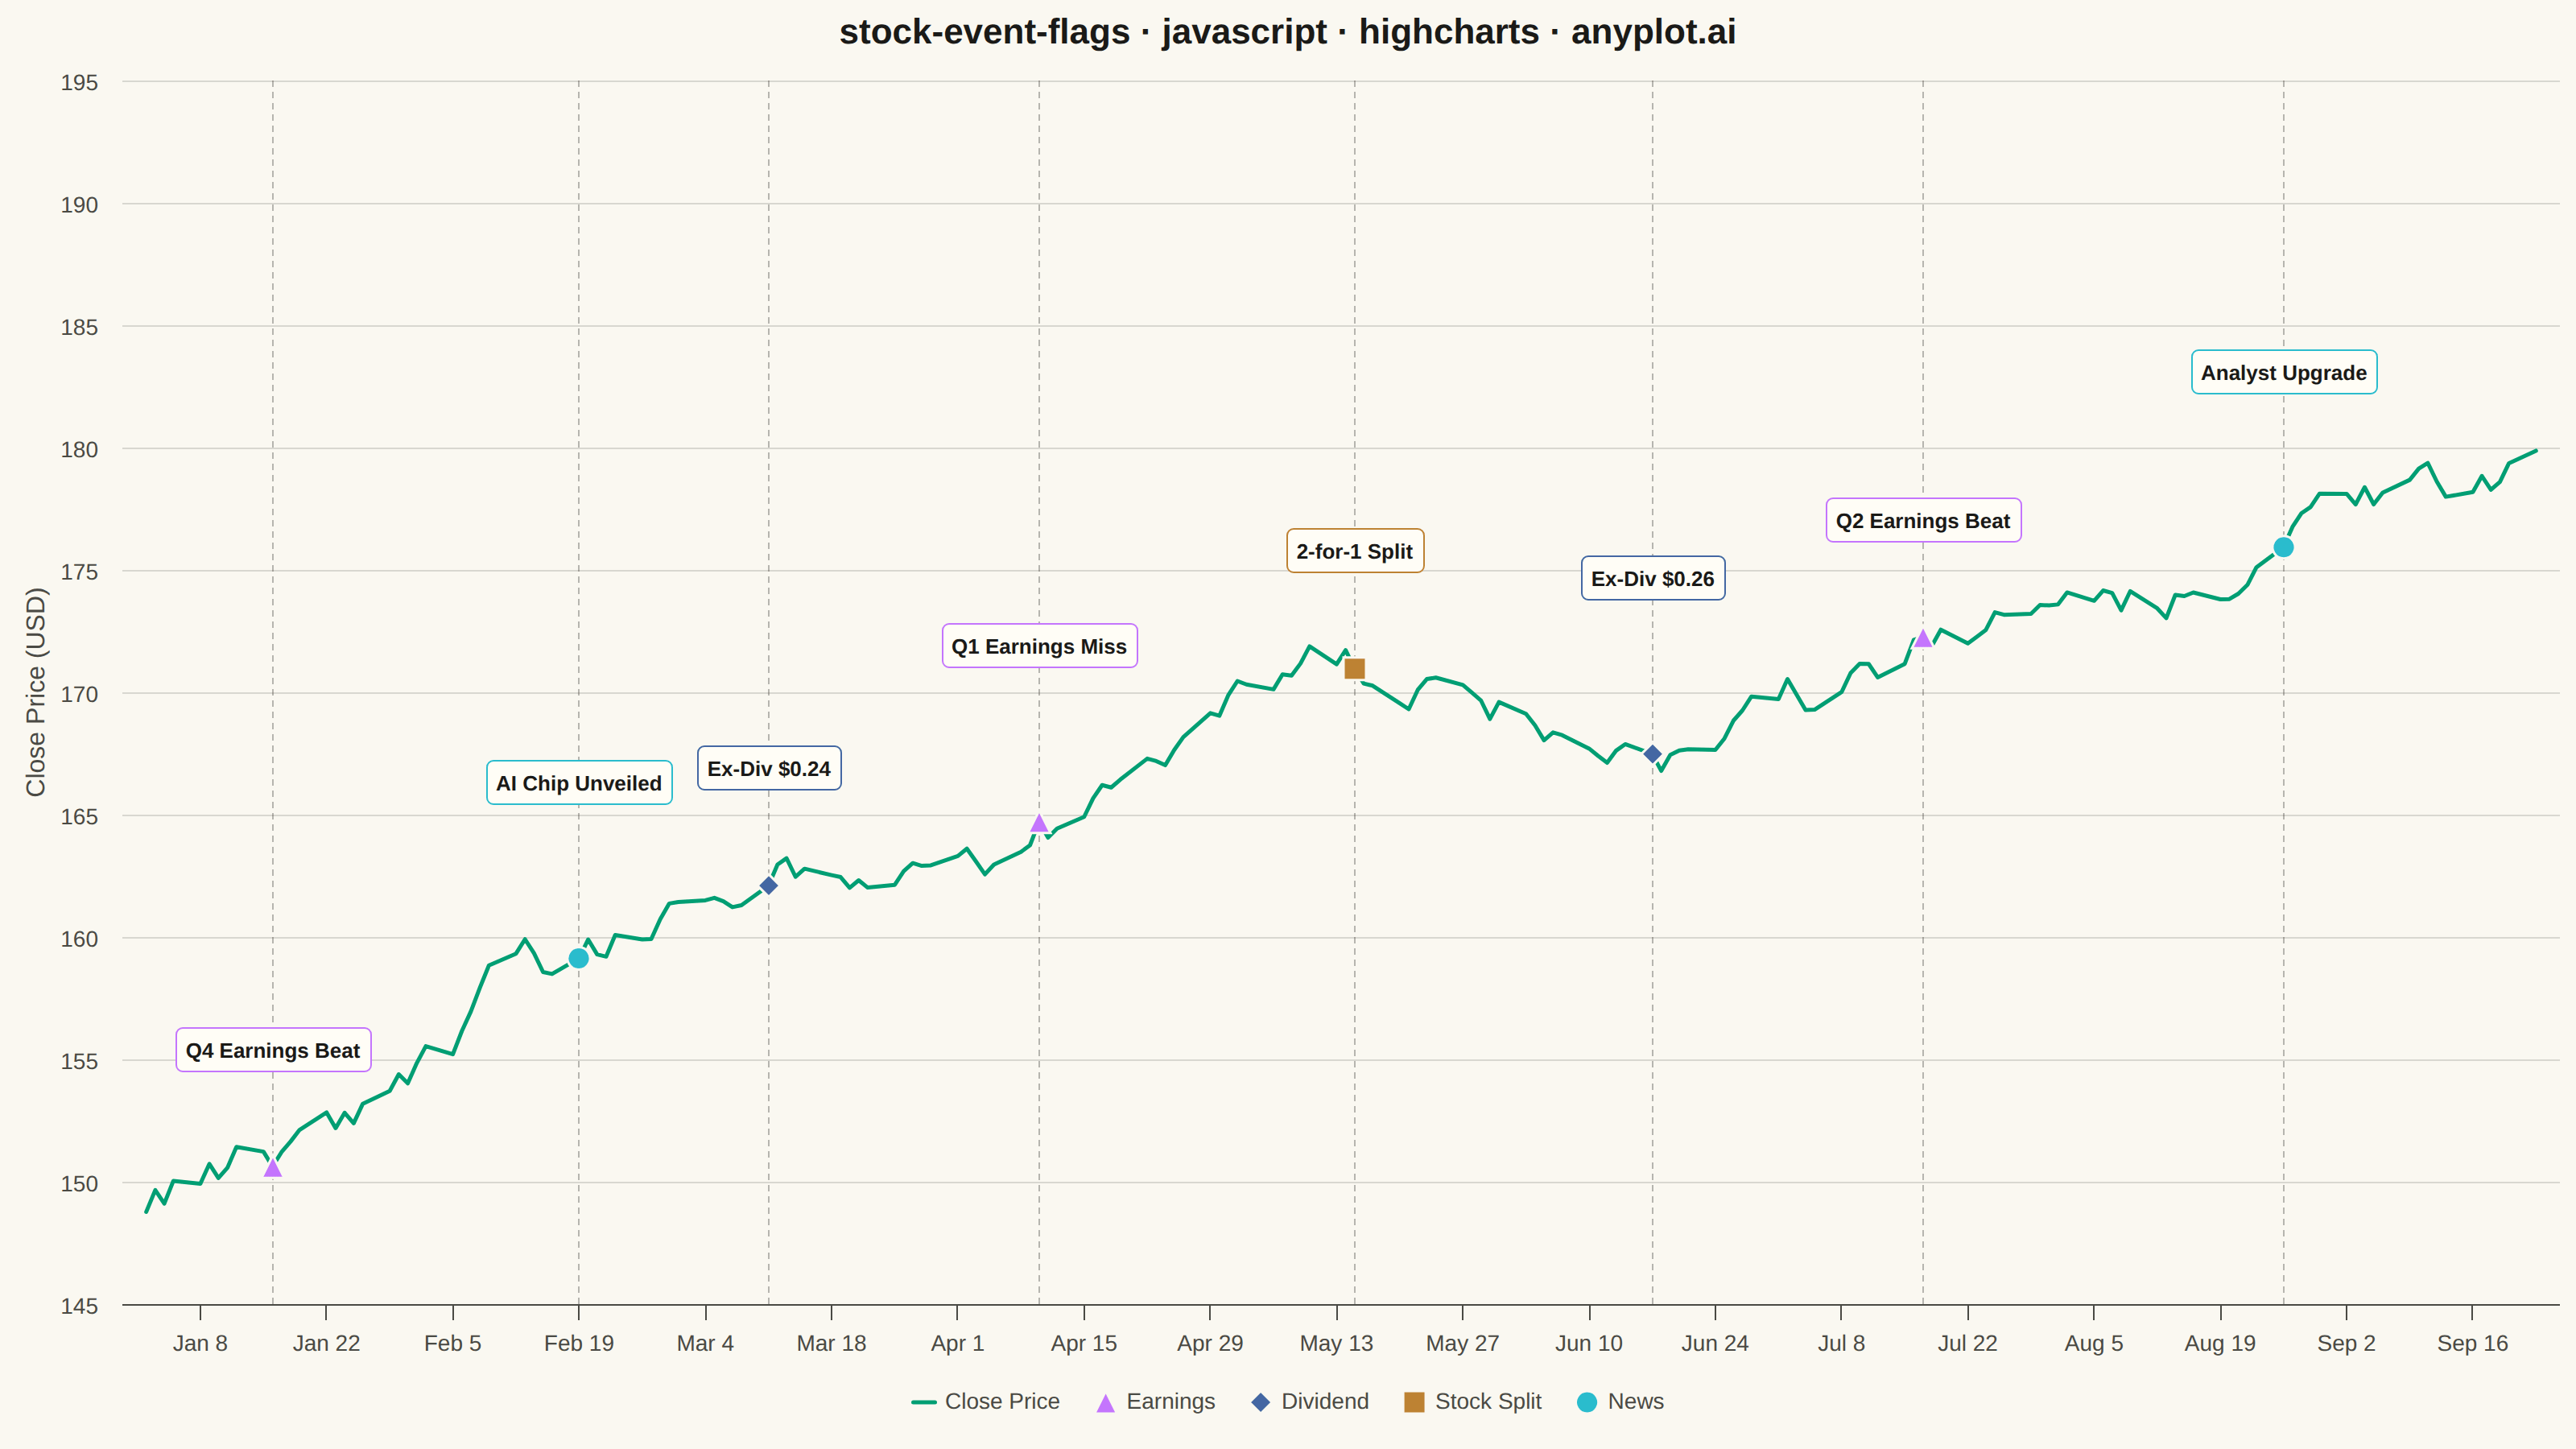
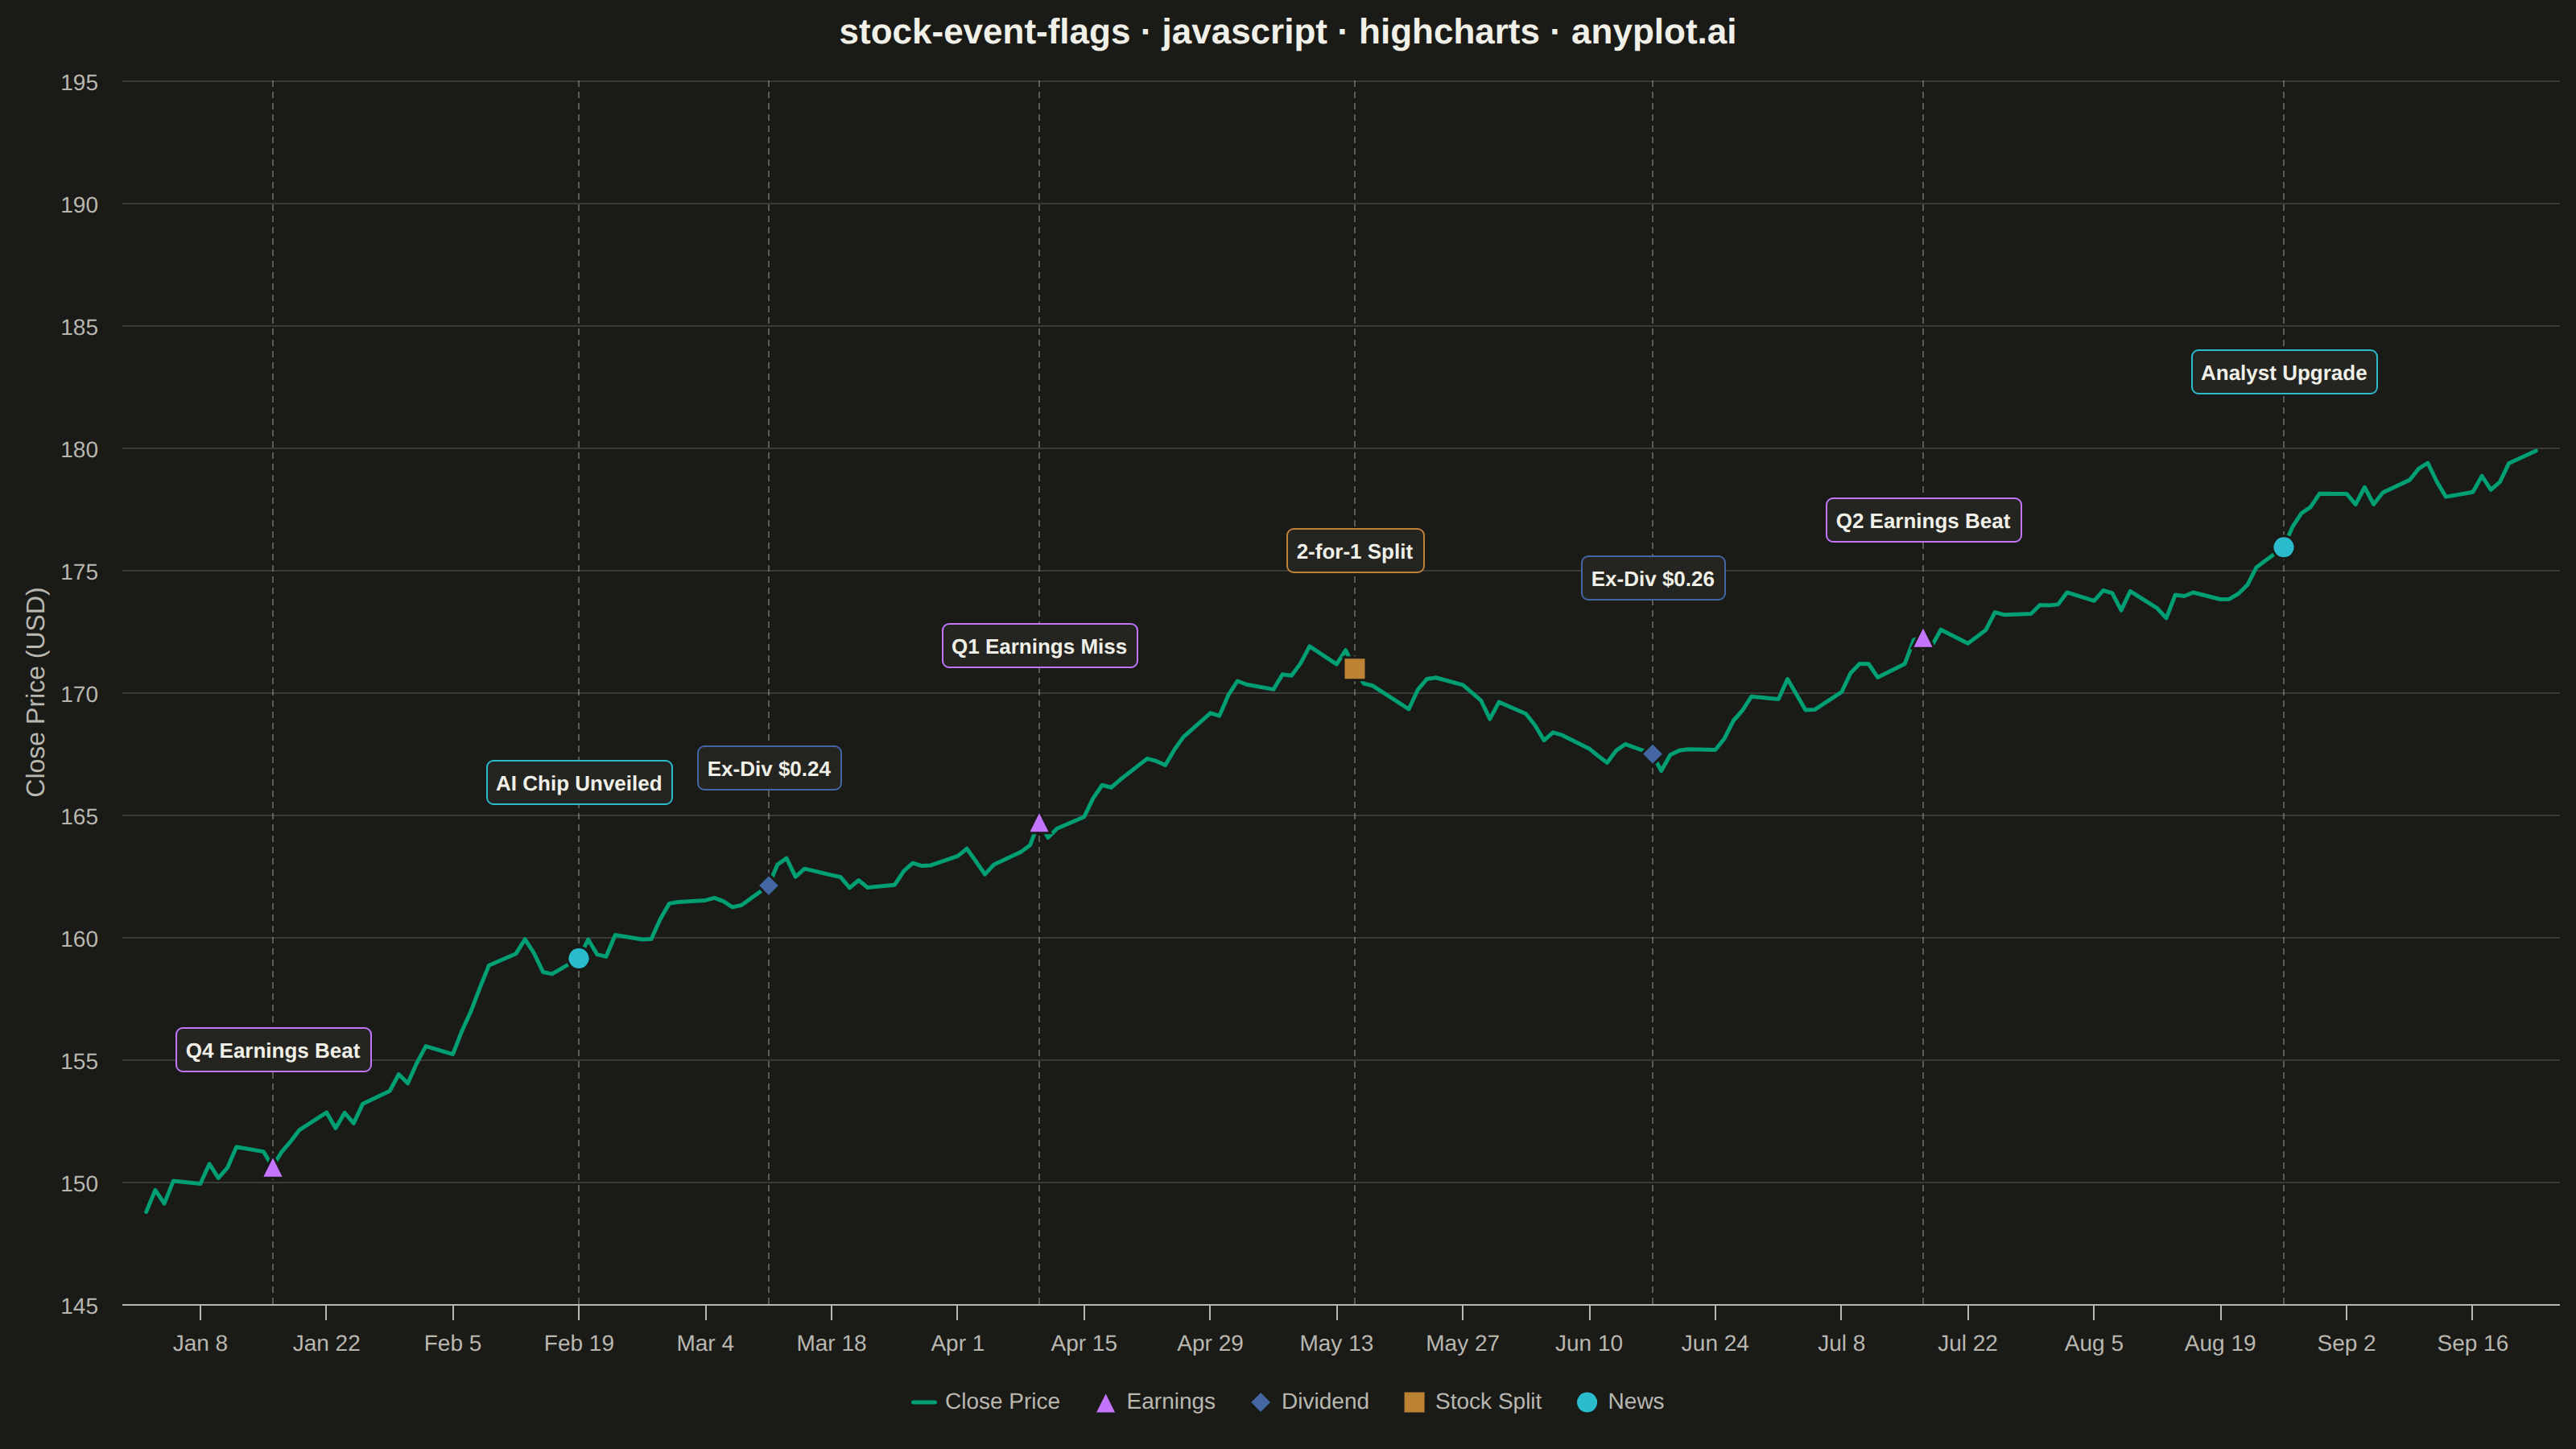
A stock price chart with flag-style markers annotating significant events such as earnings releases, dividends, stock splits, or news events. Unlike simple line annotations, flags are positioned above or below the price data with connector lines and styled icons that distinguish event types. This visualization is standard in financial trading platforms, enabling investors to correlate price movements with corporate actions and market events at a glance.
// anyplot.ai
// stock-event-flags: Stock Chart with Event Flags
// Library: highcharts 12.6.0 | JavaScript 22.23.2
// Quality: 92/100 | Created: 2026-08-26

const t = window.ANYPLOT_TOKENS;

// --- Helpers -----------------------------------------------------------------
function makeLcg(seed) {
  let state = seed >>> 0;
  return function lcg() {
    state = (1103515245 * state + 12345) >>> 0;
    return state / 4294967296;
  };
}
function hexToRgba(hex, alpha) {
  const r = parseInt(hex.slice(1, 3), 16);
  const g = parseInt(hex.slice(3, 5), 16);
  const b = parseInt(hex.slice(5, 7), 16);
  return `rgba(${r}, ${g}, ${b}, ${alpha})`;
}

// --- Data: one trading year for a fictional tech company ---------------------
const TRADING_DAYS = 190;
const tradingDates = [];
const cursor = new Date(Date.UTC(2024, 0, 2));
while (tradingDates.length < TRADING_DAYS) {
  const weekday = cursor.getUTCDay();
  if (weekday !== 0 && weekday !== 6) tradingDates.push(cursor.getTime());
  cursor.setUTCDate(cursor.getUTCDate() + 1);
}

const rng = makeLcg(20260826);
let price = 148;
const closePrices = tradingDates.map(() => {
  const drift = 0.00065;
  const shock = (rng() - 0.5) * 4.4;
  price = Math.max(30, price * (1 + drift) + shock * 0.4);
  return Math.round(price * 100) / 100;
});

const EVENTS = [
  { i: 10, type: "earnings", label: "Q4 Earnings Beat" },
  { i: 34, type: "news", label: "AI Chip Unveiled" },
  { i: 49, type: "dividend", label: "Ex-Div $0.24" },
  { i: 71, type: "earnings", label: "Q1 Earnings Miss" },
  { i: 96, type: "split", label: "2-for-1 Split" },
  { i: 119, type: "dividend", label: "Ex-Div $0.26" },
  { i: 141, type: "earnings", label: "Q2 Earnings Beat" },
  { i: 169, type: "news", label: "Analyst Upgrade" },
];

const EVENT_STYLE = {
  earnings: { name: "Earnings", color: t.palette[1], symbol: "triangle" },
  dividend: { name: "Dividend", color: t.palette[2], symbol: "diamond" },
  split: { name: "Stock Split", color: t.palette[3], symbol: "square" },
  news: { name: "News", color: t.palette[5], symbol: "circle" },
};

const eventSeriesData = { earnings: [], dividend: [], split: [], news: [] };
EVENTS.forEach((event, idx) => {
  eventSeriesData[event.type].push({
    x: tradingDates[event.i],
    y: closePrices[event.i],
    label: event.label,
    dataLabels: { y: idx % 2 === 0 ? -60 : -96 },
  });
});

// Dashed connector from each flag down to its trading date, theme-adaptive.
const connectorColor = hexToRgba(t.ink, 0.3);

// --- Chart -------------------------------------------------------------------
Highcharts.chart("container", {
  chart: {
    type: "line",
    backgroundColor: "transparent",
    animation: false,
    style: { fontFamily: "inherit" },
  },
  credits: { enabled: false },
  colors: t.palette,
  title: {
    text: "stock-event-flags · javascript · highcharts · anyplot.ai",
    style: { color: t.ink, fontSize: "22px", fontWeight: "600" },
  },
  xAxis: {
    type: "datetime",
    lineColor: t.inkSoft,
    tickColor: t.inkSoft,
    gridLineColor: t.grid,
    labels: { style: { color: t.inkSoft, fontSize: "14px" } },
    plotLines: EVENTS.map((event) => ({
      value: tradingDates[event.i],
      color: connectorColor,
      dashStyle: "Dash",
      width: 1,
      zIndex: 2,
    })),
  },
  yAxis: {
    title: {
      text: "Close Price (USD)",
      style: { color: t.inkSoft, fontSize: "16px" },
    },
    gridLineColor: t.grid,
    labels: { style: { color: t.inkSoft, fontSize: "14px" } },
    maxPadding: 0.38,
    minPadding: 0.08,
  },
  legend: {
    itemStyle: { color: t.inkSoft, fontSize: "14px" },
    itemHoverStyle: { color: t.ink },
  },
  tooltip: {
    backgroundColor: t.elevatedBg,
    borderColor: t.inkSoft,
    style: { color: t.ink },
    xDateFormat: "%b %e, %Y",
  },
  plotOptions: {
    series: { animation: false },
    line: { marker: { enabled: false } },
    scatter: {
      marker: { radius: 7, lineWidth: 1.5, lineColor: t.pageBg },
      dataLabels: {
        enabled: true,
        format: "{point.label}",
        verticalAlign: "bottom",
        align: "center",
        backgroundColor: t.elevatedBg,
        borderRadius: 4,
        borderWidth: 1,
        padding: 6,
        style: {
          color: t.ink,
          fontSize: "13px",
          fontWeight: "600",
          textOutline: "none",
        },
      },
    },
  },
  series: [
    {
      name: "Close Price",
      type: "line",
      data: tradingDates.map((date, i) => [date, closePrices[i]]),
      color: t.palette[0],
      lineWidth: 2.5,
      zIndex: 1,
    },
    {
      name: EVENT_STYLE.earnings.name,
      type: "scatter",
      data: eventSeriesData.earnings,
      color: EVENT_STYLE.earnings.color,
      marker: { symbol: EVENT_STYLE.earnings.symbol },
      dataLabels: { borderColor: EVENT_STYLE.earnings.color },
      zIndex: 3,
    },
    {
      name: EVENT_STYLE.dividend.name,
      type: "scatter",
      data: eventSeriesData.dividend,
      color: EVENT_STYLE.dividend.color,
      marker: { symbol: EVENT_STYLE.dividend.symbol },
      dataLabels: { borderColor: EVENT_STYLE.dividend.color },
      zIndex: 3,
    },
    {
      name: EVENT_STYLE.split.name,
      type: "scatter",
      data: eventSeriesData.split,
      color: EVENT_STYLE.split.color,
      marker: { symbol: EVENT_STYLE.split.symbol },
      dataLabels: { borderColor: EVENT_STYLE.split.color },
      zIndex: 3,
    },
    {
      name: EVENT_STYLE.news.name,
      type: "scatter",
      data: eventSeriesData.news,
      color: EVENT_STYLE.news.color,
      marker: { symbol: EVENT_STYLE.news.symbol },
      dataLabels: { borderColor: EVENT_STYLE.news.color },
      zIndex: 3,
    },
  ],
});
Runnable source as JSON, for any HTTP client: https://api.anyplot.ai/specs/stock-event-flags/highcharts/code. Any spec id and library id listed in llms-full.txt fit the same URL shape; every URL below is complete and callable.
{
  "spec_id": "stock-event-flags",
  "language": "javascript",
  "library": "highcharts",
  "page": "https://anyplot.ai/stock-event-flags/javascript/highcharts",
  "hub": "https://anyplot.ai/stock-event-flags",
  "code_json": "https://api.anyplot.ai/specs/stock-event-flags/highcharts/code",
  "spec_json": "https://api.anyplot.ai/specs/stock-event-flags",
  "render_light_png": "https://storage.googleapis.com/anyplot-images/plots/stock-event-flags/javascript/highcharts/plot-light.png",
  "render_dark_png": "https://storage.googleapis.com/anyplot-images/plots/stock-event-flags/javascript/highcharts/plot-dark.png",
  "interactive_light_html": "https://storage.googleapis.com/anyplot-images/plots/stock-event-flags/javascript/highcharts/plot-light.html",
  "interactive_dark_html": "https://storage.googleapis.com/anyplot-images/plots/stock-event-flags/javascript/highcharts/plot-dark.html",
  "quality_score": 92.0,
  "license": "MIT",
  "guide": "https://anyplot.ai/llms.txt"
}
Part of Stock Chart with Event Flags on anyplot.ai.