The same plot in 14 other libraries — JavaScript: Chart.js, D3.js, Highcharts, MUI X Charts; Python: Altair, Bokeh, lets-plot, Matplotlib, Plotly, plotnine, Pygal, Seaborn; R: ggplot2; Julia: Makie.jl. Compare all 15 side by side: Stock Chart with Event Flags in Python, R, Julia and JavaScript.
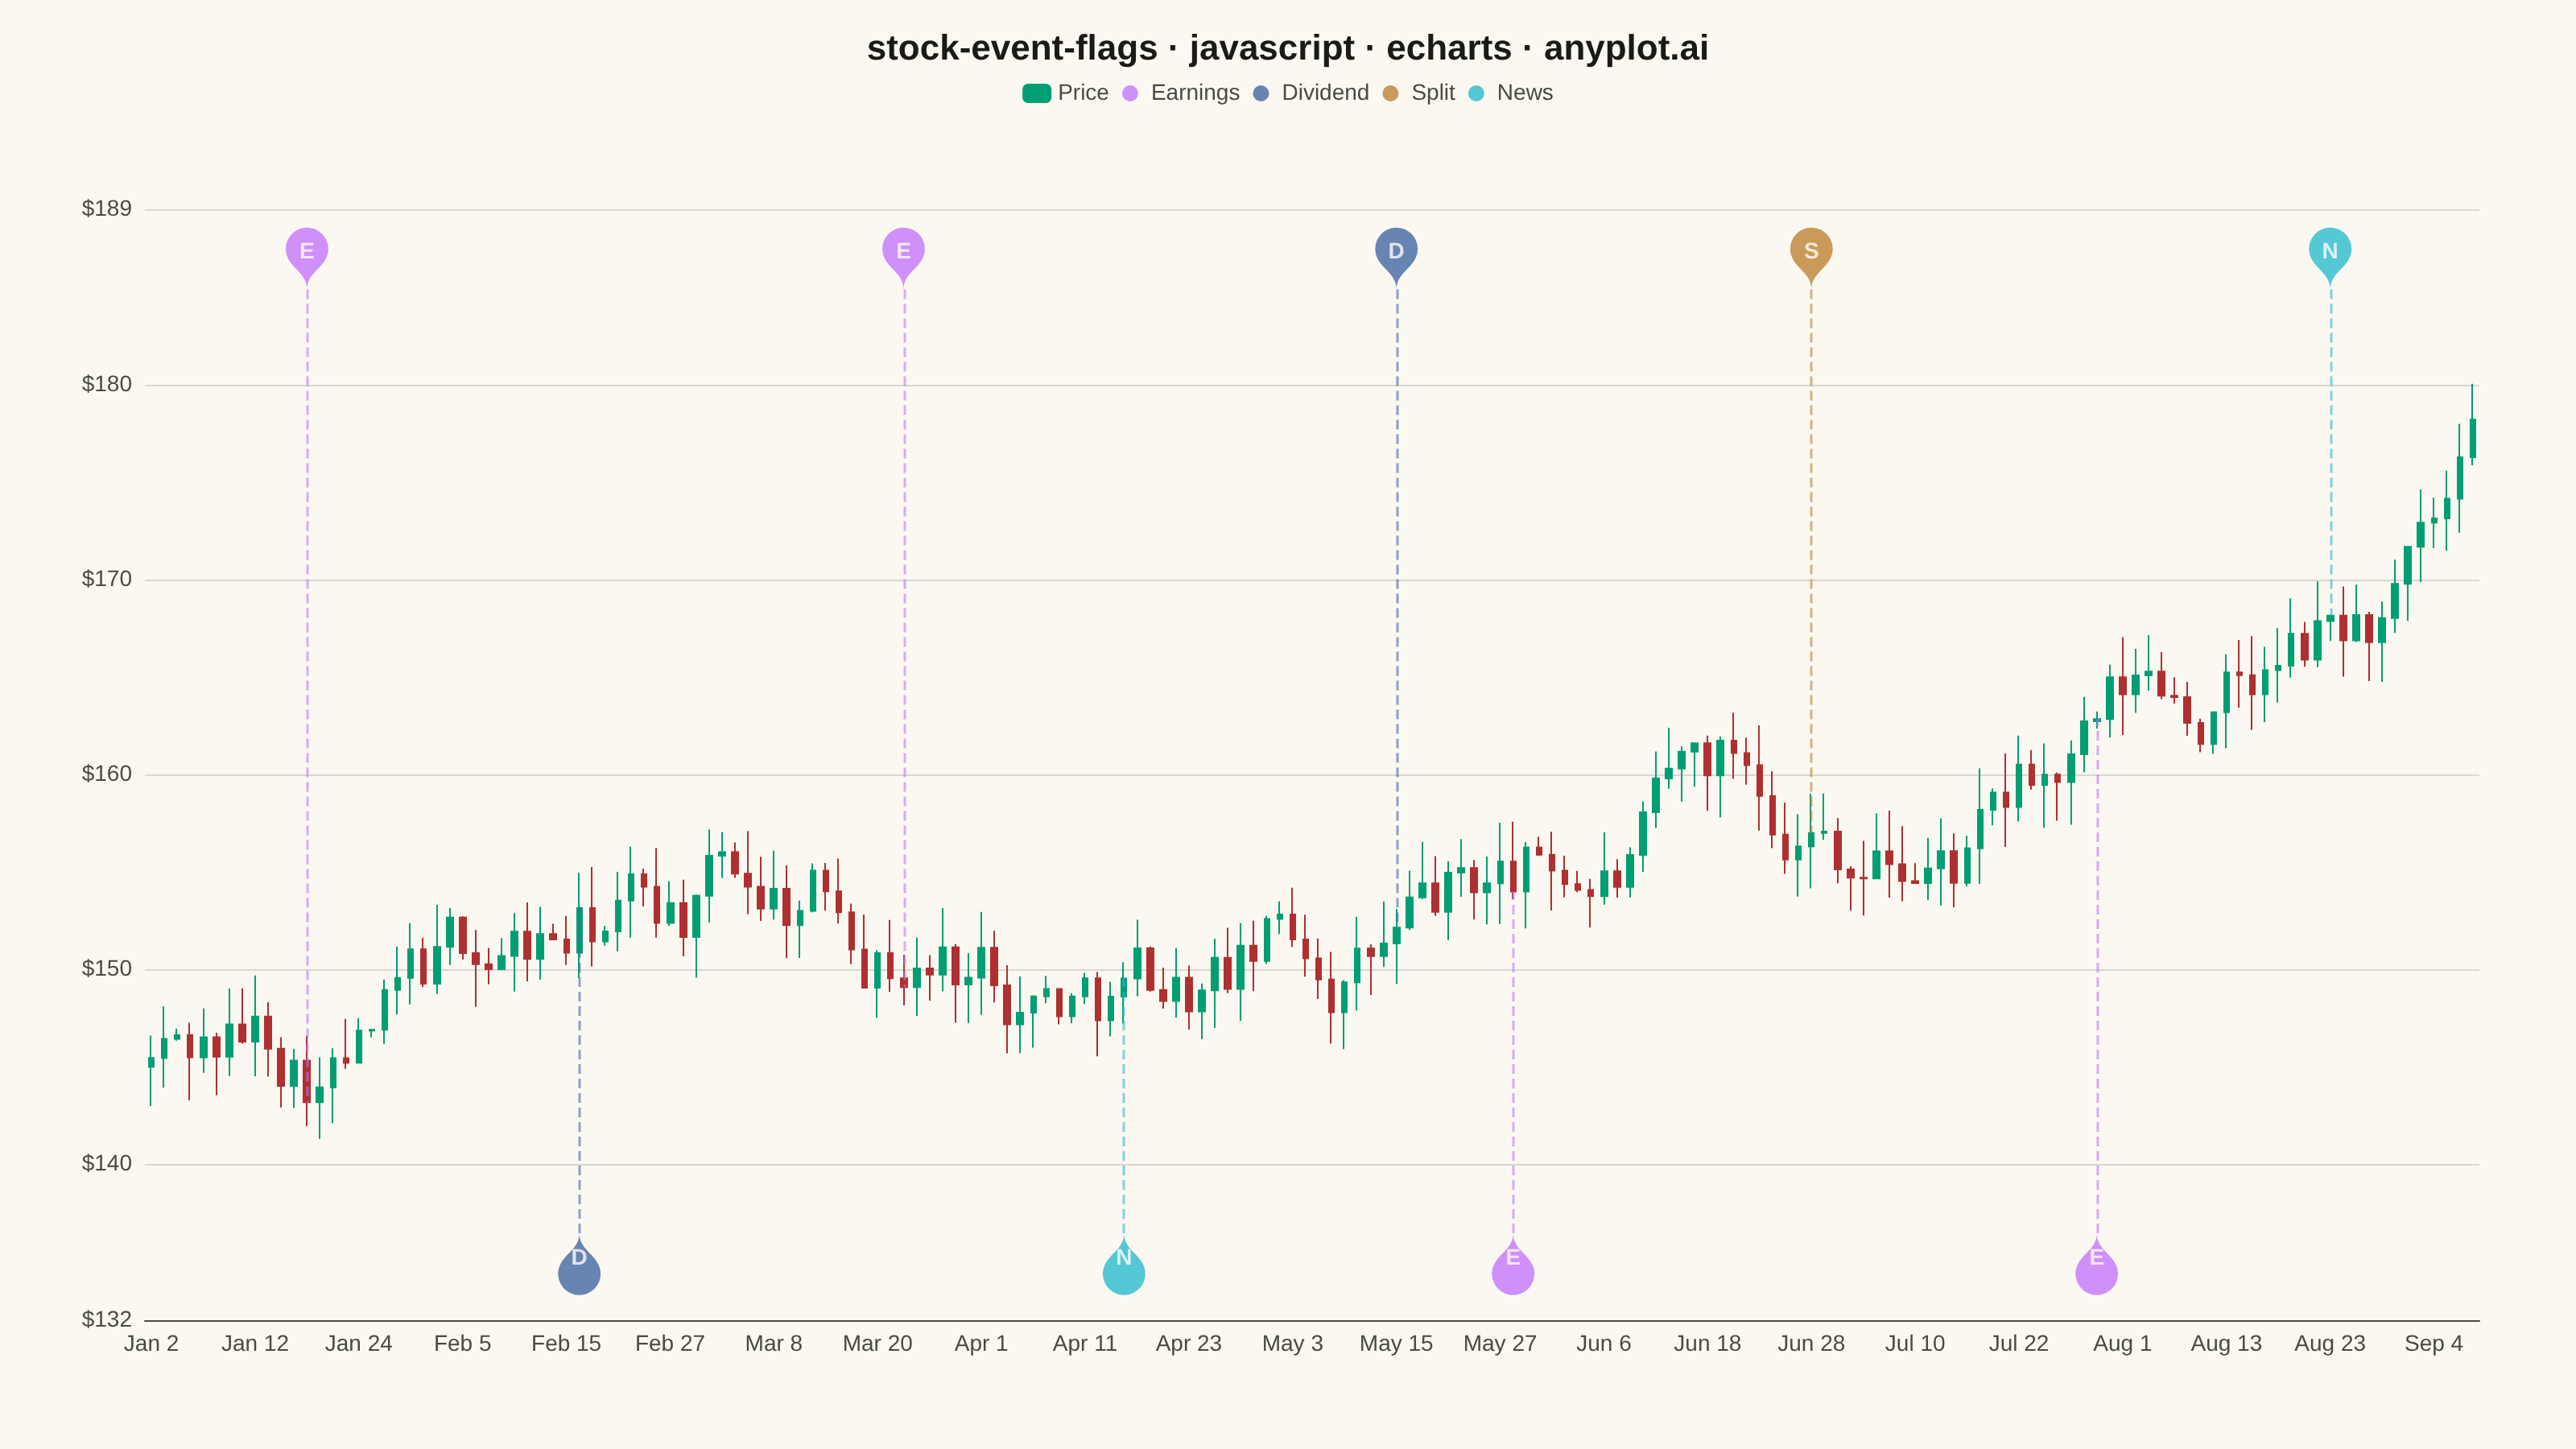
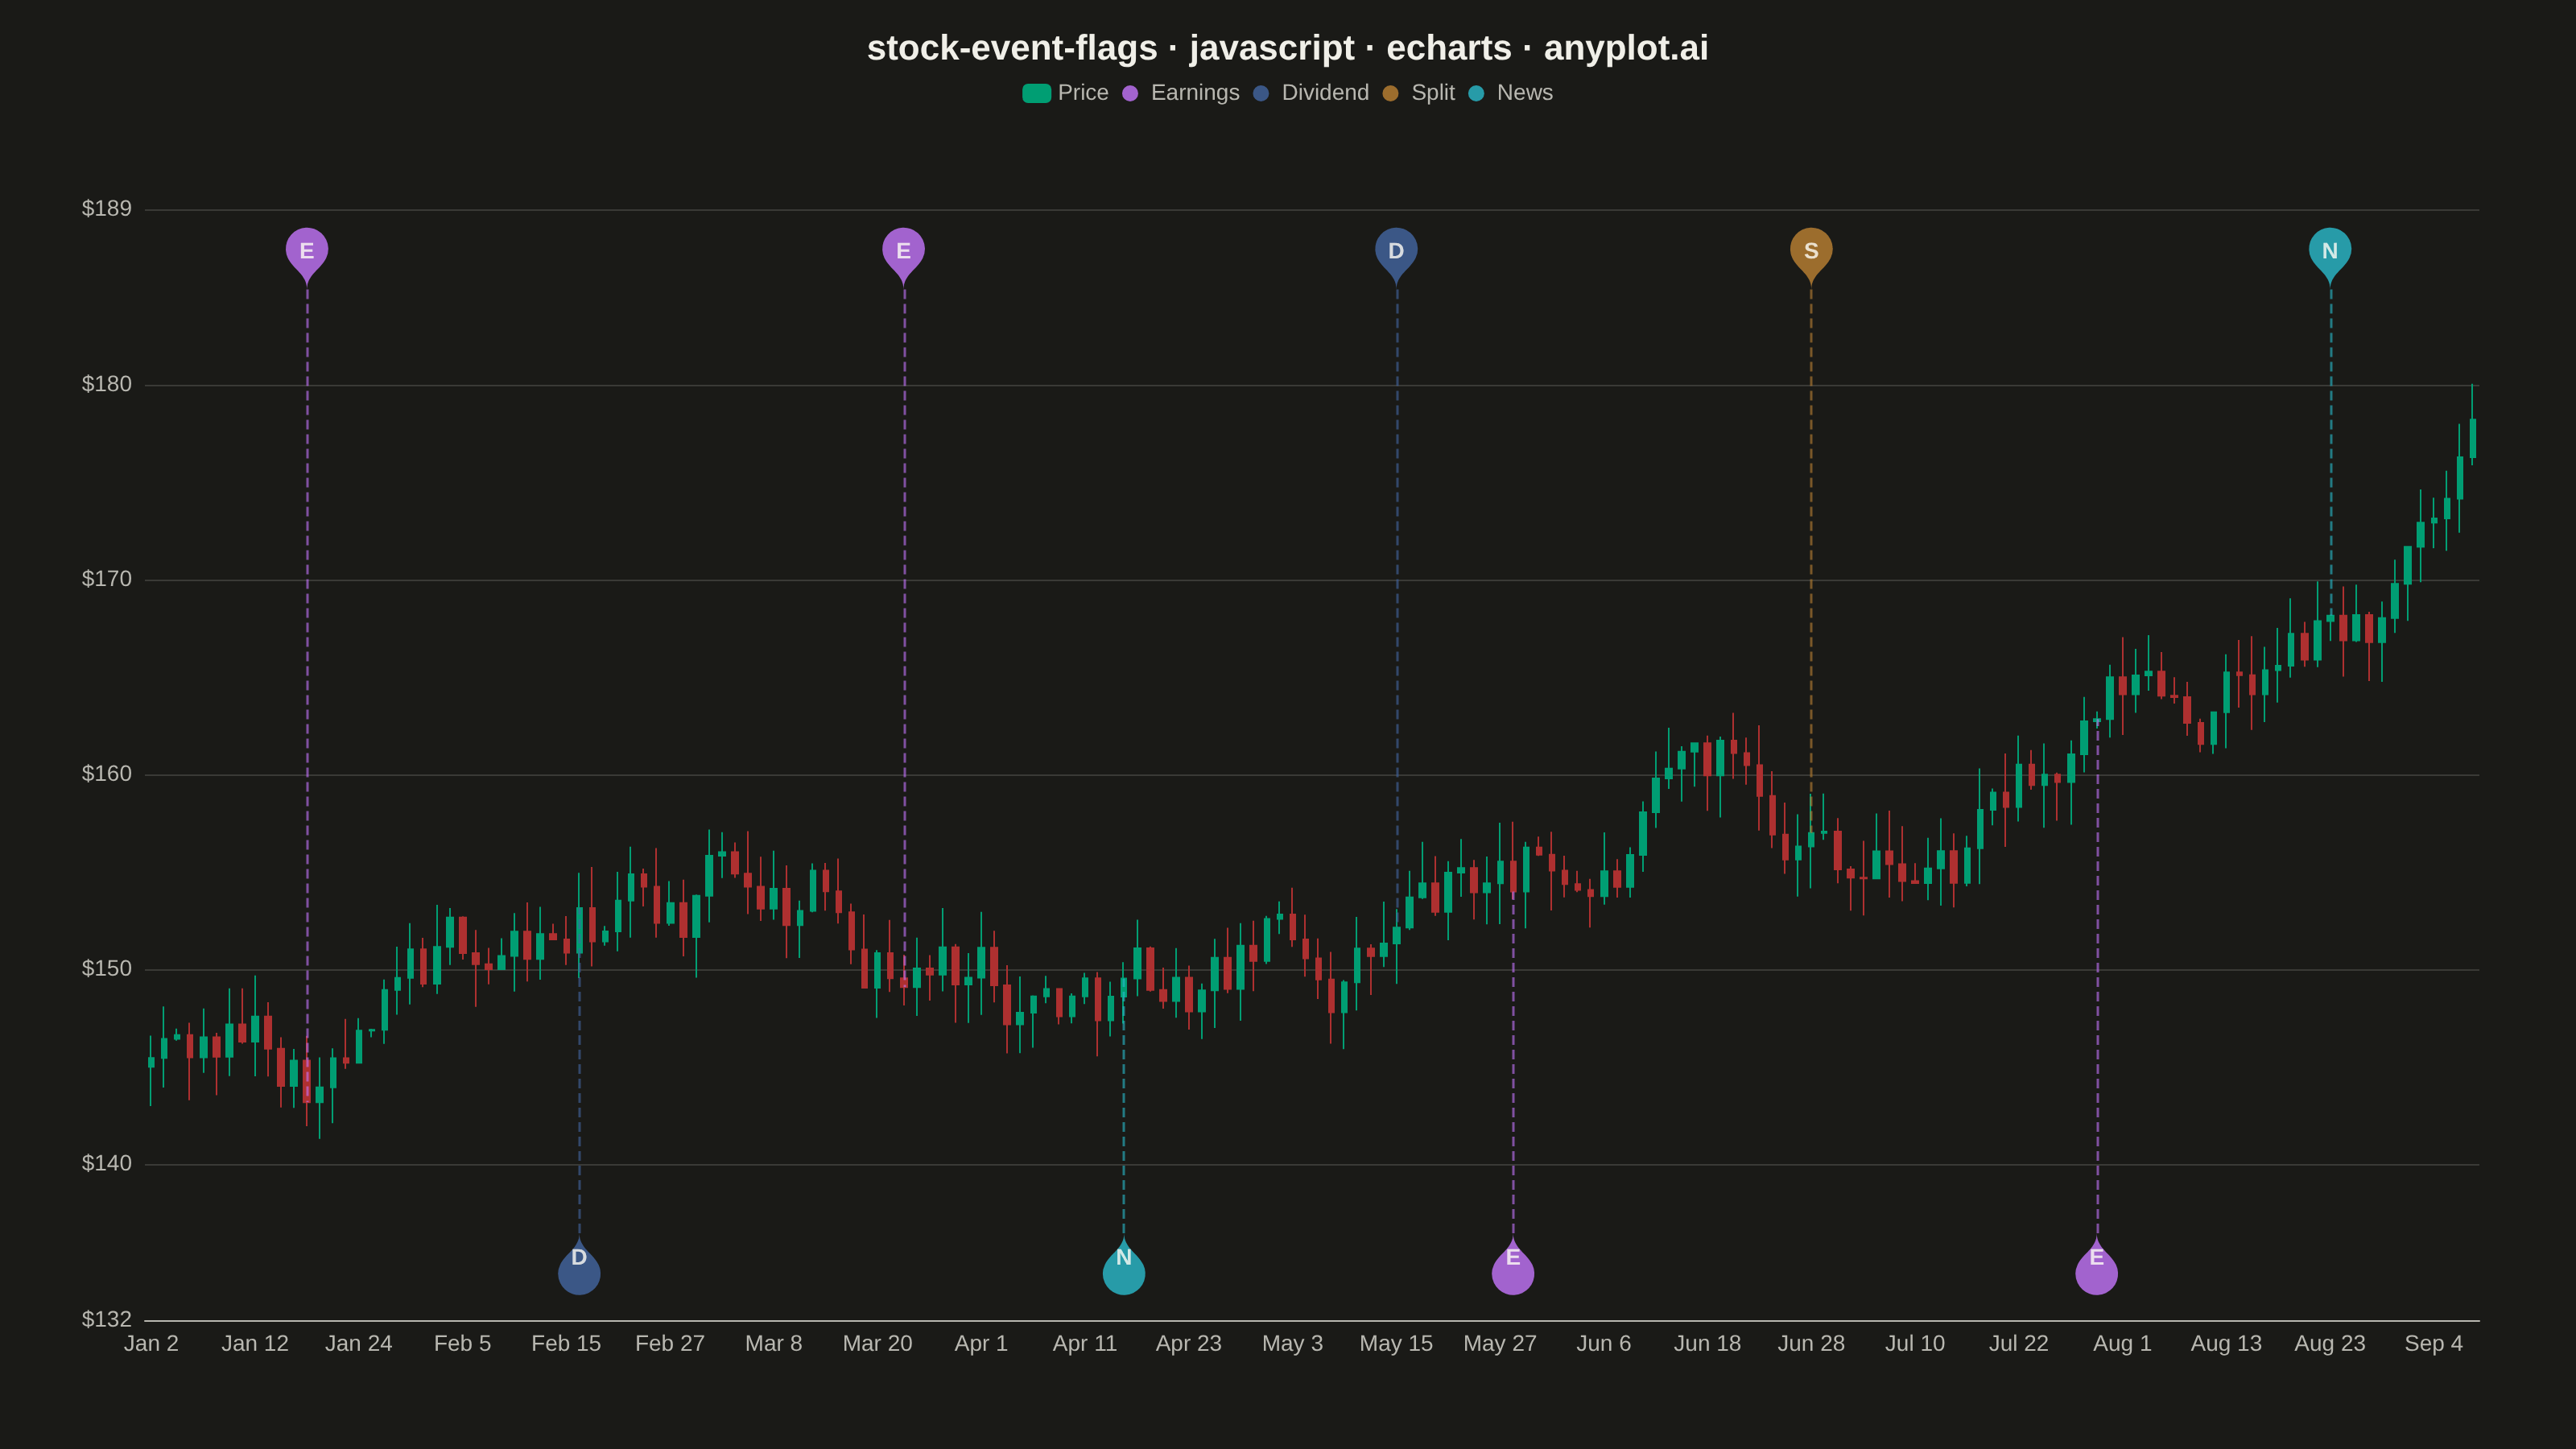
A stock price chart with flag-style markers annotating significant events such as earnings releases, dividends, stock splits, or news events. Unlike simple line annotations, flags are positioned above or below the price data with connector lines and styled icons that distinguish event types. This visualization is standard in financial trading platforms, enabling investors to correlate price movements with corporate actions and market events at a glance.
// anyplot.ai
// stock-event-flags: Stock Chart with Event Flags
// Library: echarts 6.1.0 | JavaScript 22.23.2
// Quality: 92/100 | Created: 2026-08-26

const t = window.ANYPLOT_TOKENS;

// --- Data (in-memory, deterministic) ----------------------------------------
// Small LCG PRNG — the browser has no seeded Math.random.
let seed = 42;
function rand() {
  seed = (seed * 1103515245 + 12345) & 0x7fffffff;
  return seed / 0x7fffffff;
}

const TRADING_DAYS = 180;
const tradingDates = [];
const axisLabels = [];
const candles = []; // [open, close, low, high] per index — echarts candlestick order
const closes = [];

const MONTHS = ["Jan", "Feb", "Mar", "Apr", "May", "Jun", "Jul", "Aug", "Sep", "Oct", "Nov", "Dec"];
let cursor = new Date(2024, 0, 2);
let price = 145;
for (let i = 0; i < TRADING_DAYS; i++) {
  while (cursor.getDay() === 0 || cursor.getDay() === 6) {
    cursor.setDate(cursor.getDate() + 1);
  }
  const open = price;
  const drift = (rand() - 0.48) * 4.5;
  const close = Math.max(20, open + drift);
  const high = Math.max(open, close) + rand() * 2.2;
  const low = Math.min(open, close) - rand() * 2.2;

  tradingDates.push(new Date(cursor));
  axisLabels.push(`${MONTHS[cursor.getMonth()]} ${cursor.getDate()}`);
  candles.push([Number(open.toFixed(2)), Number(close.toFixed(2)), Number(low.toFixed(2)), Number(high.toFixed(2))]);
  closes.push(Number(close.toFixed(2)));

  price = close;
  cursor.setDate(cursor.getDate() + 1);
}

const priceMax = Math.max(...candles.map((c) => c[3]));
const priceMin = Math.min(...candles.map((c) => c[2]));
const pricePad = (priceMax - priceMin) * 0.05;
const upperLane = priceMax + pricePad * 2.5;
const lowerLane = priceMin - pricePad * 2.5;

// Corporate events — index into tradingDates, alternating lanes so flags never
// obscure the price series. Colors come from the Imprint palette (positions 2,
// 3, 4, 6 — 1 and 5 stay reserved for the candlestick's bullish/bearish green/red).
const EVENT_STYLES = {
  earnings: { color: t.palette[1], glyph: "E", label: "Earnings" },
  dividend: { color: t.palette[2], glyph: "D", label: "Dividend" },
  split: { color: t.palette[3], glyph: "S", label: "Split" },
  news: { color: t.palette[5], glyph: "N", label: "News" },
};

const events = [
  { index: 12, type: "earnings", lane: "upper", note: "Q4 earnings beat" },
  { index: 33, type: "dividend", lane: "lower", note: "$0.24 dividend" },
  { index: 58, type: "earnings", lane: "upper", note: "Q1 earnings miss" },
  { index: 75, type: "news", lane: "lower", note: "AI chip launch" },
  { index: 96, type: "dividend", lane: "upper", note: "$0.24 dividend" },
  { index: 105, type: "earnings", lane: "lower", note: "Q2 earnings beat" },
  { index: 128, type: "split", lane: "upper", note: "2-for-1 split" },
  { index: 150, type: "earnings", lane: "lower", note: "Q3 earnings beat" },
  { index: 168, type: "news", lane: "upper", note: "Analyst upgrade" },
];

// One scatter series per event type — gives each type its own legend entry
// and connector-line color, while sharing the upper/lower lane placement.
const eventSeries = Object.keys(EVENT_STYLES).map((type) => {
  const style = EVENT_STYLES[type];
  const typeEvents = events.filter((e) => e.type === type);
  return {
    name: style.label,
    type: "scatter",
    z: 5,
    data: typeEvents.map((e) => ({
      value: [e.index, e.lane === "upper" ? upperLane : lowerLane],
      symbol: "pin",
      symbolSize: 44,
      symbolRotate: e.lane === "upper" ? 0 : 180,
      label: { show: true, formatter: style.glyph, color: "#FFFDF6", fontSize: 14, fontWeight: "bold" },
      note: e.note,
    })),
    itemStyle: { color: style.color },
    markLine: {
      silent: true,
      symbol: ["none", "none"],
      lineStyle: { type: "dashed", color: style.color, width: 1.5, opacity: 0.6 },
      data: typeEvents.map((e) => [
        { coord: [e.index, e.lane === "upper" ? upperLane : lowerLane] },
        { coord: [e.index, closes[e.index]] },
      ]),
    },
    tooltip: {
      formatter: (p) => `${style.label}<br/>${axisLabels[p.data.value[0]]} · ${p.data.note}`,
    },
  };
});

// --- Init ---------------------------------------------------------------
const chart = echarts.init(document.getElementById("container"));

// --- Option ---------------------------------------------------------------
chart.setOption({
  animation: false,
  backgroundColor: "transparent",
  title: {
    text: "stock-event-flags · javascript · echarts · anyplot.ai",
    left: "center",
    textStyle: { color: t.ink, fontSize: 22 },
  },
  legend: {
    top: 46,
    data: ["Price", "Earnings", "Dividend", "Split", "News"],
    textStyle: { color: t.inkSoft, fontSize: 14 },
    itemWidth: 16,
    itemHeight: 10,
  },
  grid: { left: 90, right: 60, top: 130, bottom: 80 },
  xAxis: {
    type: "category",
    data: axisLabels,
    boundaryGap: true,
    axisLabel: { color: t.inkSoft, fontSize: 14, interval: "auto" },
    axisLine: { lineStyle: { color: t.inkSoft } },
    axisTick: { show: false },
    splitLine: { show: false },
  },
  yAxis: {
    type: "value",
    min: Math.floor(lowerLane - pricePad * 2),
    max: Math.ceil(upperLane + pricePad * 2),
    axisLabel: { color: t.inkSoft, fontSize: 14, formatter: "${value}" },
    axisLine: { show: false },
    axisTick: { show: false },
    splitLine: { lineStyle: { color: t.grid } },
  },
  tooltip: { trigger: "item" },
  series: [
    {
      name: "Price",
      type: "candlestick",
      data: candles,
      itemStyle: {
        color: t.palette[0], // bullish (close > open) — brand green, finance semantic
        color0: t.palette[4], // bearish (close < open) — matte red, finance semantic
        borderColor: t.palette[0],
        borderColor0: t.palette[4],
      },
    },
    ...eventSeries,
  ],
});
Runnable source as JSON, for any HTTP client: https://api.anyplot.ai/specs/stock-event-flags/echarts/code. Any spec id and library id listed in llms-full.txt fit the same URL shape; every URL below is complete and callable.
{
  "spec_id": "stock-event-flags",
  "language": "javascript",
  "library": "echarts",
  "page": "https://anyplot.ai/stock-event-flags/javascript/echarts",
  "hub": "https://anyplot.ai/stock-event-flags",
  "code_json": "https://api.anyplot.ai/specs/stock-event-flags/echarts/code",
  "spec_json": "https://api.anyplot.ai/specs/stock-event-flags",
  "render_light_png": "https://storage.googleapis.com/anyplot-images/plots/stock-event-flags/javascript/echarts/plot-light.png",
  "render_dark_png": "https://storage.googleapis.com/anyplot-images/plots/stock-event-flags/javascript/echarts/plot-dark.png",
  "interactive_light_html": "https://storage.googleapis.com/anyplot-images/plots/stock-event-flags/javascript/echarts/plot-light.html",
  "interactive_dark_html": "https://storage.googleapis.com/anyplot-images/plots/stock-event-flags/javascript/echarts/plot-dark.html",
  "quality_score": 92.0,
  "license": "MIT",
  "guide": "https://anyplot.ai/llms.txt"
}
Part of Stock Chart with Event Flags on anyplot.ai.