The same plot in 14 other libraries — JavaScript: Chart.js, D3.js, Apache ECharts, Highcharts; Python: Altair, Bokeh, lets-plot, Matplotlib, Plotly, plotnine, Pygal, Seaborn; R: ggplot2; Julia: Makie.jl. Compare all 15 side by side: Stock Chart with Event Flags in Python, R, Julia and JavaScript.
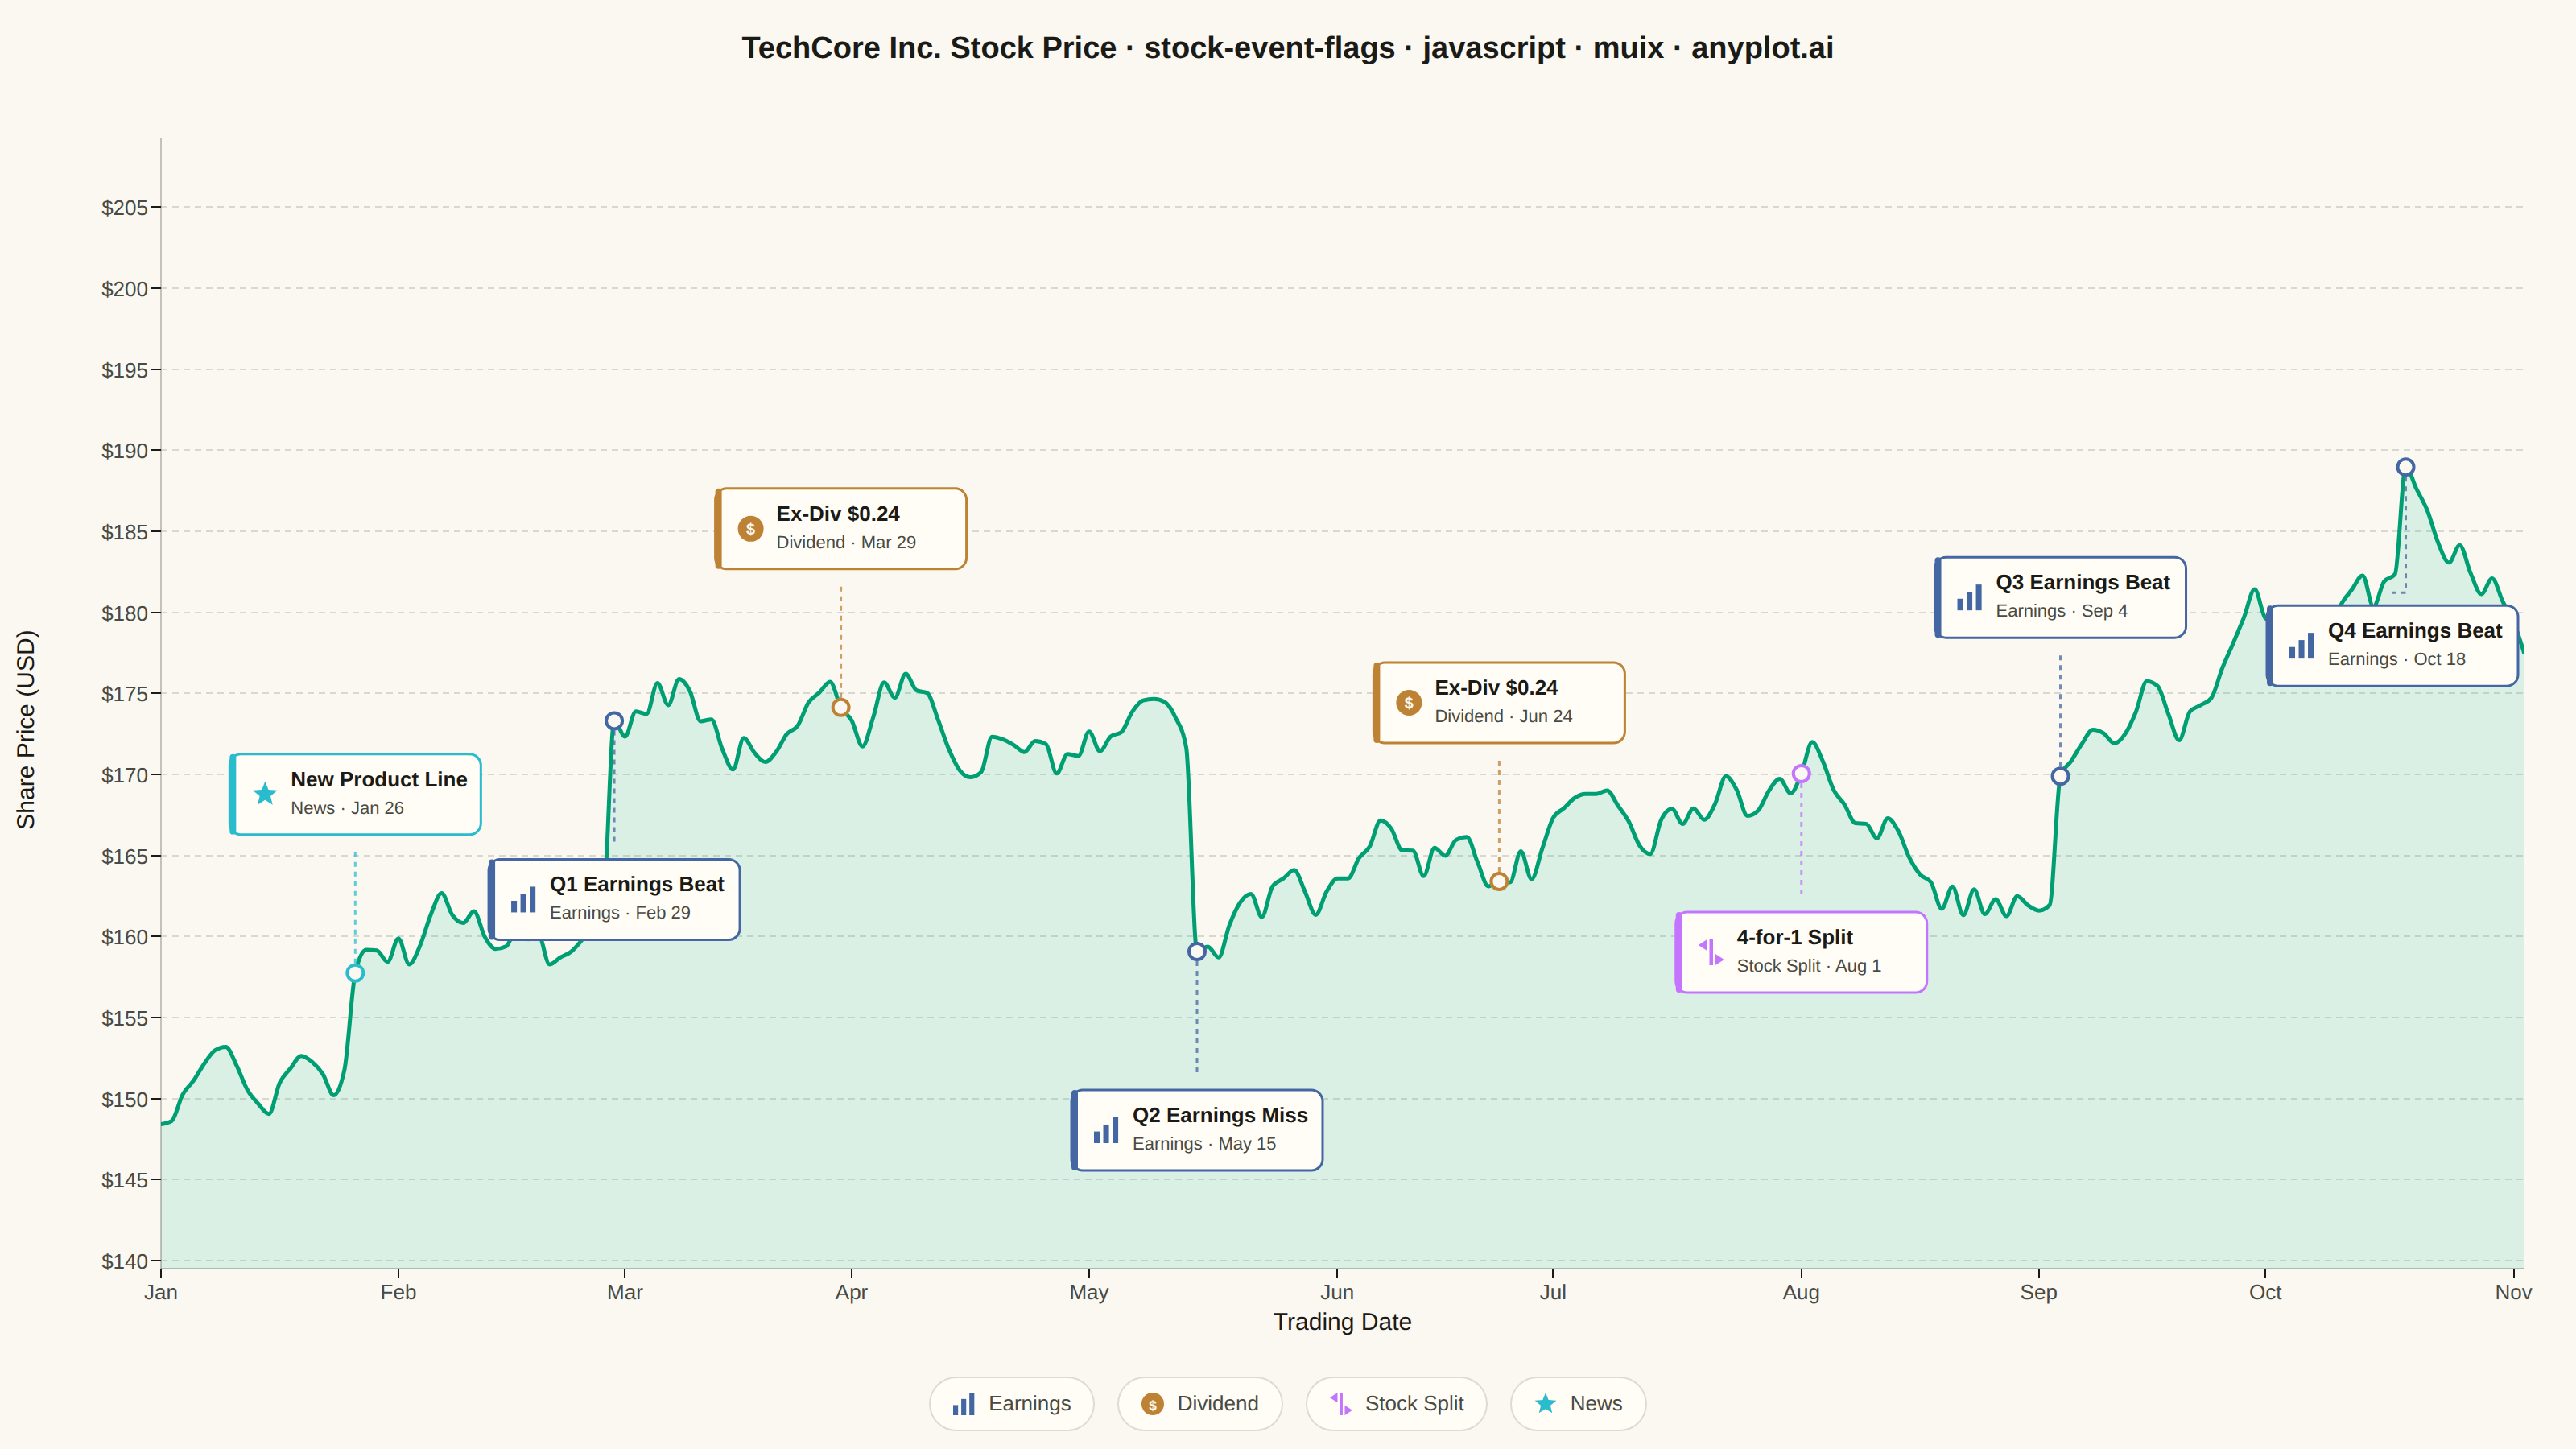
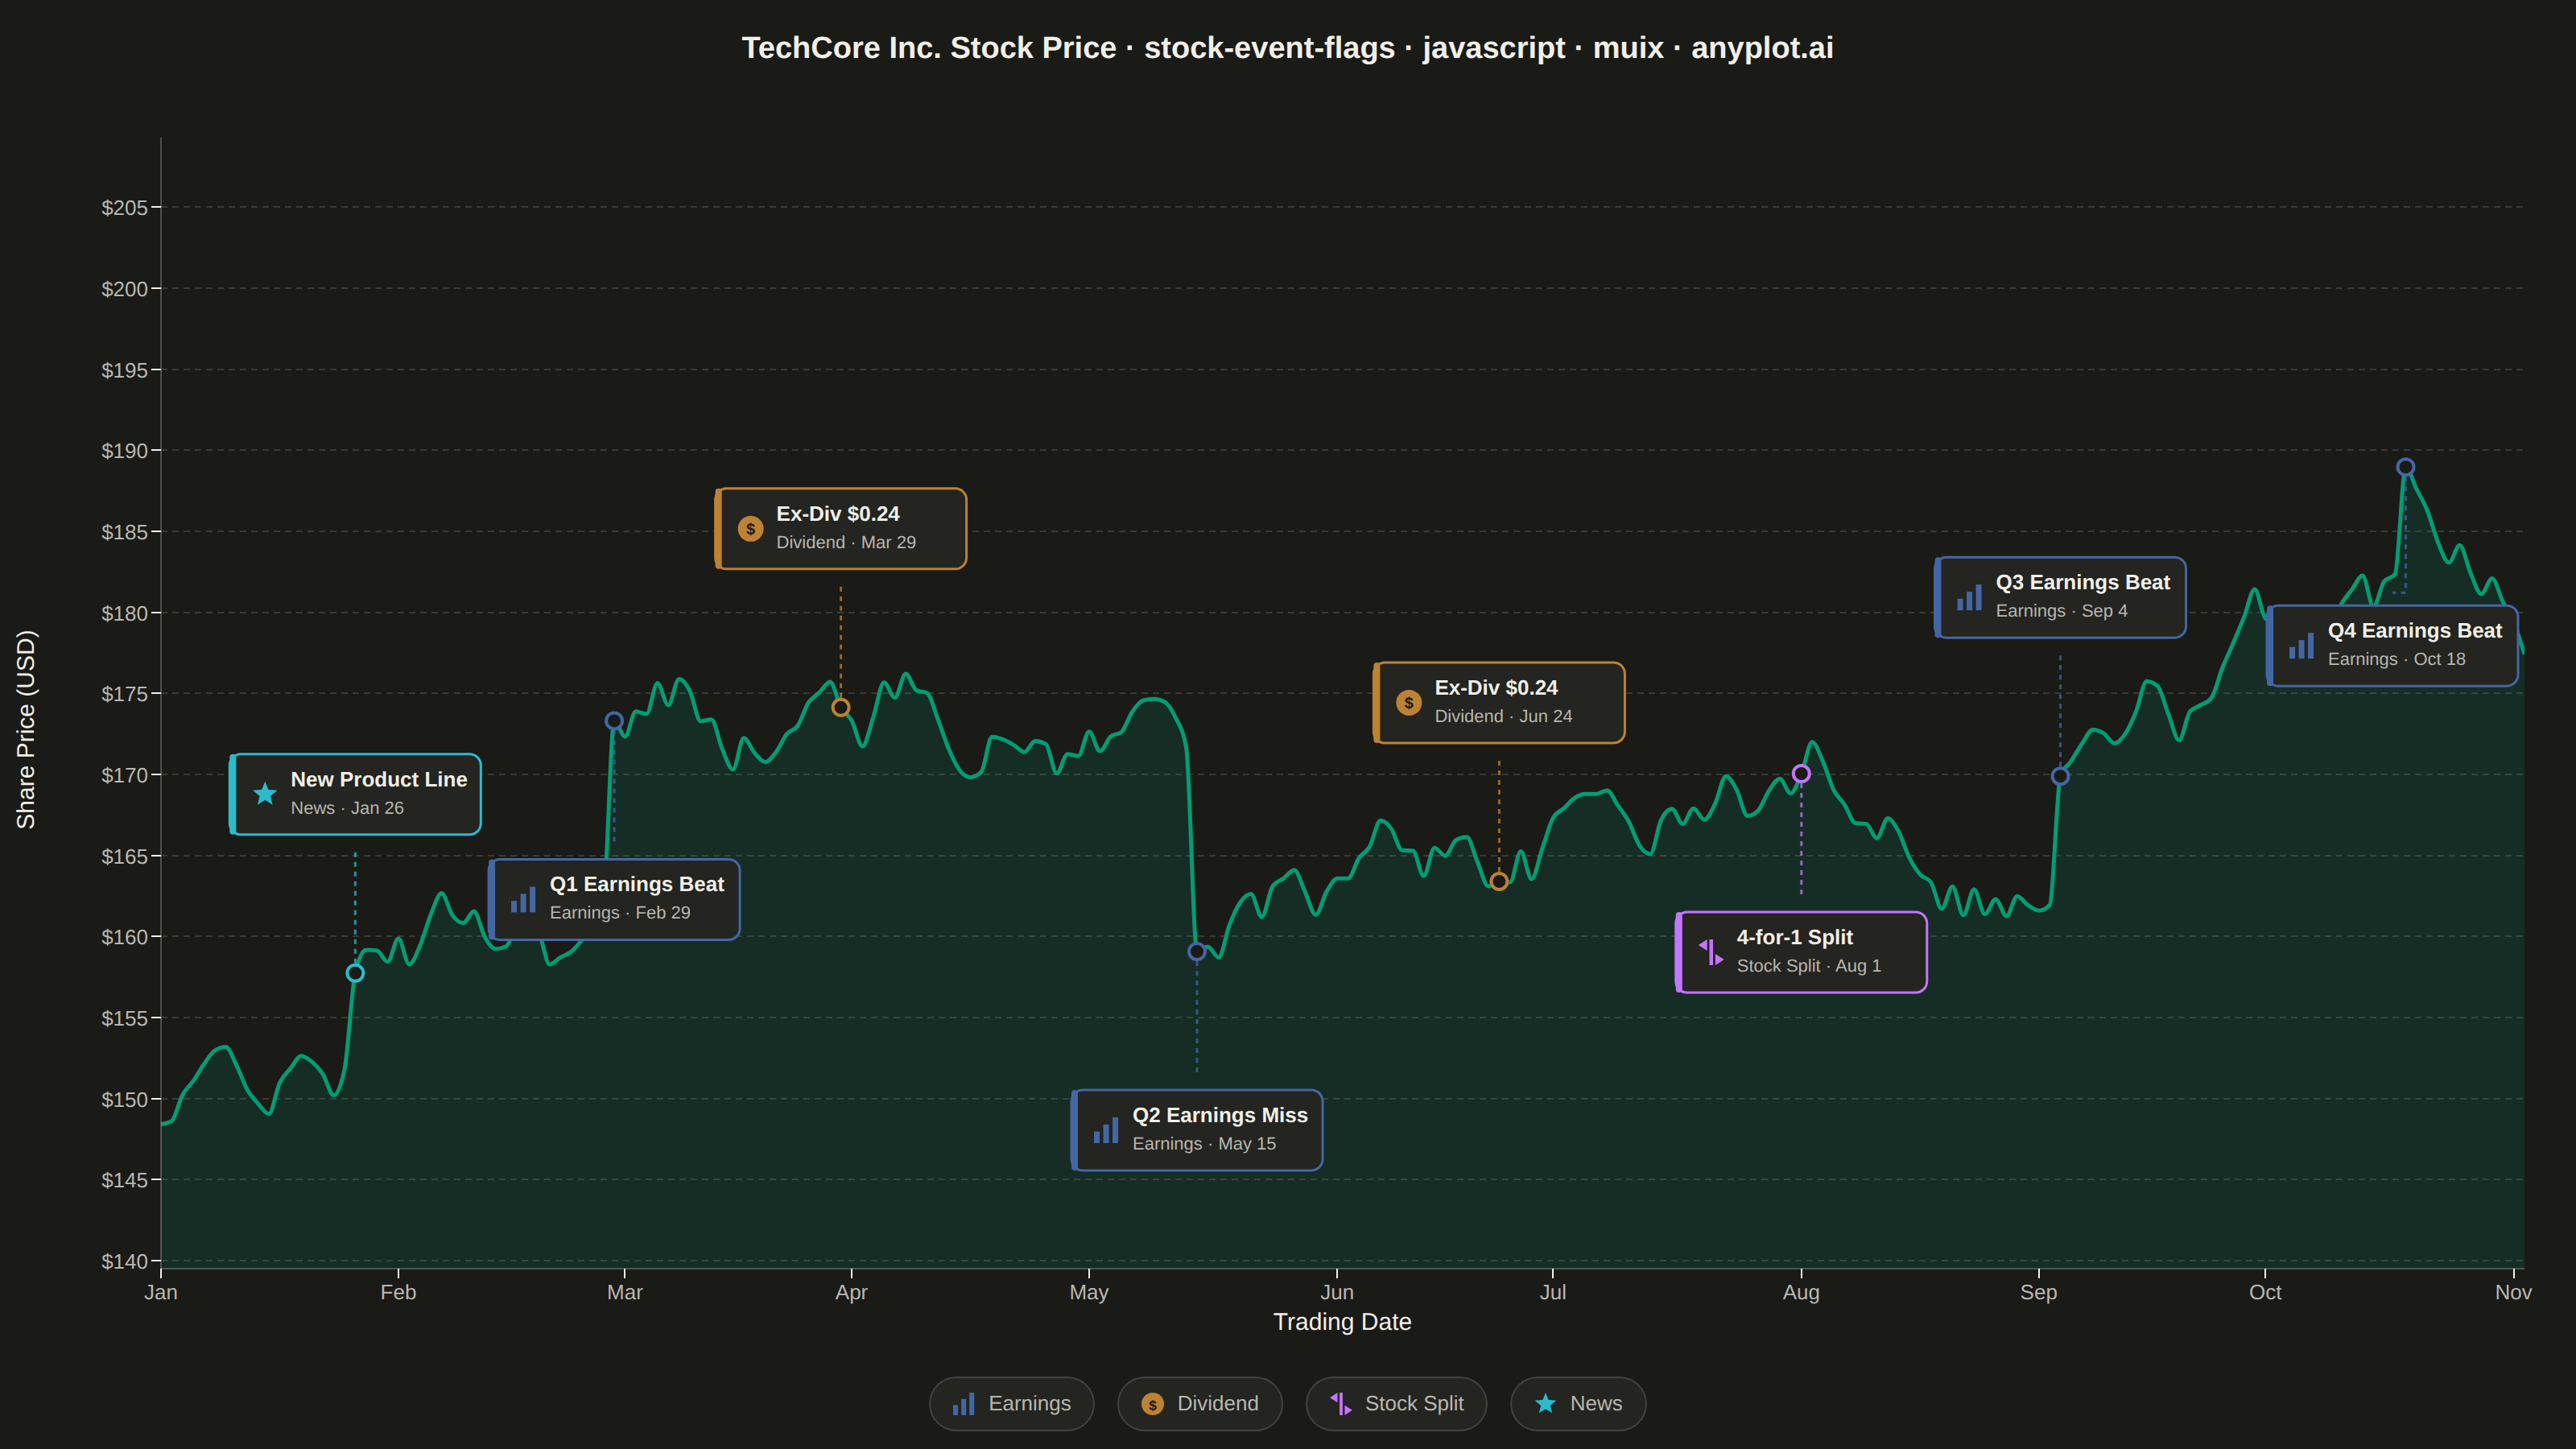
A stock price chart with flag-style markers annotating significant events such as earnings releases, dividends, stock splits, or news events. Unlike simple line annotations, flags are positioned above or below the price data with connector lines and styled icons that distinguish event types. This visualization is standard in financial trading platforms, enabling investors to correlate price movements with corporate actions and market events at a glance.
// anyplot.ai
// stock-event-flags: Stock Chart with Event Flags
// Library: muix 7.29.1 | JavaScript 22.23.2
// Quality: 93/100 | Created: 2026-08-26
import { LineChart } from "@mui/x-charts/LineChart";
import { useXScale, useYScale, useDrawingArea } from "@mui/x-charts/hooks";
import Box from "@mui/material/Box";
import Typography from "@mui/material/Typography";

const t = window.ANYPLOT_TOKENS;

// --- Data (in-memory, deterministic LCG PRNG — no fetch, no Math.random) ----
let seed = 42;
function rand() {
  seed = (seed * 1103515245 + 12345) & 0x7fffffff;
  return seed / 0x7fffffff;
}

const TRADING_DAYS = 220; // ~10.5 months of weekday sessions
const tradingDates: Date[] = [];
{
  const cursor = new Date(2024, 0, 2); // Tue Jan 2, 2024
  while (tradingDates.length < TRADING_DAYS) {
    const weekday = cursor.getDay();
    if (weekday !== 0 && weekday !== 6) tradingDates.push(new Date(cursor));
    cursor.setDate(cursor.getDate() + 1);
  }
}

// Corporate events across the year: quarterly earnings, ex-dividend dates,
// one stock split, and a product-launch news item. `priceShockPct` nudges
// that session's drift — earnings beats/misses move price the same day,
// dividends and splits do not (a split here is assumed already
// price-adjusted, as most historical series are).
const EVENTS = [
  { day: 18, type: "news", label: "New Product Line", priceShockPct: 0.03 },
  { day: 42, type: "earnings", label: "Q1 Earnings Beat", priceShockPct: 0.06 },
  { day: 63, type: "dividend", label: "Ex-Div $0.24", priceShockPct: 0 },
  { day: 96, type: "earnings", label: "Q2 Earnings Miss", priceShockPct: -0.07 },
  { day: 124, type: "dividend", label: "Ex-Div $0.24", priceShockPct: 0 },
  { day: 152, type: "split", label: "4-for-1 Split", priceShockPct: 0 },
  { day: 176, type: "earnings", label: "Q3 Earnings Beat", priceShockPct: 0.05 },
  { day: 208, type: "earnings", label: "Q4 Earnings Beat", priceShockPct: 0.04 },
];
const shockByDay = new Map(EVENTS.map((e) => [e.day, e.priceShockPct]));

const closePrices: number[] = [];
let price = 148; // opening share price (USD)
for (let i = 0; i < TRADING_DAYS; i++) {
  const drift = 0.0009; // gentle upward bias across the year
  const noise = (rand() - 0.5) * 0.024;
  const shock = shockByDay.get(i) ?? 0;
  price = Math.max(20, price * (1 + drift + noise + shock));
  closePrices.push(price);
}

// One tick per calendar month keeps the point-scale x-axis legible instead
// of a tick for every one of the 220 trading days.
const monthStartIndices = new Set<number>();
{
  let lastMonth = -1;
  tradingDates.forEach((d, i) => {
    if (d.getMonth() !== lastMonth) {
      monthStartIndices.add(i);
      lastMonth = d.getMonth();
    }
  });
}

const minClose = Math.min(...closePrices);
const maxClose = Math.max(...closePrices);
const closeRange = maxClose - minClose;
const Y_MIN = minClose - closeRange * 0.22;
const Y_MAX = maxClose + closeRange * 0.5; // headroom for flags pointing up

// Event-type palette, distinct from the brand-green price line. Each type
// also gets its own icon shape (below) so color isn't the only cue.
const EVENT_COLOR: Record<string, string> = {
  earnings: t.palette[2], // blue
  dividend: t.palette[3], // ochre — money association
  split: t.palette[1], // lavender
  news: t.palette[5], // cyan
};
const EVENT_TYPE_LABEL: Record<string, string> = {
  earnings: "Earnings",
  dividend: "Dividend",
  split: "Stock Split",
  news: "News",
};

function EventIcon({ type, color, size }: { type: string; color: string; size: number }) {
  const s = size;
  if (type === "earnings") {
    return (
      <g>
        <rect x={0} y={s * 0.55} width={s * 0.22} height={s * 0.45} fill={color} />
        <rect x={s * 0.36} y={s * 0.28} width={s * 0.22} height={s * 0.72} fill={color} />
        <rect x={s * 0.72} y={0} width={s * 0.22} height={s} fill={color} />
      </g>
    );
  }
  if (type === "dividend") {
    return (
      <g>
        <circle cx={s / 2} cy={s / 2} r={s / 2} fill={color} />
        <text x={s / 2} y={s / 2 + 1} textAnchor="middle" dominantBaseline="central" fontSize={s * 0.62} fontWeight={700} fill={t.pageBg}>
          $
        </text>
      </g>
    );
  }
  if (type === "split") {
    return (
      <g>
        <line x1={s / 2} y1={0} x2={s / 2} y2={s} stroke={color} strokeWidth={s * 0.14} />
        <polygon points={`0,${s * 0.22} ${s * 0.34},0 ${s * 0.34},${s * 0.44}`} fill={color} />
        <polygon points={`${s},${s * 0.78} ${s * 0.66},${s} ${s * 0.66},${s * 0.56}`} fill={color} />
      </g>
    );
  }
  // news — a five-point star
  const cx = s / 2;
  const cy = s / 2;
  const outerR = s / 2;
  const innerR = s * 0.22;
  const pts: string[] = [];
  for (let i = 0; i < 10; i++) {
    const r = i % 2 === 0 ? outerR : innerR;
    const angle = (Math.PI / 5) * i - Math.PI / 2;
    pts.push(`${cx + r * Math.cos(angle)},${cy + r * Math.sin(angle)}`);
  }
  return <polygon points={pts.join(" ")} fill={color} />;
}

// --- Event flags: MUI X community has no native annotation-flag primitive
// — draw against the shared xAxis/yAxis scale via useXScale/useYScale, the
// documented ChartContainer/LineChart composition pattern for marks outside
// the community surface. Flags alternate above/below the price line so
// nearby events don't collide, connect back to their exact trading day with
// a dashed pole, and get an elbow segment when the box has to be nudged in
// from the plot edge.
function EventFlags() {
  const xScale = useXScale() as any;
  const yScale = useYScale() as any;
  const drawingArea = useDrawingArea();
  if (!xScale || !yScale) return null;

  const boxW = 156;
  const boxH = 50;
  const poleLen = 78;
  const iconSize = 16;

  return (
    <g>
      {EVENTS.map((event, i) => {
        const x = xScale(tradingDates[event.day]);
        const y = yScale(closePrices[event.day]);
        const up = i % 2 === 0;
        const anchorY = up ? y - poleLen : y + poleLen;
        const boxY = up ? anchorY - boxH - 8 : anchorY + 8;
        const clampedBoxY = Math.min(Math.max(boxY, drawingArea.top + 4), drawingArea.top + drawingArea.height - boxH - 4);
        const boxCenterX = Math.min(
          Math.max(x, drawingArea.left + boxW / 2 + 4),
          drawingArea.left + drawingArea.width - boxW / 2 - 4,
        );
        const boxX = boxCenterX - boxW / 2;
        const color = EVENT_COLOR[event.type];

        return (
          <g key={`${event.day}-${event.type}`}>
            <line x1={x} y1={y} x2={x} y2={anchorY} stroke={color} strokeWidth={1.5} strokeDasharray="3 3" strokeOpacity={0.75} />
            {boxCenterX !== x && (
              <line x1={x} y1={anchorY} x2={boxCenterX} y2={anchorY} stroke={color} strokeWidth={1.5} strokeDasharray="3 3" strokeOpacity={0.75} />
            )}
            <circle cx={x} cy={y} r={5} fill={t.pageBg} stroke={color} strokeWidth={2} />

            <rect x={boxX} y={clampedBoxY} width={boxW} height={boxH} rx={7} fill={t.elevatedBg} stroke={color} strokeWidth={1.5} />
            <rect x={boxX} y={clampedBoxY} width={4} height={boxH} rx={2} fill={color} />
            <g transform={`translate(${boxX + 14}, ${clampedBoxY + boxH / 2 - iconSize / 2})`}>
              <EventIcon type={event.type} color={color} size={iconSize} />
            </g>
            <text x={boxX + 14 + iconSize + 8} y={clampedBoxY + boxH * 0.4} fontSize={13} fontWeight={600} fill={t.ink}>
              {event.label}
            </text>
            <text x={boxX + 14 + iconSize + 8} y={clampedBoxY + boxH * 0.74} fontSize={11} fill={t.inkSoft}>
              {EVENT_TYPE_LABEL[event.type]} · {tradingDates[event.day].toLocaleDateString("en-US", { month: "short", day: "numeric" })}
            </text>
          </g>
        );
      })}
    </g>
  );
}

const TITLE = "TechCore Inc. Stock Price · stock-event-flags · javascript · muix · anyplot.ai";

// --- Chart (default-exported component — the harness mounts it) -----------
export default function Chart() {
  const W = window.ANYPLOT_SIZE.width;
  const H = window.ANYPLOT_SIZE.height;
  const titleSize = TITLE.length > 67 ? Math.max(14, Math.round((22 * 67) / TITLE.length)) : 22;

  const TITLE_H = 62;
  const LEGEND_H = 56;
  const chartH = H - TITLE_H - LEGEND_H;
  // MUI X's y-axis `label` offsets itself from a hardcoded tickFontSize guess
  // rather than the tick labels' real measured width, so a "$205"-wide axis
  // collides with it. A hand-rotated label in its own flex column sidesteps
  // that and gives predictable, collision-free spacing.
  const yLabelWidth = 34;
  const chartW = W - yLabelWidth;

  const legendTypes = ["earnings", "dividend", "split", "news"];

  return (
    <Box
      sx={{
        width: W,
        height: H,
        bgcolor: t.pageBg,
        display: "flex",
        flexDirection: "column",
        fontFamily: "'Roboto', 'Helvetica Neue', Arial, sans-serif",
        boxSizing: "border-box",
      }}
    >
      <Box sx={{ height: TITLE_H, display: "flex", alignItems: "center", justifyContent: "center" }}>
        <Typography sx={{ color: t.ink, fontSize: titleSize, fontWeight: 600 }}>{TITLE}</Typography>
      </Box>

      <Box sx={{ display: "flex", flexDirection: "row", height: chartH }}>
        <Box sx={{ width: yLabelWidth, display: "flex", alignItems: "center", justifyContent: "center" }}>
          <Typography sx={{ fontSize: 15, color: t.ink, whiteSpace: "nowrap", transform: "rotate(-90deg)" }}>
            Share Price (USD)
          </Typography>
        </Box>
        <LineChart
          width={chartW}
          height={chartH}
          skipAnimation
          series={[
            {
              id: "close",
              data: closePrices,
              showMark: false,
              area: true,
              color: t.palette[0],
              valueFormatter: (v: number | null) => (v == null ? "" : `$${v.toFixed(2)}`),
            },
          ]}
          xAxis={[
            {
              data: tradingDates,
              scaleType: "point",
              label: "Trading Date",
              valueFormatter: (d: Date) => d.toLocaleDateString("en-US", { month: "short" }),
              tickInterval: (_value: Date, index: number) => monthStartIndices.has(index),
              tickLabelStyle: { fontSize: 13, fill: t.inkSoft },
              labelStyle: { fontSize: 15, fill: t.ink },
            },
          ]}
          yAxis={[
            {
              min: Y_MIN,
              max: Y_MAX,
              valueFormatter: (v: number) => `$${Math.round(v)}`,
              tickLabelStyle: { fontSize: 13, fill: t.inkSoft },
            },
          ]}
          grid={{ horizontal: true }}
          slotProps={{ legend: { hidden: true } }}
          margin={{ top: 24, right: 32, bottom: 56, left: 66 }}
          sx={{
            "& .MuiLineElement-root": { strokeWidth: 2.5 },
            "& .MuiAreaElement-root": { fillOpacity: 0.12 },
            "& .MuiChartsAxis-line": { stroke: t.inkSoft, strokeOpacity: 0.25 },
            "& .MuiChartsGrid-line": { stroke: t.grid, strokeDasharray: "4 3" },
          }}
        >
          <EventFlags />
        </LineChart>
      </Box>

      <Box sx={{ height: LEGEND_H, display: "flex", alignItems: "center", justifyContent: "center", gap: "14px" }}>
        {legendTypes.map((type) => (
          <Box
            key={type}
            sx={{
              display: "flex",
              alignItems: "center",
              gap: "8px",
              padding: "6px 14px",
              borderRadius: "999px",
              border: `1px solid ${t.grid}`,
              bgcolor: t.elevatedBg,
            }}
          >
            <svg width={14} height={14} viewBox="0 0 14 14">
              <EventIcon type={type} color={EVENT_COLOR[type]} size={14} />
            </svg>
            <Typography sx={{ color: t.inkSoft, fontSize: 13, fontWeight: 500 }}>{EVENT_TYPE_LABEL[type]}</Typography>
          </Box>
        ))}
      </Box>
    </Box>
  );
}
Runnable source as JSON, for any HTTP client: https://api.anyplot.ai/specs/stock-event-flags/muix/code. Any spec id and library id listed in llms-full.txt fit the same URL shape; every URL below is complete and callable.
{
  "spec_id": "stock-event-flags",
  "language": "javascript",
  "library": "muix",
  "page": "https://anyplot.ai/stock-event-flags/javascript/muix",
  "hub": "https://anyplot.ai/stock-event-flags",
  "code_json": "https://api.anyplot.ai/specs/stock-event-flags/muix/code",
  "spec_json": "https://api.anyplot.ai/specs/stock-event-flags",
  "render_light_png": "https://storage.googleapis.com/anyplot-images/plots/stock-event-flags/javascript/muix/plot-light.png",
  "render_dark_png": "https://storage.googleapis.com/anyplot-images/plots/stock-event-flags/javascript/muix/plot-dark.png",
  "interactive_light_html": "https://storage.googleapis.com/anyplot-images/plots/stock-event-flags/javascript/muix/plot-light.html",
  "interactive_dark_html": "https://storage.googleapis.com/anyplot-images/plots/stock-event-flags/javascript/muix/plot-dark.html",
  "quality_score": 93.0,
  "license": "MIT",
  "guide": "https://anyplot.ai/llms.txt"
}
Part of Stock Chart with Event Flags on anyplot.ai.