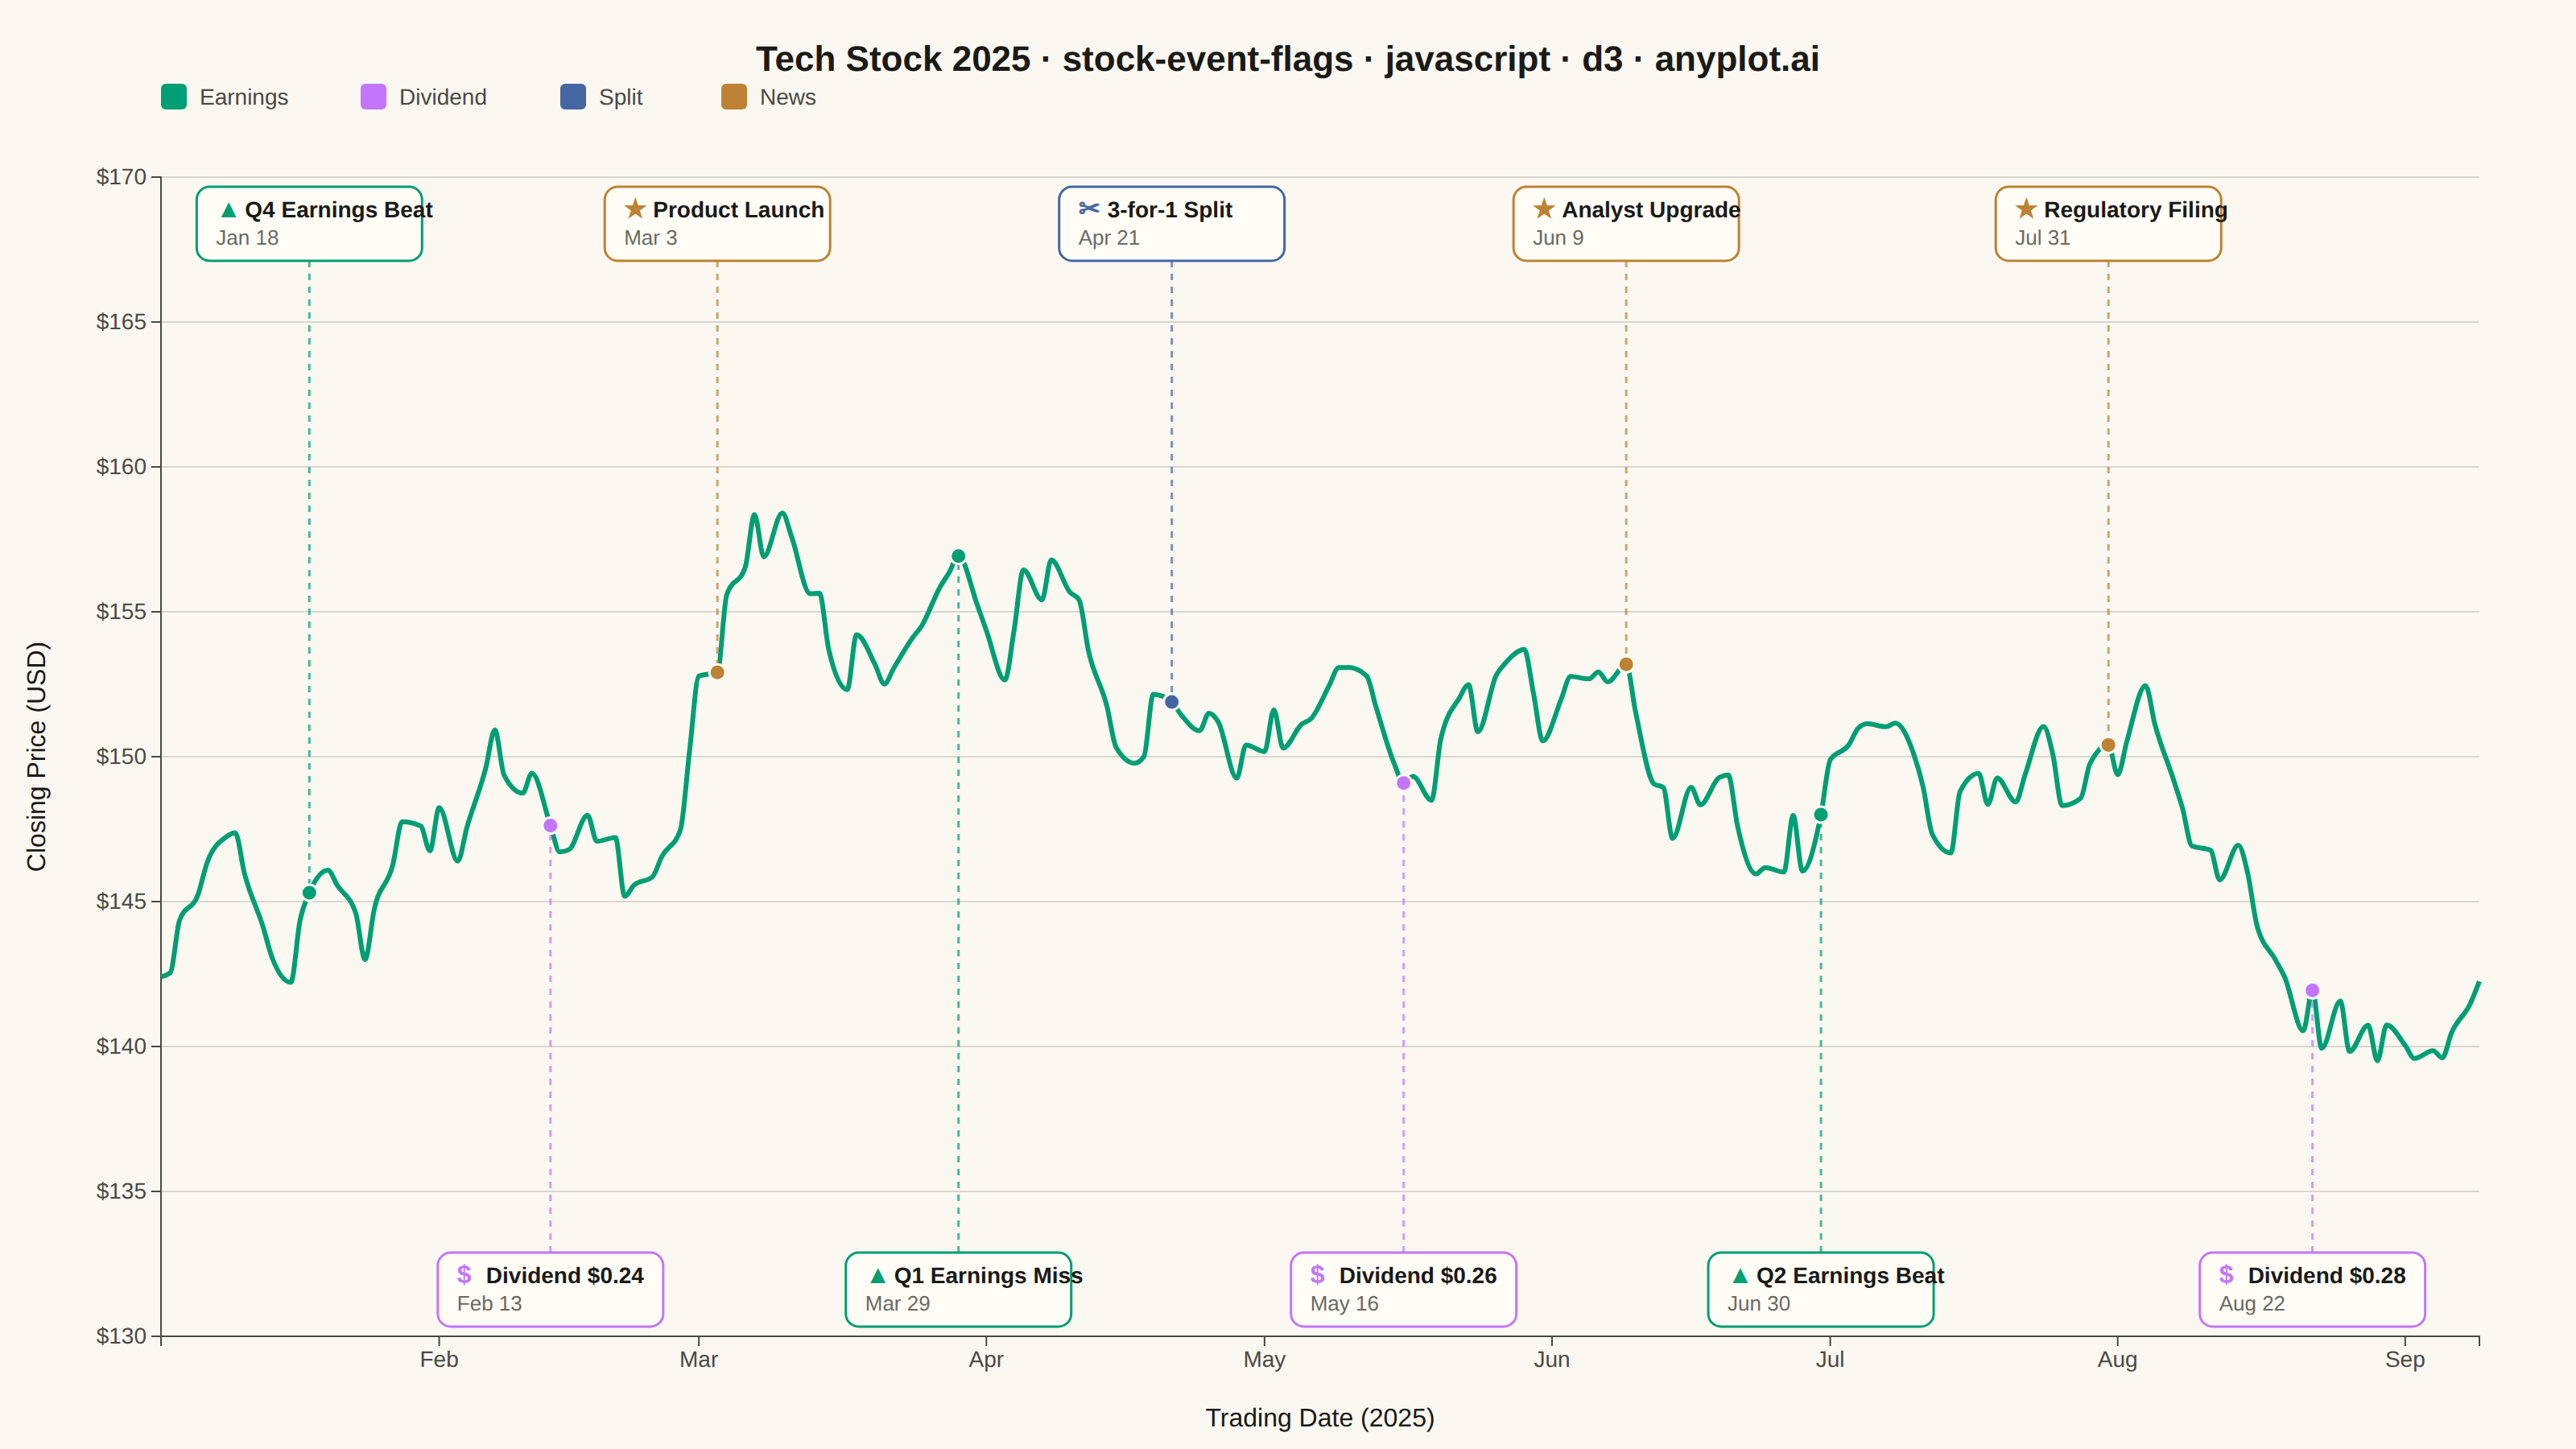
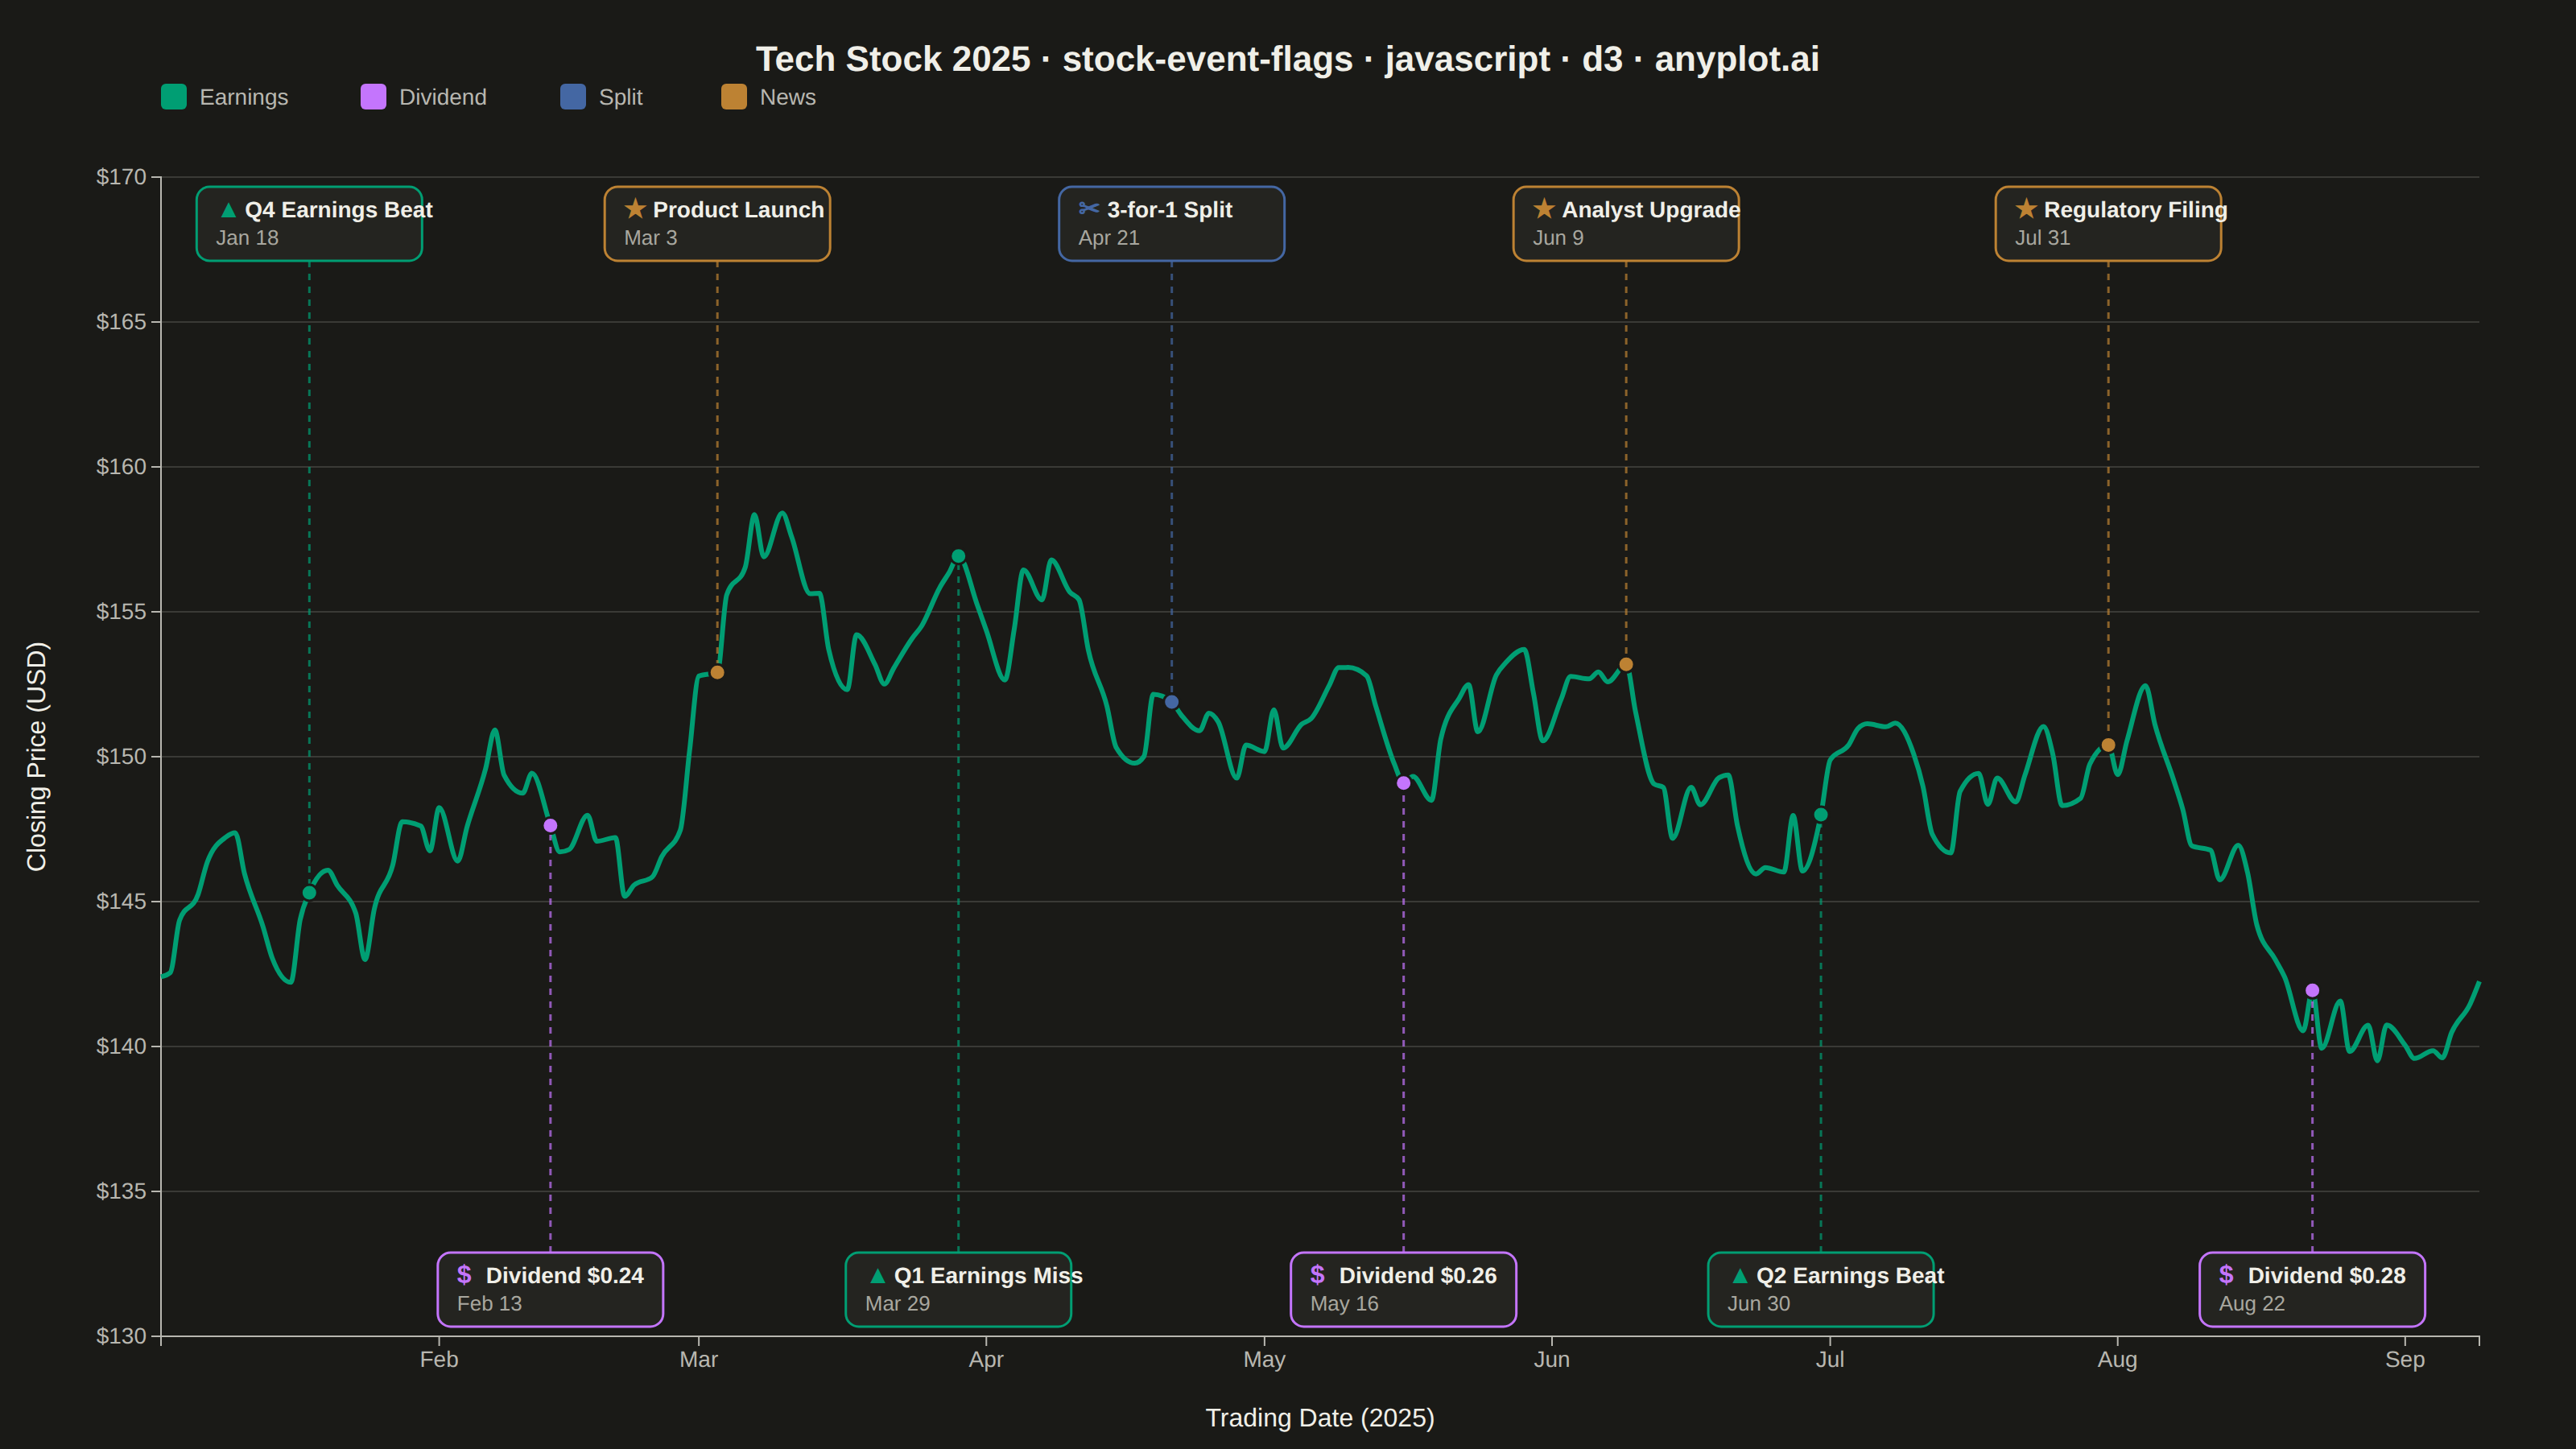
The same plot in 14 other libraries — JavaScript: Chart.js, Apache ECharts, Highcharts, MUI X Charts; Python: Altair, Bokeh, lets-plot, Matplotlib, Plotly, plotnine, Pygal, Seaborn; R: ggplot2; Julia: Makie.jl. Compare all 15 side by side: Stock Chart with Event Flags in Python, R, Julia and JavaScript.
A stock price chart with flag-style markers annotating significant events such as earnings releases, dividends, stock splits, or news events. Unlike simple line annotations, flags are positioned above or below the price data with connector lines and styled icons that distinguish event types. This visualization is standard in financial trading platforms, enabling investors to correlate price movements with corporate actions and market events at a glance.
// anyplot.ai
// stock-event-flags: Stock Chart with Event Flags
// Library: d3 7.9.0 | JavaScript 22.23.2
// Quality: 92/100 | Created: 2026-08-26

const t = window.ANYPLOT_TOKENS;
const inkMuted = t.theme === "light" ? "#6B6A63" : "#A8A79F";
const { width, height } = window.ANYPLOT_SIZE;
const margin = { top: 110, right: 60, bottom: 70, left: 100 };
const iw = width - margin.left - margin.right;
const ih = height - margin.top - margin.bottom;

// --- Data: deterministic LCG (no seeded Math.random in the browser) --------
let seed = 42;
function rand() {
  seed = (seed * 1103515245 + 12345) & 0x7fffffff;
  return seed / 0x7fffffff;
}

const TRADING_DAYS = 180;
const startDate = new Date(Date.UTC(2025, 0, 2));
const dates = [];
for (let i = 0; i < TRADING_DAYS; i++) {
  const d = new Date(startDate);
  d.setUTCDate(d.getUTCDate() + Math.floor((i / 5) * 7));
  dates.push(d);
}

let price = 142;
const closes = dates.map((_, i) => {
  const drift = 0.06;
  const shock = (rand() - 0.5) * 4.2;
  const bump = i > 40 && i < 46 ? 6 : i > 110 && i < 116 ? -5 : 0;
  price = Math.max(60, price + drift + shock + bump * 0.2);
  return price;
});

const priceData = dates.map((date, i) => ({ date, close: closes[i] }));

const events = [
  { dayIndex: 12, type: "earnings", label: "Q4 Earnings Beat" },
  { dayIndex: 30, type: "dividend", label: "Dividend $0.24" },
  { dayIndex: 43, type: "news", label: "Product Launch" },
  { dayIndex: 62, type: "earnings", label: "Q1 Earnings Miss" },
  { dayIndex: 78, type: "split", label: "3-for-1 Split" },
  { dayIndex: 96, type: "dividend", label: "Dividend $0.26" },
  { dayIndex: 113, type: "news", label: "Analyst Upgrade" },
  { dayIndex: 128, type: "earnings", label: "Q2 Earnings Beat" },
  { dayIndex: 150, type: "news", label: "Regulatory Filing" },
  { dayIndex: 166, type: "dividend", label: "Dividend $0.28" },
].map((e, i) => ({
  ...e,
  date: dates[e.dayIndex],
  close: closes[e.dayIndex],
  side: i % 2 === 0 ? "up" : "down",
}));

// Event-type -> Imprint categorical color, canonical palette order (0-3)
const EVENT_COLOR = {
  earnings: t.palette[0],
  dividend: t.palette[1],
  split: t.palette[2],
  news: t.palette[3],
};
const EVENT_SYMBOL = {
  earnings: "▲", // triangle — reporting event
  dividend: "$",
  split: "✂", // scissors — split
  news: "★", // star — news/analyst
};

// --- SVG mount --------------------------------------------------------------
const svg = d3.select("#container").append("svg").attr("width", width).attr("height", height);
const g = svg.append("g").attr("transform", `translate(${margin.left},${margin.top})`);

// --- Scales -------------------------------------------------------------------
const x = d3.scaleTime().domain(d3.extent(dates)).range([0, iw]);
const yMin = d3.min(closes) - 8;
const yMax = d3.max(closes) + 8;
const y = d3.scaleLinear().domain([yMin, yMax]).nice().range([ih, 0]);

// --- Gridlines (y only) -------------------------------------------------------
g.append("g")
  .attr("class", "grid")
  .call(d3.axisLeft(y).tickSize(-iw).tickFormat(""))
  .selectAll("line")
  .attr("stroke", t.grid);
g.select(".grid .domain").remove();

// --- Axes ---------------------------------------------------------------------
const xAxis = g
  .append("g")
  .attr("transform", `translate(0,${ih})`)
  .call(d3.axisBottom(x).ticks(d3.timeMonth.every(1)).tickFormat(d3.timeFormat("%b")));
const yAxis = g.append("g").call(d3.axisLeft(y).tickFormat((v) => `$${v.toFixed(0)}`));
for (const ax of [xAxis, yAxis]) {
  ax.selectAll("text").attr("fill", t.inkSoft).style("font-size", "14px");
  ax.selectAll("line").attr("stroke", t.inkSoft);
  ax.select(".domain").attr("stroke", t.inkSoft);
}

// --- Axis labels ----------------------------------------------------------
g.append("text")
  .attr("x", iw / 2)
  .attr("y", ih + 56)
  .attr("text-anchor", "middle")
  .attr("fill", t.ink)
  .style("font-size", "16px")
  .text("Trading Date (2025)");
g.append("text")
  .attr("transform", "rotate(-90)")
  .attr("x", -ih / 2)
  .attr("y", -72)
  .attr("text-anchor", "middle")
  .attr("fill", t.ink)
  .style("font-size", "16px")
  .text("Closing Price (USD)");

// --- Price line -----------------------------------------------------------
const line = d3
  .line()
  .x((d) => x(d.date))
  .y((d) => y(d.close))
  .curve(d3.curveMonotoneX);

g.append("path")
  .datum(priceData)
  .attr("fill", "none")
  .attr("stroke", t.palette[0])
  .attr("stroke-width", 3)
  .attr("d", line);

// --- Event flags: connector, marker at price, flag box above/below --------
// Flags sit in two fixed lanes at the top/bottom of the plot area (alternating
// by event index) so they never obscure the price line; a dashed connector
// ties each flag to its exact date/price on the line.
const FLAG_W = 140;
const FLAG_H = 46;
const LANE_UP_TOP = 6;
const LANE_DOWN_TOP = ih - FLAG_H - 6;
const flagLayer = g.append("g").attr("class", "event-flags");

const flagGroups = flagLayer
  .selectAll("g.flag")
  .data(events)
  .join("g")
  .attr("class", "flag");

// Vertical dashed connector from flag to price point
flagGroups
  .append("line")
  .attr("x1", (d) => x(d.date))
  .attr("x2", (d) => x(d.date))
  .attr("y1", (d) => (d.side === "up" ? LANE_UP_TOP + FLAG_H : LANE_DOWN_TOP))
  .attr("y2", (d) => y(d.close))
  .attr("stroke", (d) => EVENT_COLOR[d.type])
  .attr("stroke-width", 1.5)
  .attr("stroke-dasharray", "4,4")
  .attr("opacity", 0.7);

// Marker dot at the price/date intersection
flagGroups
  .append("circle")
  .attr("cx", (d) => x(d.date))
  .attr("cy", (d) => y(d.close))
  .attr("r", 5)
  .attr("fill", (d) => EVENT_COLOR[d.type])
  .attr("stroke", t.pageBg)
  .attr("stroke-width", 1.5);

// Flag box (rounded rect + icon + label) in the top or bottom lane
flagGroups.each(function (d) {
  const fg = d3.select(this);
  const boxY = d.side === "up" ? LANE_UP_TOP : LANE_DOWN_TOP;
  fg
    .append("rect")
    .attr("x", -FLAG_W / 2)
    .attr("y", boxY)
    .attr("width", FLAG_W)
    .attr("height", FLAG_H)
    .attr("rx", 8)
    .attr("fill", t.elevatedBg)
    .attr("stroke", EVENT_COLOR[d.type])
    .attr("stroke-width", 1.5)
    .attr("transform", `translate(${x(d.date)},0)`);
  fg
    .append("text")
    .attr("x", -FLAG_W / 2 + 12)
    .attr("y", boxY + 19)
    .attr("fill", EVENT_COLOR[d.type])
    .style("font-size", "16px")
    .style("font-weight", "700")
    .text(EVENT_SYMBOL[d.type])
    .attr("transform", `translate(${x(d.date)},0)`);
  fg
    .append("text")
    .attr("x", -FLAG_W / 2 + 30)
    .attr("y", boxY + 19)
    .attr("fill", t.ink)
    .style("font-size", "14px")
    .style("font-weight", "600")
    .text(d.label)
    .attr("transform", `translate(${x(d.date)},0)`);
  fg
    .append("text")
    .attr("x", -FLAG_W / 2 + 12)
    .attr("y", boxY + 36)
    .attr("fill", inkMuted)
    .style("font-size", "13px")
    .text(d3.timeFormat("%b %-d")(d.date))
    .attr("transform", `translate(${x(d.date)},0)`);
});

// --- Legend (event-type color key) -----------------------------------------
const legendItems = [
  { type: "earnings", label: "Earnings" },
  { type: "dividend", label: "Dividend" },
  { type: "split", label: "Split" },
  { type: "news", label: "News" },
];
const legend = svg
  .append("g")
  .attr("transform", `translate(${margin.left}, ${margin.top - 58})`);
let lx = 0;
legendItems.forEach((item) => {
  const li = legend.append("g").attr("transform", `translate(${lx},0)`);
  li.append("rect")
    .attr("width", 16)
    .attr("height", 16)
    .attr("rx", 3)
    .attr("fill", EVENT_COLOR[item.type]);
  li.append("text")
    .attr("x", 24)
    .attr("y", 13)
    .attr("fill", t.inkSoft)
    .style("font-size", "14px")
    .text(item.label);
  lx += 24 + item.label.length * 8 + 36;
});

// --- Title ------------------------------------------------------------------
svg
  .append("text")
  .attr("x", width / 2)
  .attr("y", 44)
  .attr("text-anchor", "middle")
  .attr("fill", t.ink)
  .style("font-size", "22px")
  .style("font-weight", "600")
  .text("Tech Stock 2025 · stock-event-flags · javascript · d3 · anyplot.ai");
Runnable source as JSON, for any HTTP client: https://api.anyplot.ai/specs/stock-event-flags/d3/code. Any spec id and library id listed in llms-full.txt fit the same URL shape; every URL below is complete and callable.
{
  "spec_id": "stock-event-flags",
  "language": "javascript",
  "library": "d3",
  "page": "https://anyplot.ai/stock-event-flags/javascript/d3",
  "hub": "https://anyplot.ai/stock-event-flags",
  "code_json": "https://api.anyplot.ai/specs/stock-event-flags/d3/code",
  "spec_json": "https://api.anyplot.ai/specs/stock-event-flags",
  "render_light_png": "https://storage.googleapis.com/anyplot-images/plots/stock-event-flags/javascript/d3/plot-light.png",
  "render_dark_png": "https://storage.googleapis.com/anyplot-images/plots/stock-event-flags/javascript/d3/plot-dark.png",
  "interactive_light_html": "https://storage.googleapis.com/anyplot-images/plots/stock-event-flags/javascript/d3/plot-light.html",
  "interactive_dark_html": "https://storage.googleapis.com/anyplot-images/plots/stock-event-flags/javascript/d3/plot-dark.html",
  "quality_score": 92.0,
  "license": "MIT",
  "guide": "https://anyplot.ai/llms.txt"
}
Part of Stock Chart with Event Flags on anyplot.ai.