The same plot in 14 other libraries — JavaScript: D3.js, Apache ECharts, Highcharts, MUI X Charts; Python: Altair, Bokeh, lets-plot, Matplotlib, Plotly, plotnine, Pygal, Seaborn; R: ggplot2; Julia: Makie.jl. Compare all 15 side by side: Stock Chart with Event Flags in Python, R, Julia and JavaScript.
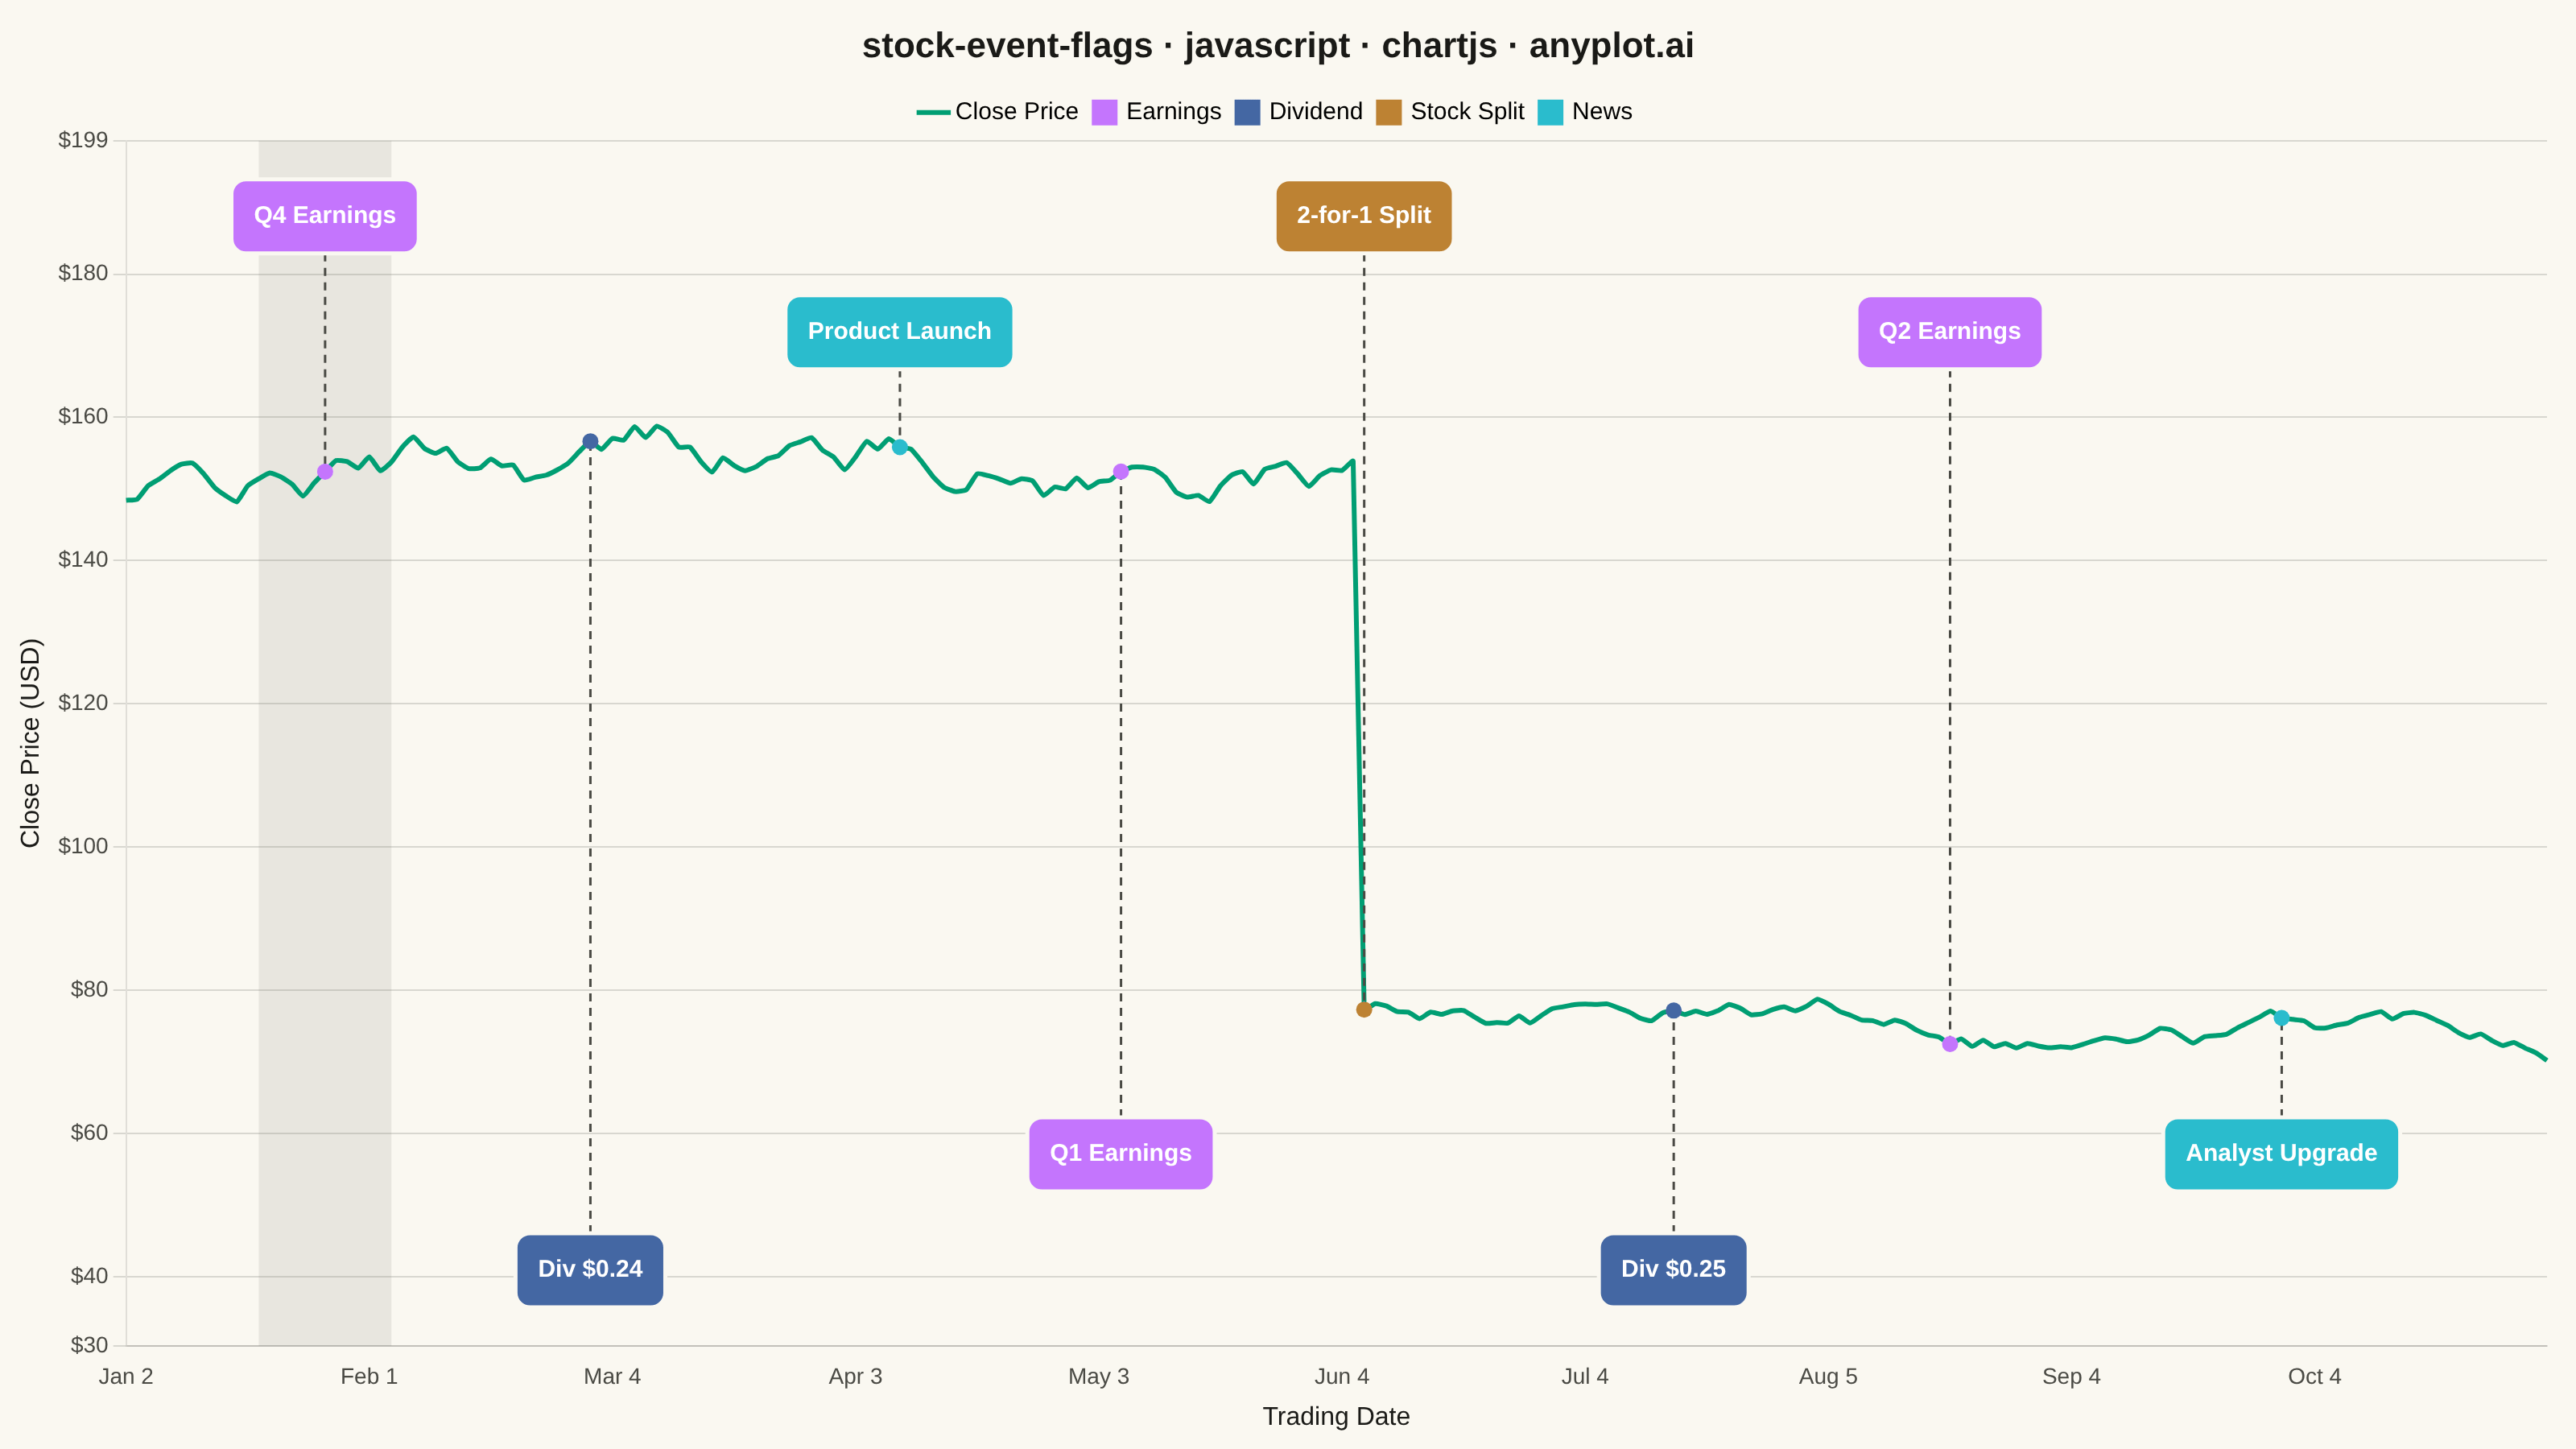
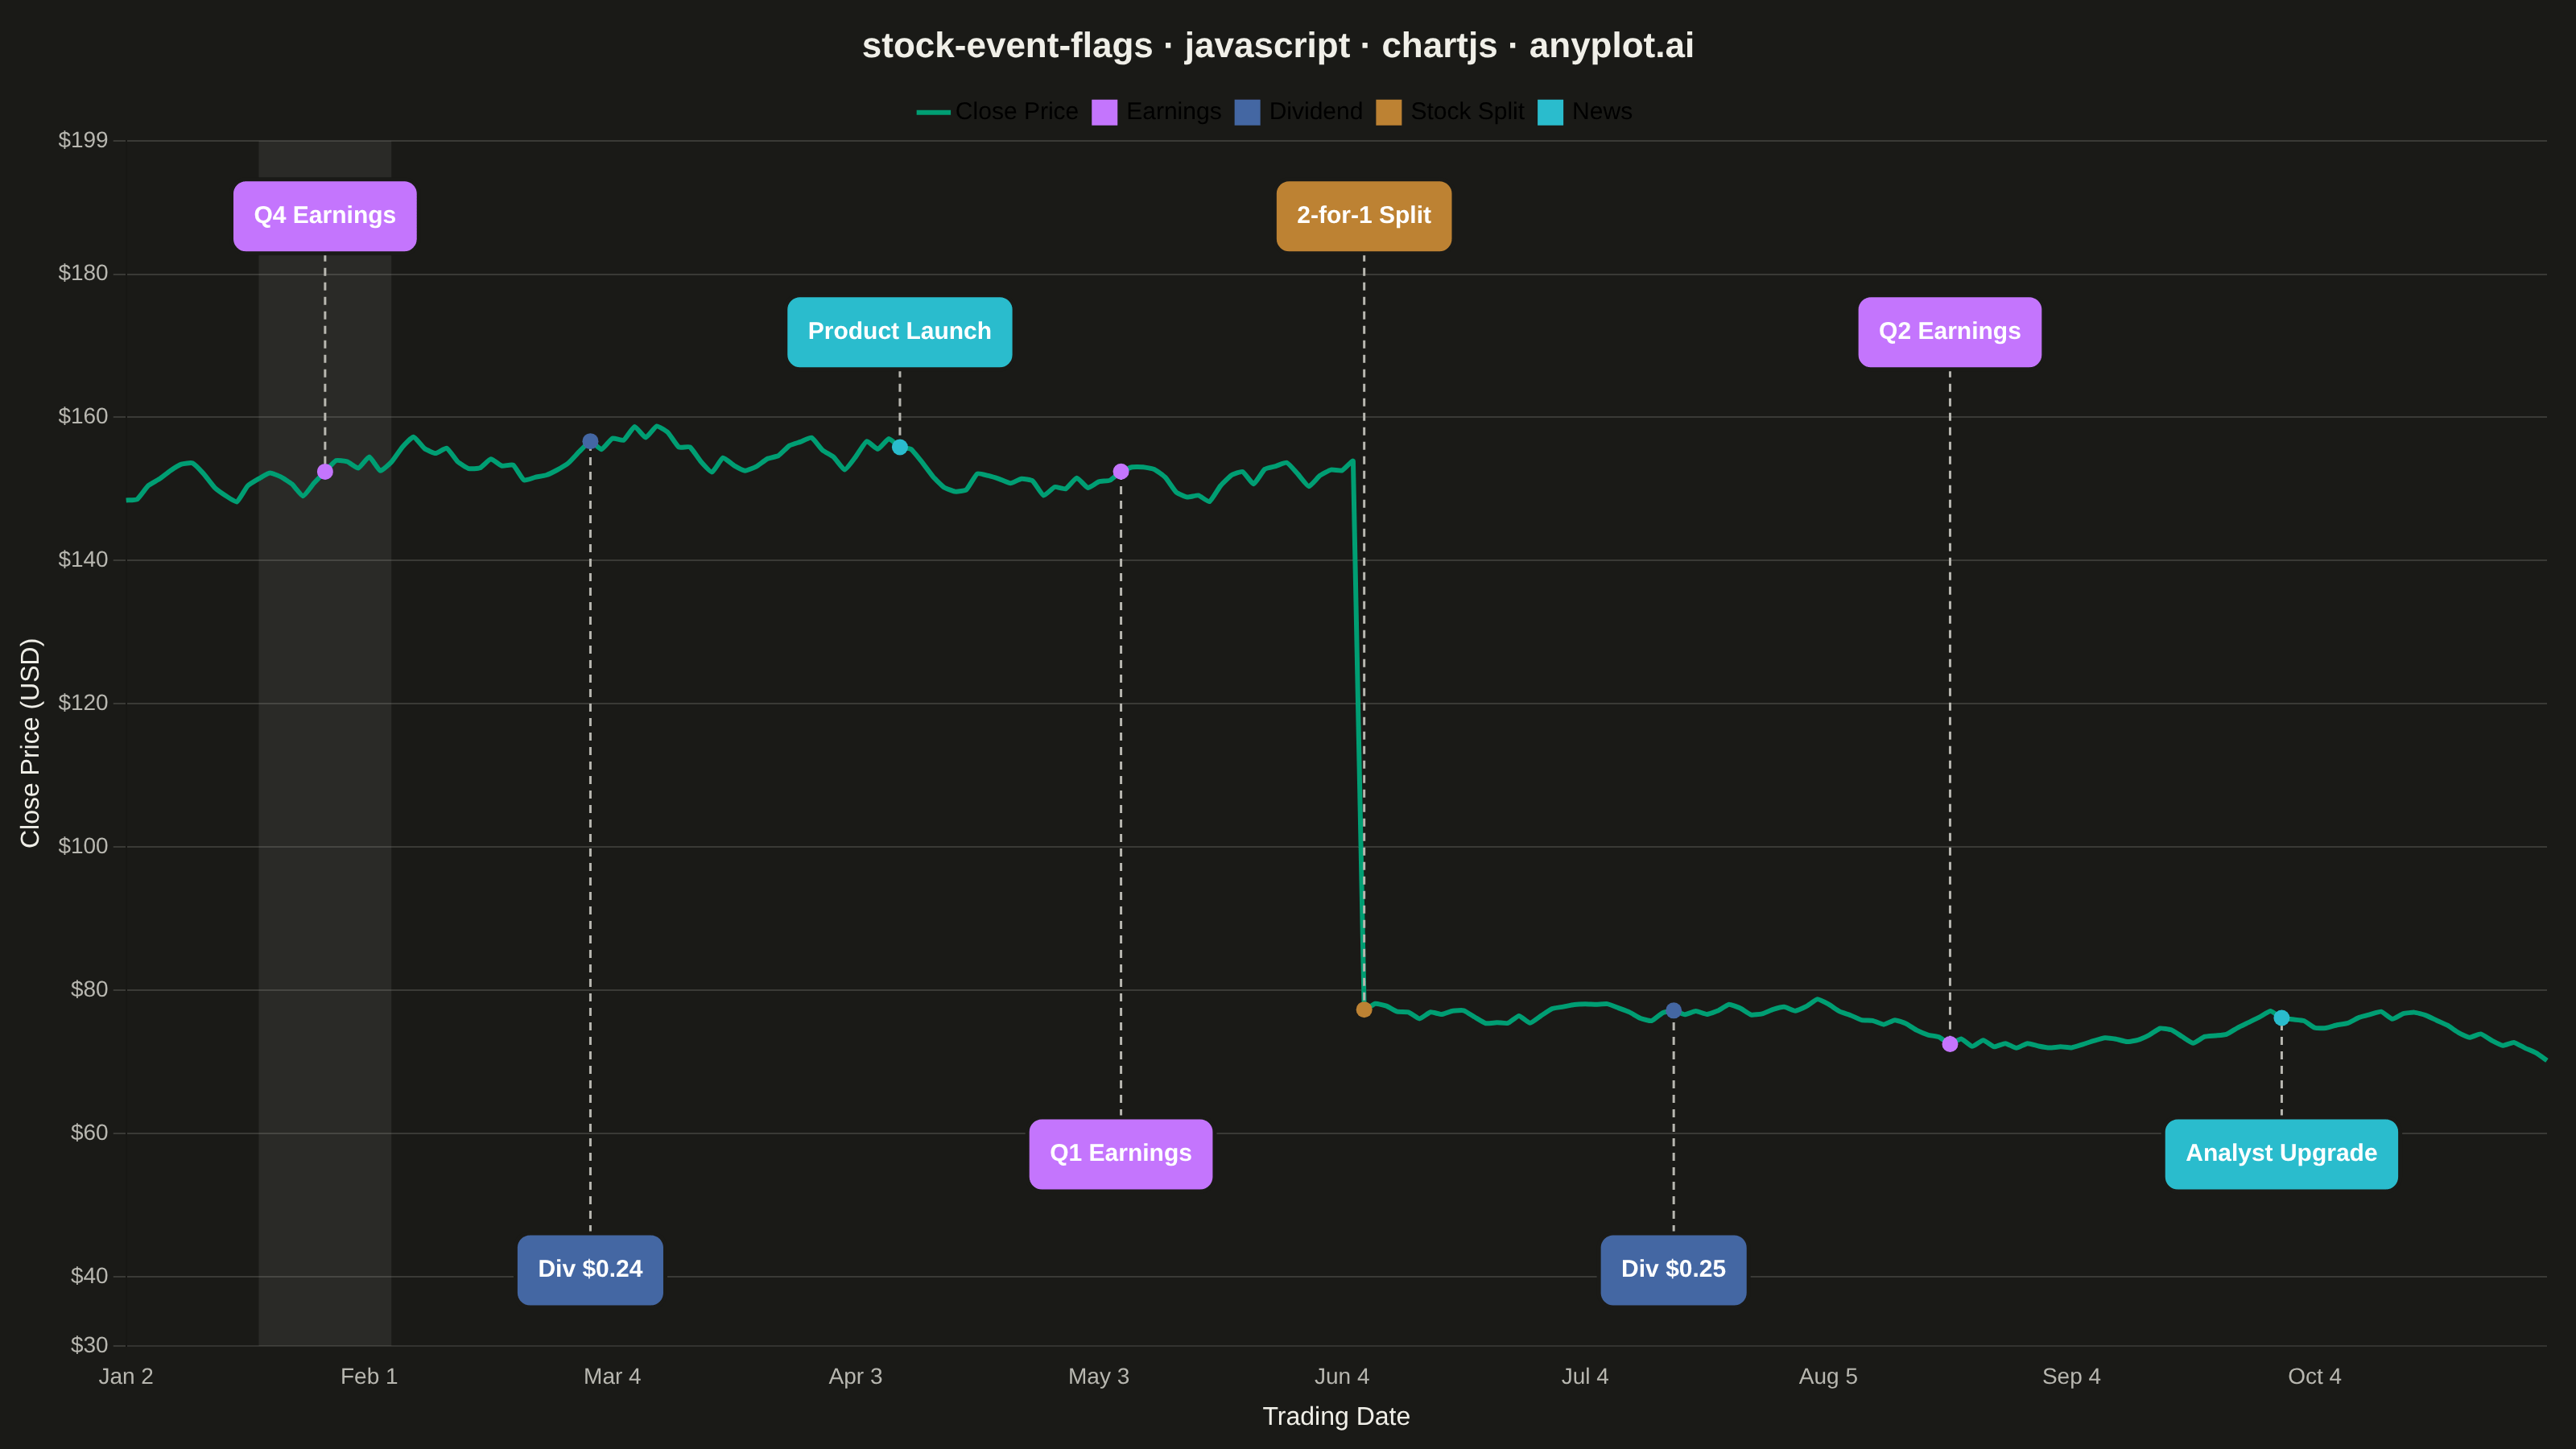
A stock price chart with flag-style markers annotating significant events such as earnings releases, dividends, stock splits, or news events. Unlike simple line annotations, flags are positioned above or below the price data with connector lines and styled icons that distinguish event types. This visualization is standard in financial trading platforms, enabling investors to correlate price movements with corporate actions and market events at a glance.
// anyplot.ai
// stock-event-flags: Stock Chart with Event Flags
// Library: chartjs 4.4.7 | JavaScript 22.23.2
// Quality: 93/100 | Created: 2026-08-26

const t = window.ANYPLOT_TOKENS;
const THEME = window.ANYPLOT_THEME === "dark" ? "dark" : "light";
const INK_MUTED = THEME === "dark" ? "#A8A79F" : "#6B6A63"; // tertiary text (theme-adaptive, not in token set)

// --- Data (in-memory, deterministic) ----------------------------------------
function lcg(seed) {
  let state = seed;
  return () => {
    state = (state * 1103515245 + 12345) % 2147483648;
    return state / 2147483648;
  };
}
const rand = lcg(42);

const TRADING_DAYS = 220;
const START_DATE = new Date(2024, 0, 2); // Jan 2, 2024

const dates = [];
const cursor = new Date(START_DATE);
while (dates.length < TRADING_DAYS) {
  const weekday = cursor.getDay();
  if (weekday !== 0 && weekday !== 6) dates.push(new Date(cursor));
  cursor.setDate(cursor.getDate() + 1);
}
const labels = dates.map((d) => d.toLocaleDateString("en-US", { month: "short", day: "numeric" }));

const SPLIT_INDEX = 112;
let price = 148;
const closePrices = [];
for (let i = 0; i < TRADING_DAYS; i++) {
  const shock = (rand() - 0.5) * 4.4;
  price = Math.max(24, price + shock + 0.06);
  closePrices.push(price);
}
// The 2-for-1 split roughly halves the nominal share price from that day on.
for (let i = SPLIT_INDEX; i < TRADING_DAYS; i++) closePrices[i] *= 0.5;
const roundedPrices = closePrices.map((p) => Number(p.toFixed(2)));

const EVENT_TYPES = {
  earnings: { label: "Earnings", color: t.palette[1] },
  dividend: { label: "Dividend", color: t.palette[2] },
  split: { label: "Stock Split", color: t.palette[3] },
  news: { label: "News", color: t.palette[5] },
};

const events = [
  { index: 18, type: "earnings", label: "Q4 Earnings" },
  { index: 42, type: "dividend", label: "Div $0.24" },
  { index: 70, type: "news", label: "Product Launch" },
  { index: 90, type: "earnings", label: "Q1 Earnings" },
  { index: SPLIT_INDEX, type: "split", label: "2-for-1 Split" },
  { index: 140, type: "dividend", label: "Div $0.25" },
  { index: 165, type: "earnings", label: "Q2 Earnings" },
  { index: 195, type: "news", label: "Analyst Upgrade" },
];
const BLACKOUT = { startIndex: 12, endIndex: 24 }; // pre-earnings blackout window

// --- Mount -------------------------------------------------------------------
const canvas = document.createElement("canvas");
document.getElementById("container").appendChild(canvas);

// --- Axis headroom for flags (reserved space above/below the price line) -----
const minPrice = Math.min(...roundedPrices);
const maxPrice = Math.max(...roundedPrices);
const priceRange = maxPrice - minPrice;
const yMin = minPrice - priceRange * 0.3;
const yMax = maxPrice + priceRange * 0.3;

// Sparse series carrying only the event points, at their exact price — an
// invisible dataset so the native Chart.js tooltip can surface event details
// on hover in the interactive HTML view (spec: "hover ... should reveal full
// event details"). Static PNG is unaffected since nothing is hovered mid-render.
const eventPoints = new Array(TRADING_DAYS).fill(null);
events.forEach((event) => {
  eventPoints[event.index] = roundedPrices[event.index];
});

function drawRoundRect(ctx, x, y, w, h, r) {
  ctx.beginPath();
  ctx.moveTo(x + r, y);
  ctx.arcTo(x + w, y, x + w, y + h, r);
  ctx.arcTo(x + w, y + h, x, y + h, r);
  ctx.arcTo(x, y + h, x, y, r);
  ctx.arcTo(x, y, x + w, y, r);
  ctx.closePath();
}

// --- Custom plugin: blackout band + event flags -------------------------------
const eventFlagsPlugin = {
  id: "eventFlags",
  beforeDatasetsDraw(chart) {
    const { ctx, chartArea, scales } = chart;
    const xStart = scales.x.getPixelForValue(BLACKOUT.startIndex);
    const xEnd = scales.x.getPixelForValue(BLACKOUT.endIndex);
    ctx.save();
    ctx.fillStyle = INK_MUTED;
    ctx.globalAlpha = 0.12;
    ctx.fillRect(xStart, chartArea.top, xEnd - xStart, chartArea.bottom - chartArea.top);
    ctx.restore();
  },
  afterDatasetsDraw(chart) {
    const { ctx, chartArea, scales } = chart;
    ctx.save();
    ctx.font = "600 15px sans-serif";
    ctx.textAlign = "center";
    ctx.textBaseline = "middle";

    events.forEach((event, i) => {
      const meta = EVENT_TYPES[event.type];
      const xPixel = scales.x.getPixelForValue(event.index);
      const priceY = scales.y.getPixelForValue(roundedPrices[event.index]);
      const up = i % 2 === 0;
      const far = Math.floor(i / 2) % 2 === 1;

      const flagW = ctx.measureText(event.label).width + 28;
      const flagH = 46;
      const offset = far ? 96 : 24;
      const flagY = up ? chartArea.top + offset : chartArea.bottom - offset - flagH;

      // Dashed connector down to the exact price level for that date.
      ctx.setLineDash([5, 4]);
      ctx.strokeStyle = t.inkSoft;
      ctx.lineWidth = 1.5;
      ctx.beginPath();
      ctx.moveTo(xPixel, up ? flagY + flagH : flagY);
      ctx.lineTo(xPixel, priceY);
      ctx.stroke();
      ctx.setLineDash([]);

      // Anchor dot at the price point.
      ctx.fillStyle = meta.color;
      ctx.beginPath();
      ctx.arc(xPixel, priceY, 5, 0, Math.PI * 2);
      ctx.fill();

      // Flag badge with event label.
      ctx.fillStyle = meta.color;
      ctx.strokeStyle = t.pageBg;
      ctx.lineWidth = 2.5;
      drawRoundRect(ctx, xPixel - flagW / 2, flagY, flagW, flagH, 9);
      ctx.fill();
      ctx.stroke();

      ctx.fillStyle = "#FFFFFF";
      ctx.fillText(event.label, xPixel, flagY + flagH / 2);
    });

    ctx.restore();
  },
};

// --- Chart ---------------------------------------------------------------
new Chart(canvas, {
  type: "line",
  data: {
    labels,
    datasets: [
      {
        label: "Close Price",
        data: roundedPrices,
        borderColor: t.palette[0],
        backgroundColor: t.palette[0],
        borderWidth: 3,
        pointRadius: 0,
        tension: 0.15,
        fill: false,
      },
      {
        label: "Event Detail",
        data: eventPoints,
        showLine: false,
        pointRadius: 0,
        pointHoverRadius: 9,
        pointHitRadius: 18,
        pointBackgroundColor: "transparent",
        pointBorderColor: "transparent",
      },
    ],
  },
  plugins: [eventFlagsPlugin],
  options: {
    responsive: true,
    maintainAspectRatio: false,
    animation: false,
    layout: { padding: { top: 6, bottom: 6, left: 6, right: 18 } },
    plugins: {
      title: {
        display: true,
        text: "stock-event-flags · javascript · chartjs · anyplot.ai",
        color: t.ink,
        font: { size: 22 },
      },
      tooltip: {
        callbacks: {
          label: (context) => {
            if (context.dataset.label === "Event Detail") {
              const event = events.find((e) => e.index === context.dataIndex);
              return event ? `${EVENT_TYPES[event.type].label}: ${event.label}` : "";
            }
            return `Close: $${context.parsed.y.toFixed(2)}`;
          },
        },
      },
      legend: {
        display: true,
        position: "top",
        onClick: () => {},
        labels: {
          color: t.ink,
          font: { size: 15 },
          usePointStyle: true,
          boxWidth: 12,
          generateLabels: () => [
            { text: "Close Price", fillStyle: t.palette[0], strokeStyle: t.palette[0], lineWidth: 3, pointStyle: "line" },
            { text: EVENT_TYPES.earnings.label, fillStyle: EVENT_TYPES.earnings.color, strokeStyle: EVENT_TYPES.earnings.color, pointStyle: "rect" },
            { text: EVENT_TYPES.dividend.label, fillStyle: EVENT_TYPES.dividend.color, strokeStyle: EVENT_TYPES.dividend.color, pointStyle: "rect" },
            { text: EVENT_TYPES.split.label, fillStyle: EVENT_TYPES.split.color, strokeStyle: EVENT_TYPES.split.color, pointStyle: "rect" },
            { text: EVENT_TYPES.news.label, fillStyle: EVENT_TYPES.news.color, strokeStyle: EVENT_TYPES.news.color, pointStyle: "rect" },
          ],
        },
      },
    },
    scales: {
      x: {
        ticks: { color: t.inkSoft, font: { size: 14 }, maxTicksLimit: 10, autoSkip: true },
        grid: { display: false },
        title: { display: true, text: "Trading Date", color: t.ink, font: { size: 16 } },
      },
      y: {
        min: yMin,
        max: yMax,
        ticks: {
          color: t.inkSoft,
          font: { size: 14 },
          callback: (value) => `$${value.toFixed(0)}`,
        },
        grid: { color: t.grid },
        title: { display: true, text: "Close Price (USD)", color: t.ink, font: { size: 16 } },
      },
    },
  },
});
Runnable source as JSON, for any HTTP client: https://api.anyplot.ai/specs/stock-event-flags/chartjs/code. Any spec id and library id listed in llms-full.txt fit the same URL shape; every URL below is complete and callable.
{
  "spec_id": "stock-event-flags",
  "language": "javascript",
  "library": "chartjs",
  "page": "https://anyplot.ai/stock-event-flags/javascript/chartjs",
  "hub": "https://anyplot.ai/stock-event-flags",
  "code_json": "https://api.anyplot.ai/specs/stock-event-flags/chartjs/code",
  "spec_json": "https://api.anyplot.ai/specs/stock-event-flags",
  "render_light_png": "https://storage.googleapis.com/anyplot-images/plots/stock-event-flags/javascript/chartjs/plot-light.png",
  "render_dark_png": "https://storage.googleapis.com/anyplot-images/plots/stock-event-flags/javascript/chartjs/plot-dark.png",
  "interactive_light_html": "https://storage.googleapis.com/anyplot-images/plots/stock-event-flags/javascript/chartjs/plot-light.html",
  "interactive_dark_html": "https://storage.googleapis.com/anyplot-images/plots/stock-event-flags/javascript/chartjs/plot-dark.html",
  "quality_score": 93.0,
  "license": "MIT",
  "guide": "https://anyplot.ai/llms.txt"
}
Part of Stock Chart with Event Flags on anyplot.ai.