The same plot in 14 other libraries — JavaScript: D3.js, Apache ECharts, Highcharts, MUI X Charts; Python: Altair, Bokeh, lets-plot, Matplotlib, Plotly, plotnine, Pygal, Seaborn; R: ggplot2; Julia: Makie.jl. Compare all 15 side by side: Basic Stream Graph in Python, R, Julia and JavaScript.
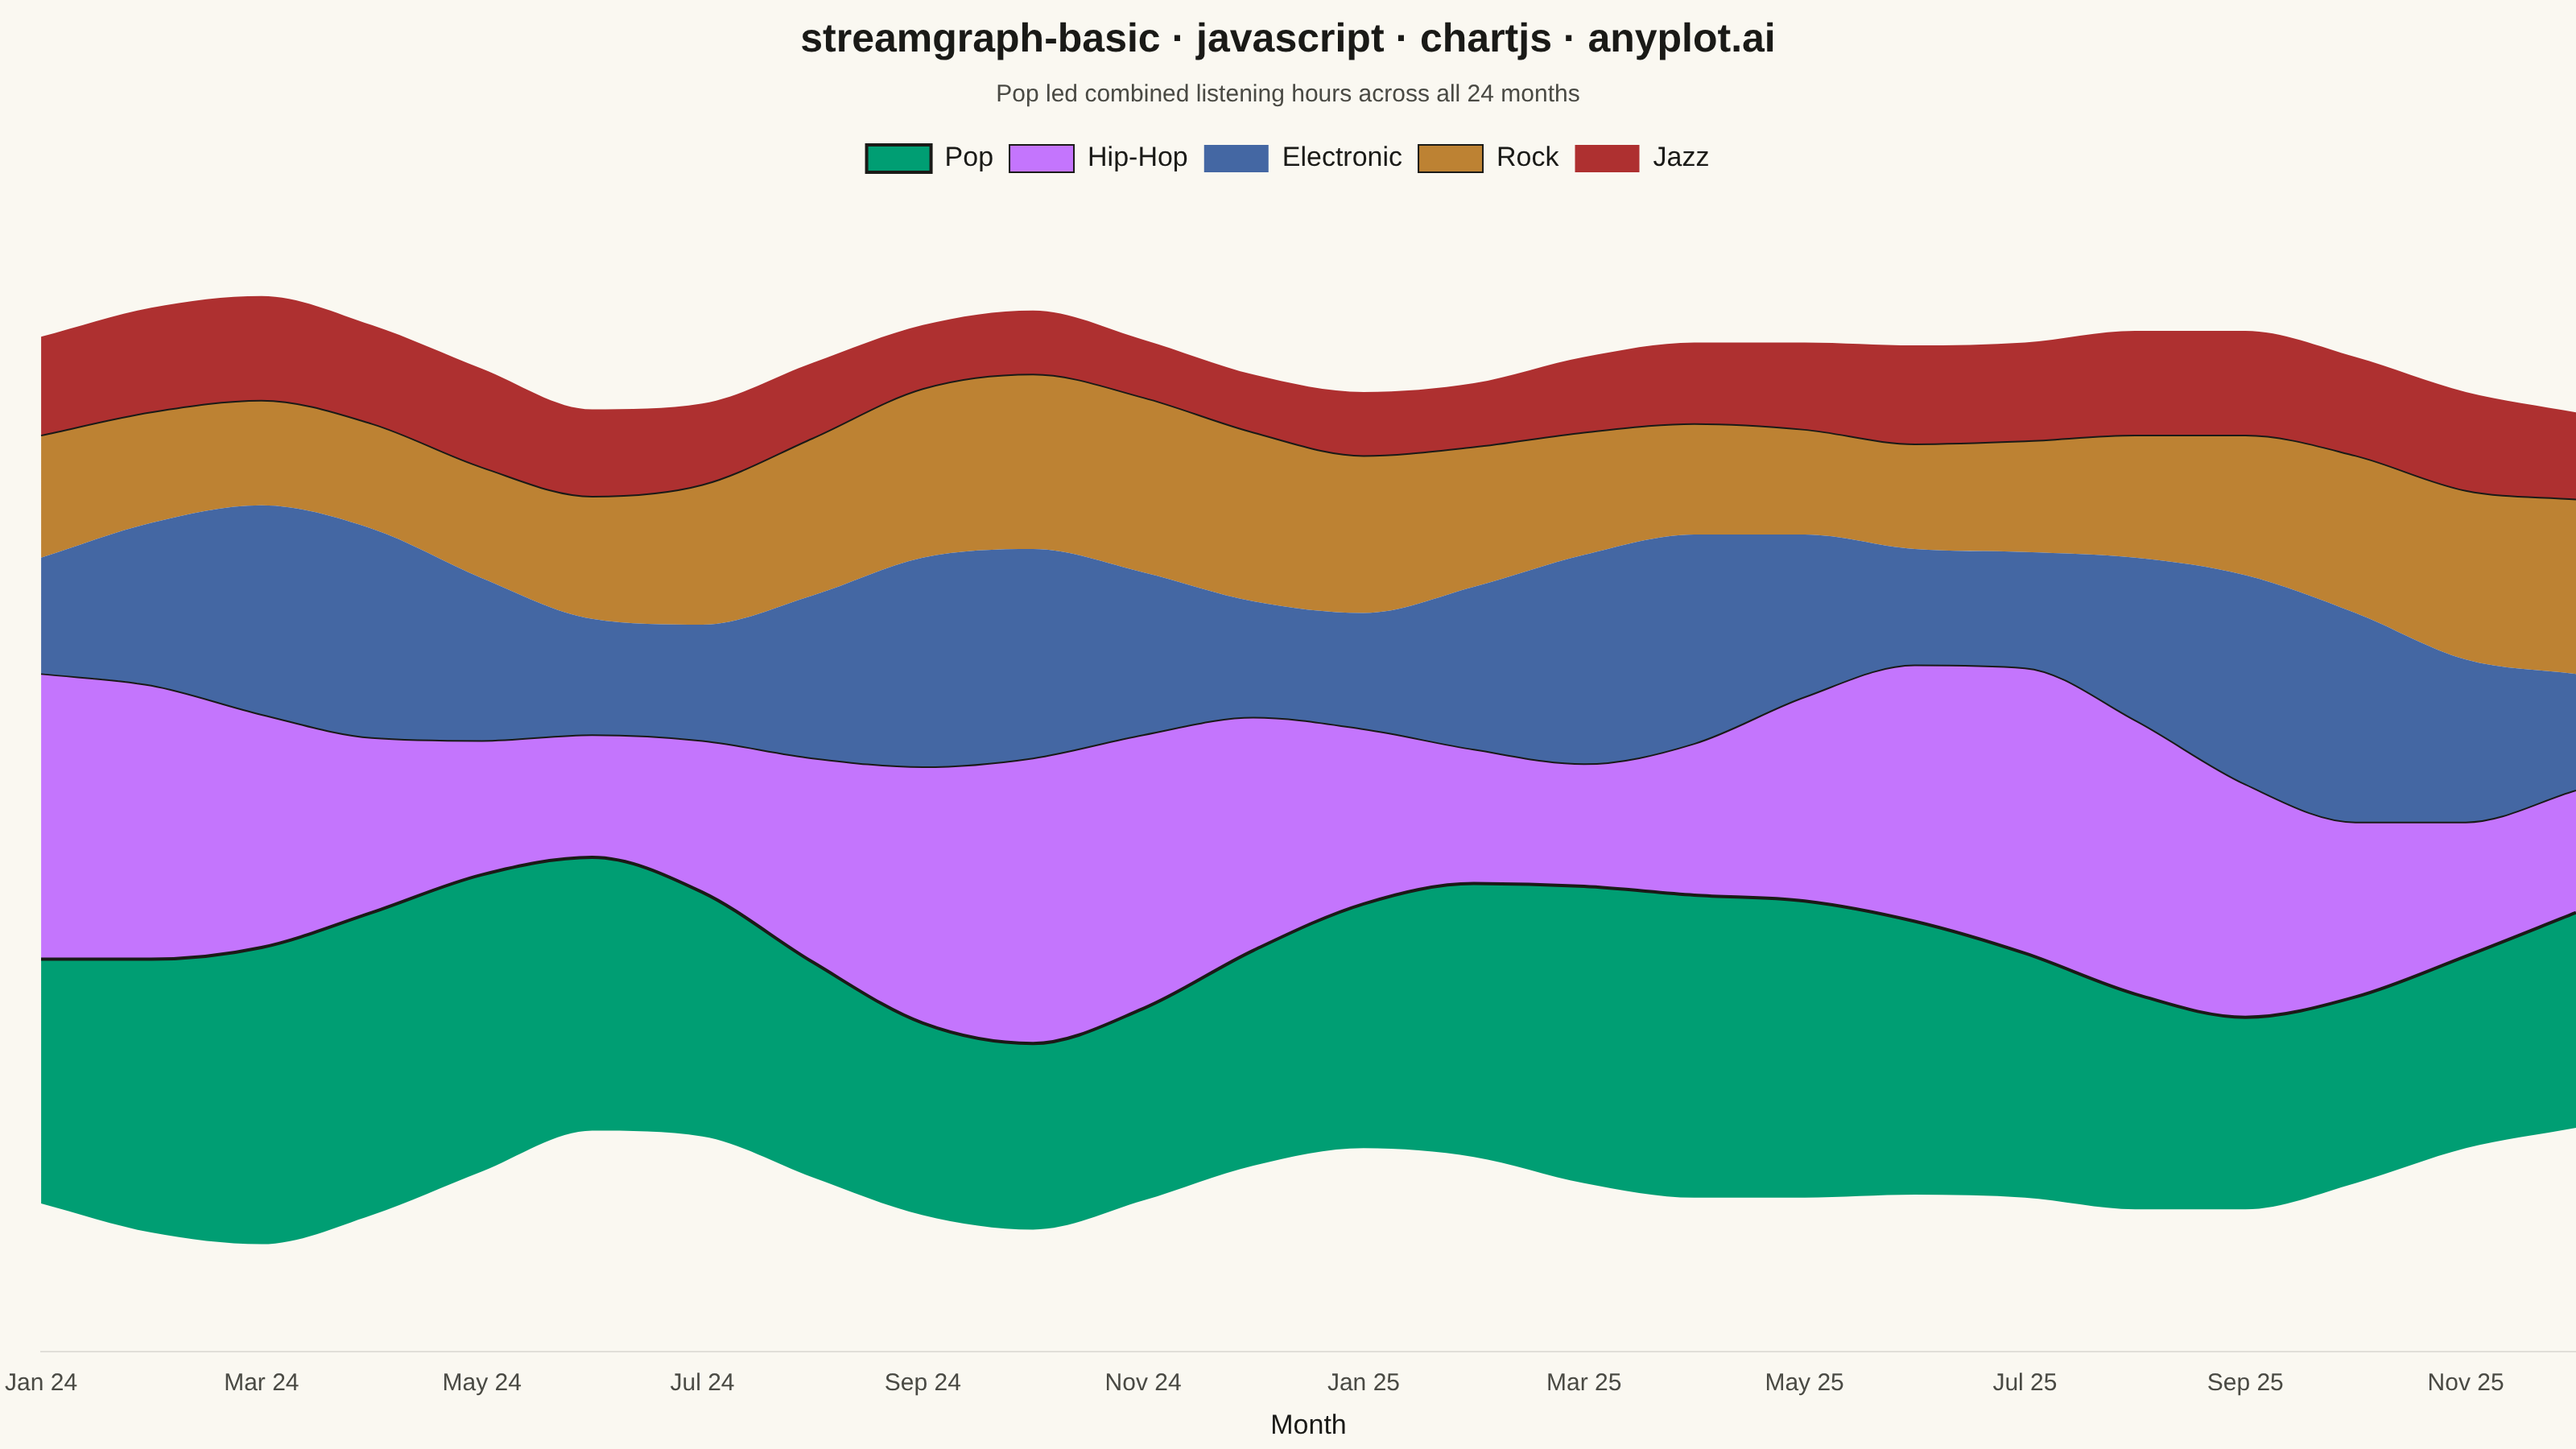
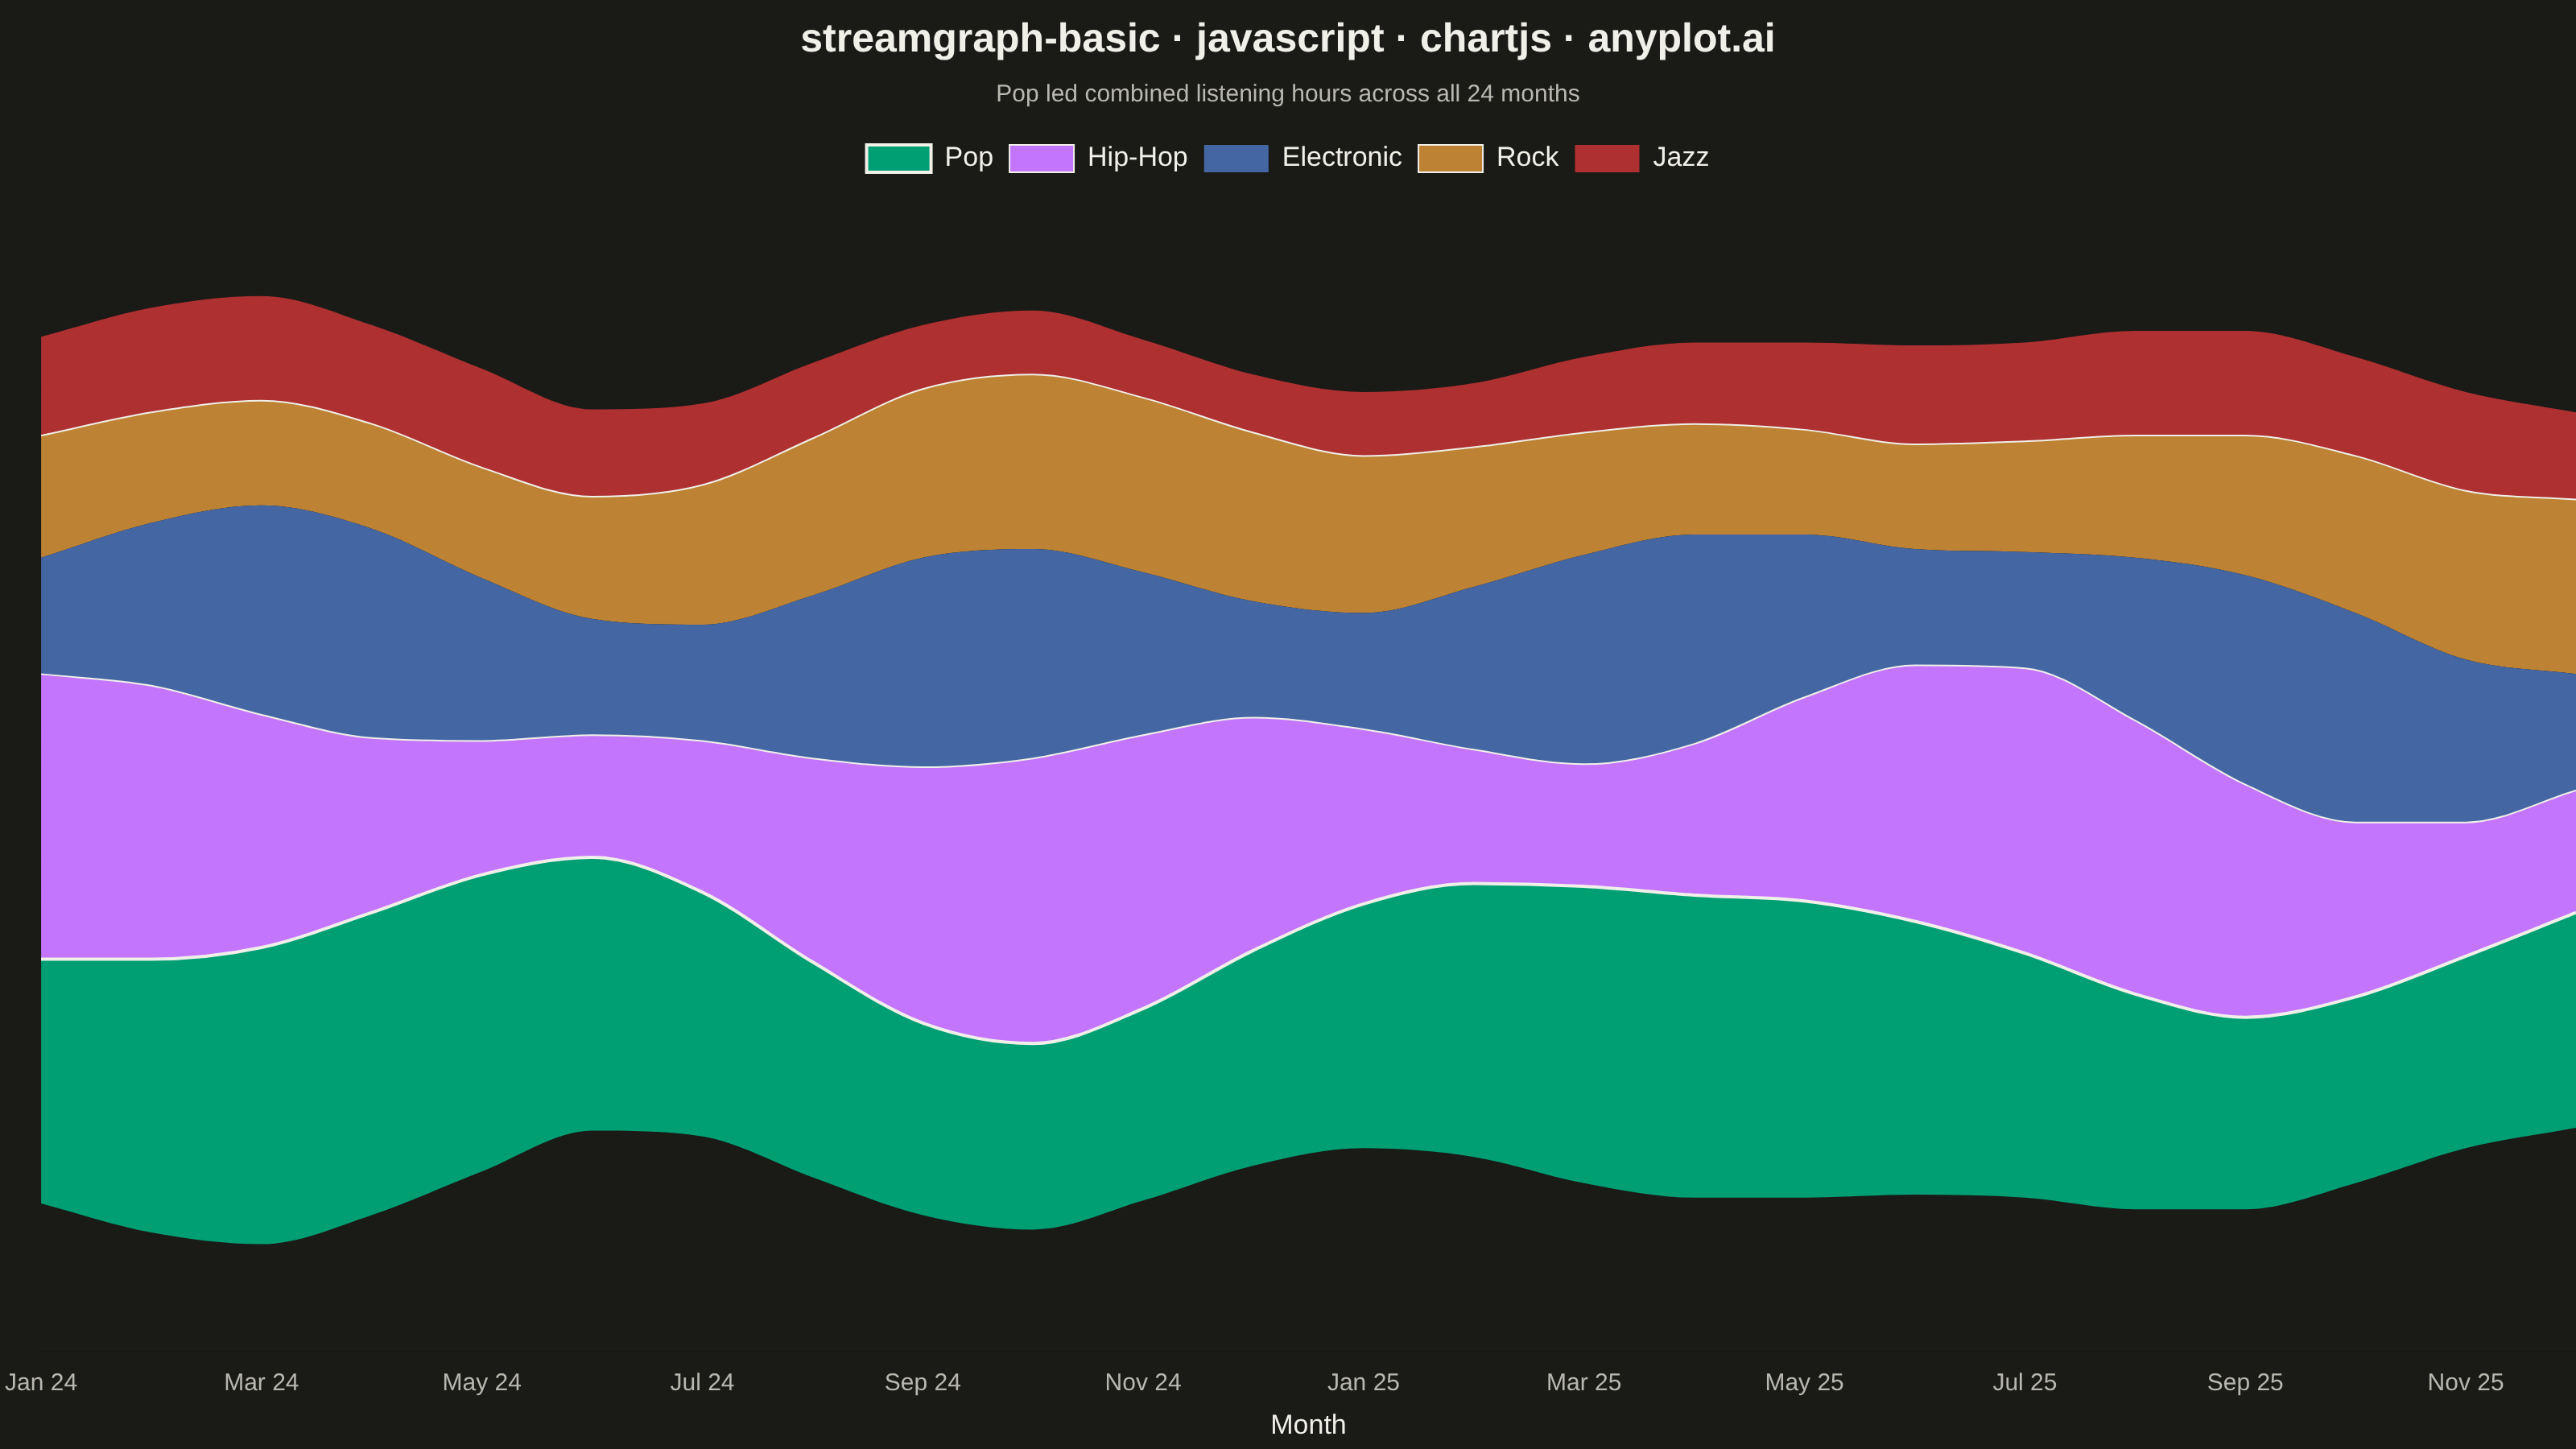
A streamgraph (also known as a stacked area chart with a centered baseline) displaying the composition of multiple categories over time with smooth, flowing curves. Unlike traditional stacked area charts, streamgraphs use a symmetric baseline centered around the x-axis, creating an organic, river-like appearance that emphasizes the overall shape and relative proportions of each category while minimizing the visual distortion of individual layers.
// anyplot.ai
// streamgraph-basic: Basic Stream Graph
// Library: chartjs 4.4.7 | JavaScript 22.23.1
// Quality: 93/100 | Created: 2026-08-05

//# anyplot-orientation: landscape
const t = window.ANYPLOT_TOKENS;

// --- Data (in-memory, deterministic) ---------------------------------------
const months = [
  "Jan 24", "Feb 24", "Mar 24", "Apr 24", "May 24", "Jun 24",
  "Jul 24", "Aug 24", "Sep 24", "Oct 24", "Nov 24", "Dec 24",
  "Jan 25", "Feb 25", "Mar 25", "Apr 25", "May 25", "Jun 25",
  "Jul 25", "Aug 25", "Sep 25", "Oct 25", "Nov 25", "Dec 25",
];
const genres = ["Pop", "Hip-Hop", "Electronic", "Rock", "Jazz"];

// Smooth seasonal listening-hour trends (thousands of hours) per genre
const baseHours = [42, 35, 28, 24, 14];
const amplitude = [10, 14, 9, 6, 4];
const periodMonths = [12, 9, 6, 14, 18];
const phaseShift = [0, 2, 5, 8, 3];
const series = genres.map((_, i) =>
  months.map((_, m) =>
    Math.max(
      2,
      Math.round(
        baseHours[i] +
          amplitude[i] * Math.sin((2 * Math.PI * (m + phaseShift[i])) / periodMonths[i])
      )
    )
  )
);

// Centered (symmetric) baseline so the stack reads as a river, not a bar stack
const baseline = months.map((_, m) => {
  const total = series.reduce((sum, s) => sum + s[m], 0);
  return -total / 2;
});

let cumulative = baseline.slice();
const layerTops = series.map((s) => {
  cumulative = cumulative.map((c, m) => c + s[m]);
  return cumulative.slice();
});

// Storytelling focal point: the genre with the largest combined listening
// hours gets a defined ink outline so the flow has a clear point of entry.
const totals = series.map((s) => s.reduce((sum, v) => sum + v, 0));
const heroIndex = totals.indexOf(Math.max(...totals));

// Lavender (Hip-Hop) and ochre (Rock) fall below WCAG 3:1 contrast on the
// cream background — a thin ink stroke keeps their band edges legible.
const lowContrast = new Set(["Hip-Hop", "Rock"]);

// --- Mount -------------------------------------------------------------------
const canvas = document.createElement("canvas");
document.getElementById("container").appendChild(canvas);

// --- Chart ---------------------------------------------------------------
const datasets = [
  {
    label: "",
    data: baseline,
    borderWidth: 0,
    pointRadius: 0,
    fill: false,
    tension: 0.4,
    cubicInterpolationMode: "monotone",
  },
  ...genres.map((genre, i) => ({
    label: genre,
    data: layerTops[i],
    borderColor: i === heroIndex || lowContrast.has(genre) ? t.ink : t.palette[i % t.palette.length],
    backgroundColor: t.palette[i % t.palette.length],
    borderWidth: i === heroIndex ? 2 : lowContrast.has(genre) ? 1 : 0,
    pointRadius: 0,
    fill: i,
    tension: 0.4,
    cubicInterpolationMode: "monotone",
  })),
];

new Chart(canvas, {
  type: "line",
  data: { labels: months, datasets },
  options: {
    responsive: true,
    maintainAspectRatio: false,
    animation: false,
    interaction: { mode: "nearest", intersect: false },
    plugins: {
      title: {
        display: true,
        text: "streamgraph-basic · javascript · chartjs · anyplot.ai",
        color: t.ink,
        font: { size: 25 },
      },
      subtitle: {
        display: true,
        text: `${genres[heroIndex]} led combined listening hours across all 24 months`,
        color: t.inkSoft,
        font: { size: 15, weight: "normal" },
        padding: { bottom: 12 },
      },
      legend: {
        labels: {
          color: t.ink,
          font: { size: 17 },
          filter: (item) => item.text !== "",
        },
      },
    },
    scales: {
      x: {
        type: "category",
        ticks: {
          color: t.inkSoft,
          font: { size: 15 },
          maxRotation: 0,
          autoSkip: true,
          maxTicksLimit: 12,
        },
        grid: { display: false },
        title: { display: true, text: "Month", color: t.ink, font: { size: 17 } },
      },
      y: {
        display: false,
      },
    },
  },
});
Runnable source as JSON, for any HTTP client: https://api.anyplot.ai/specs/streamgraph-basic/chartjs/code. Any spec id and library id listed in llms-full.txt fit the same URL shape; every URL below is complete and callable.
{
  "spec_id": "streamgraph-basic",
  "language": "javascript",
  "library": "chartjs",
  "page": "https://anyplot.ai/streamgraph-basic/javascript/chartjs",
  "hub": "https://anyplot.ai/streamgraph-basic",
  "code_json": "https://api.anyplot.ai/specs/streamgraph-basic/chartjs/code",
  "spec_json": "https://api.anyplot.ai/specs/streamgraph-basic",
  "render_light_png": "https://storage.googleapis.com/anyplot-images/plots/streamgraph-basic/javascript/chartjs/plot-light.png",
  "render_dark_png": "https://storage.googleapis.com/anyplot-images/plots/streamgraph-basic/javascript/chartjs/plot-dark.png",
  "interactive_light_html": "https://storage.googleapis.com/anyplot-images/plots/streamgraph-basic/javascript/chartjs/plot-light.html",
  "interactive_dark_html": "https://storage.googleapis.com/anyplot-images/plots/streamgraph-basic/javascript/chartjs/plot-dark.html",
  "quality_score": 93.0,
  "license": "MIT",
  "guide": "https://anyplot.ai/llms.txt"
}
Part of Basic Stream Graph on anyplot.ai.