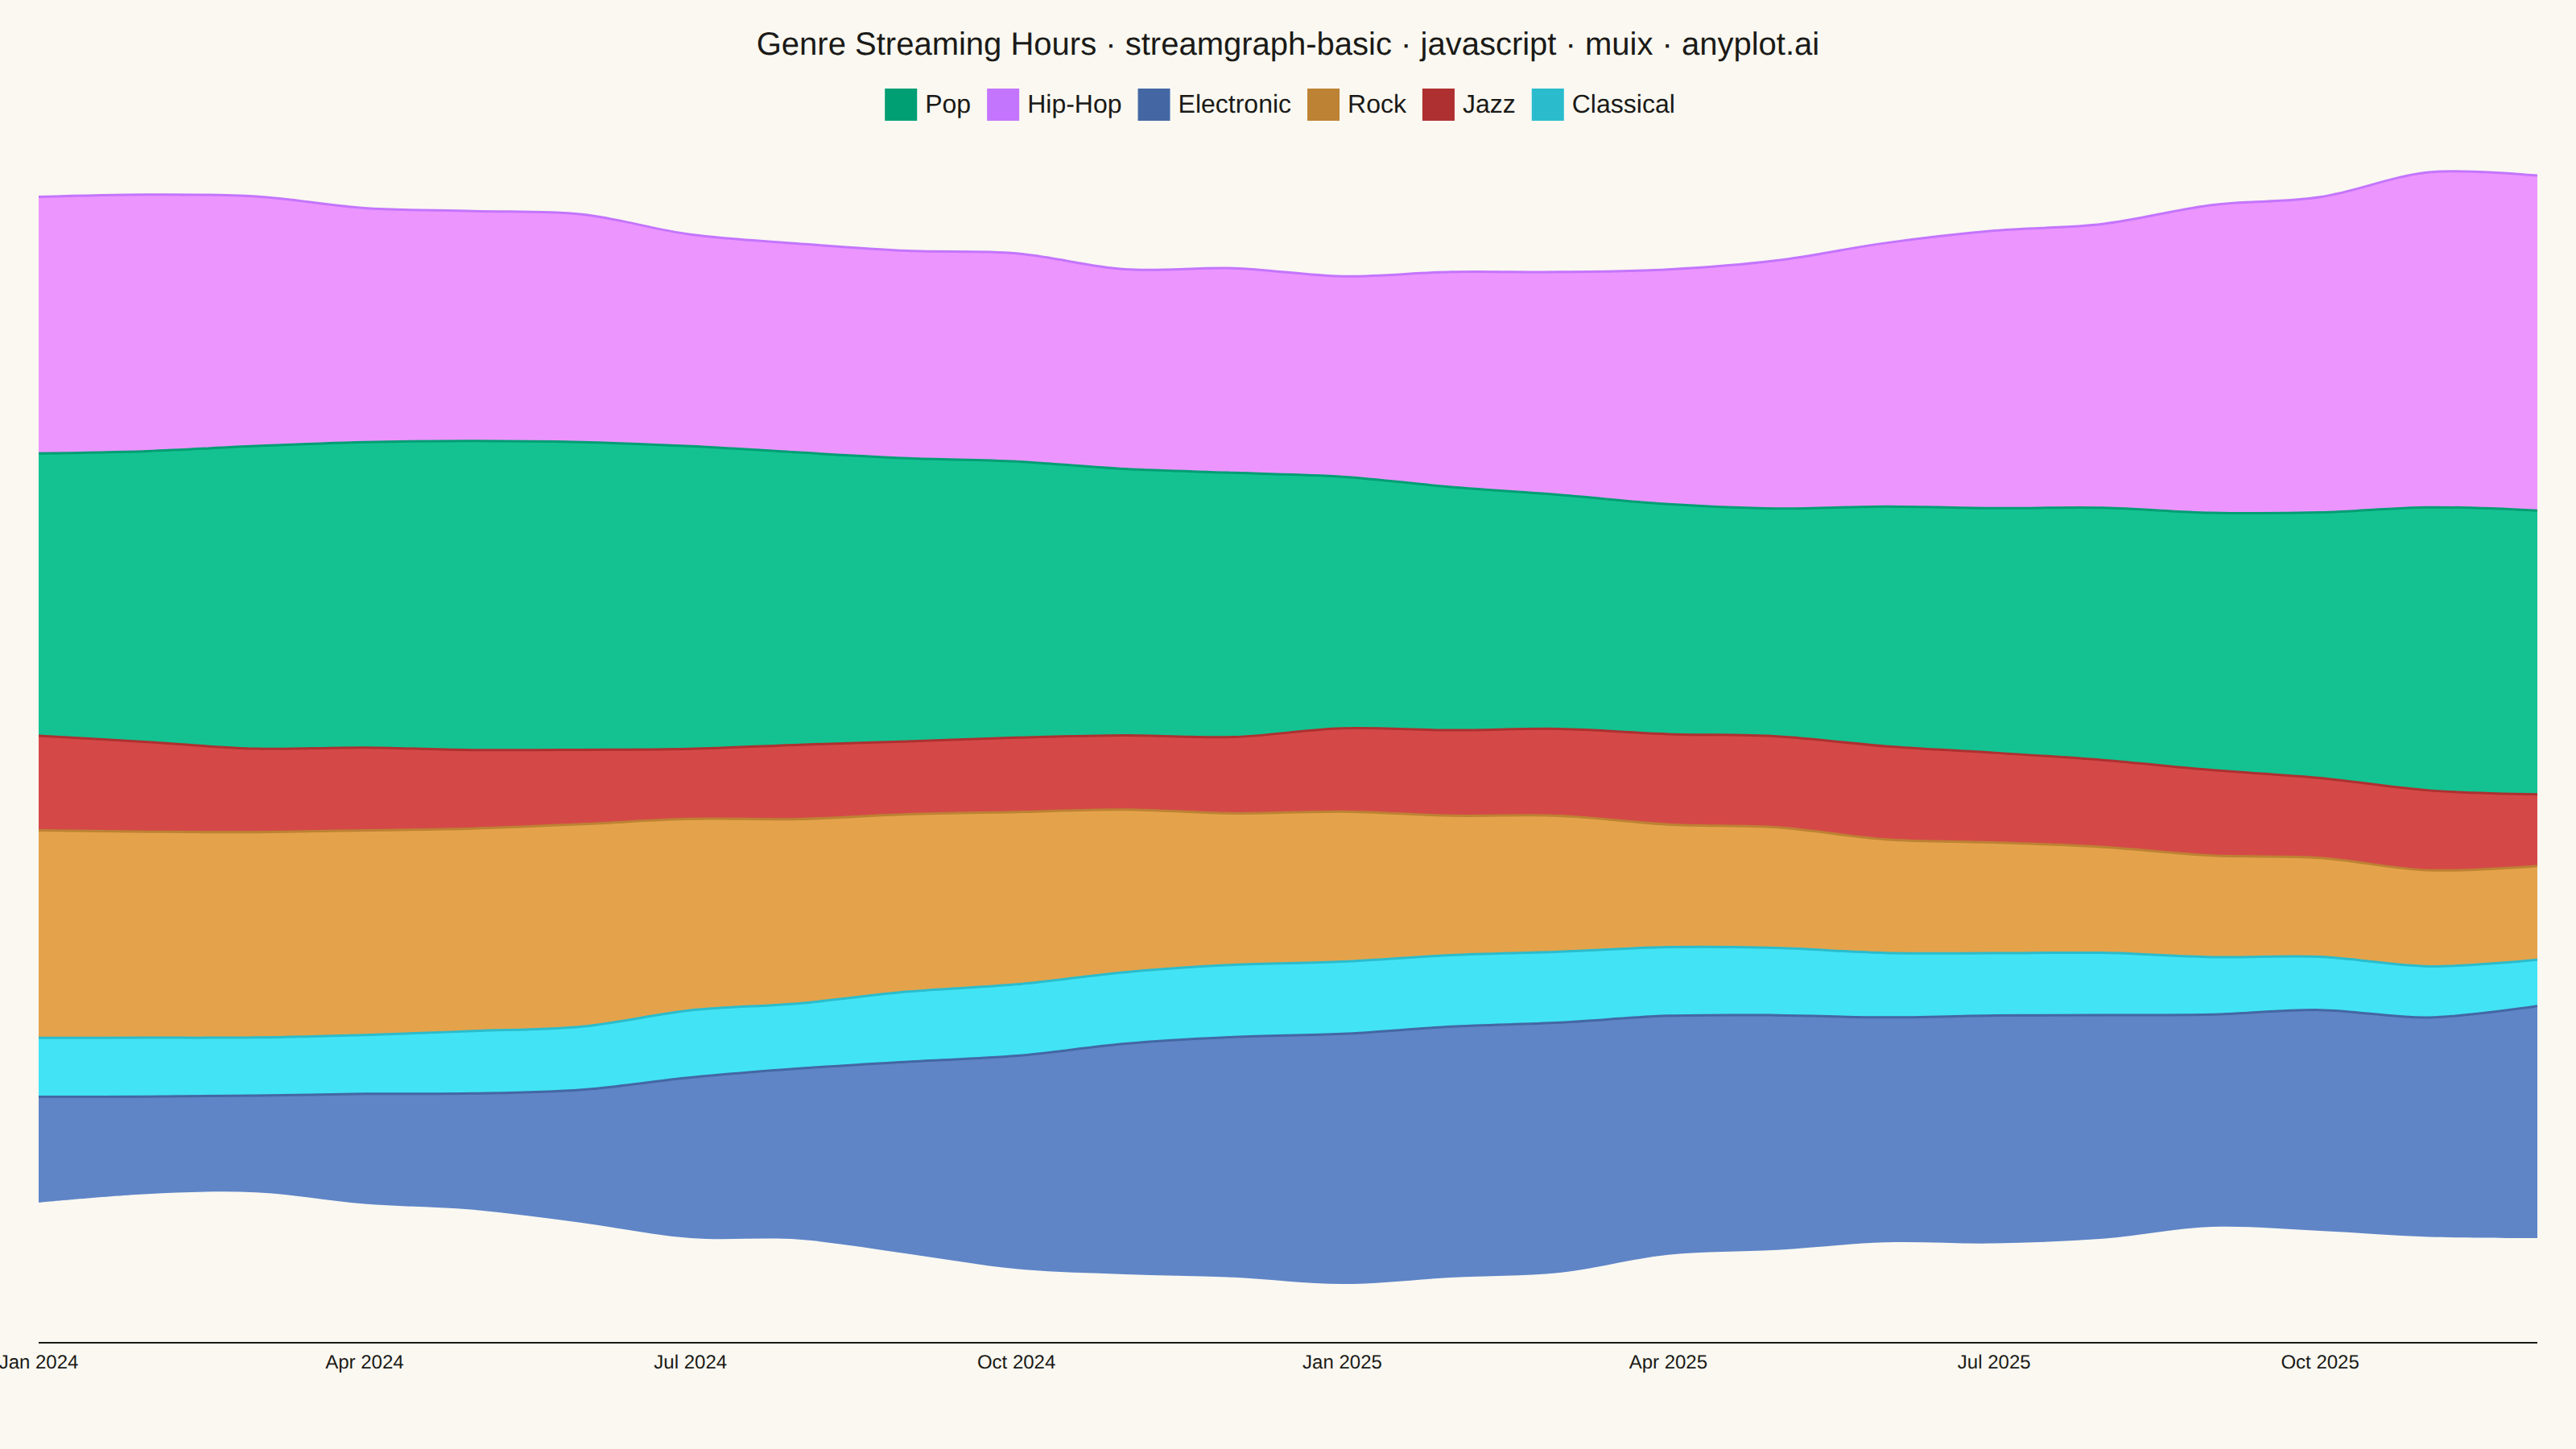
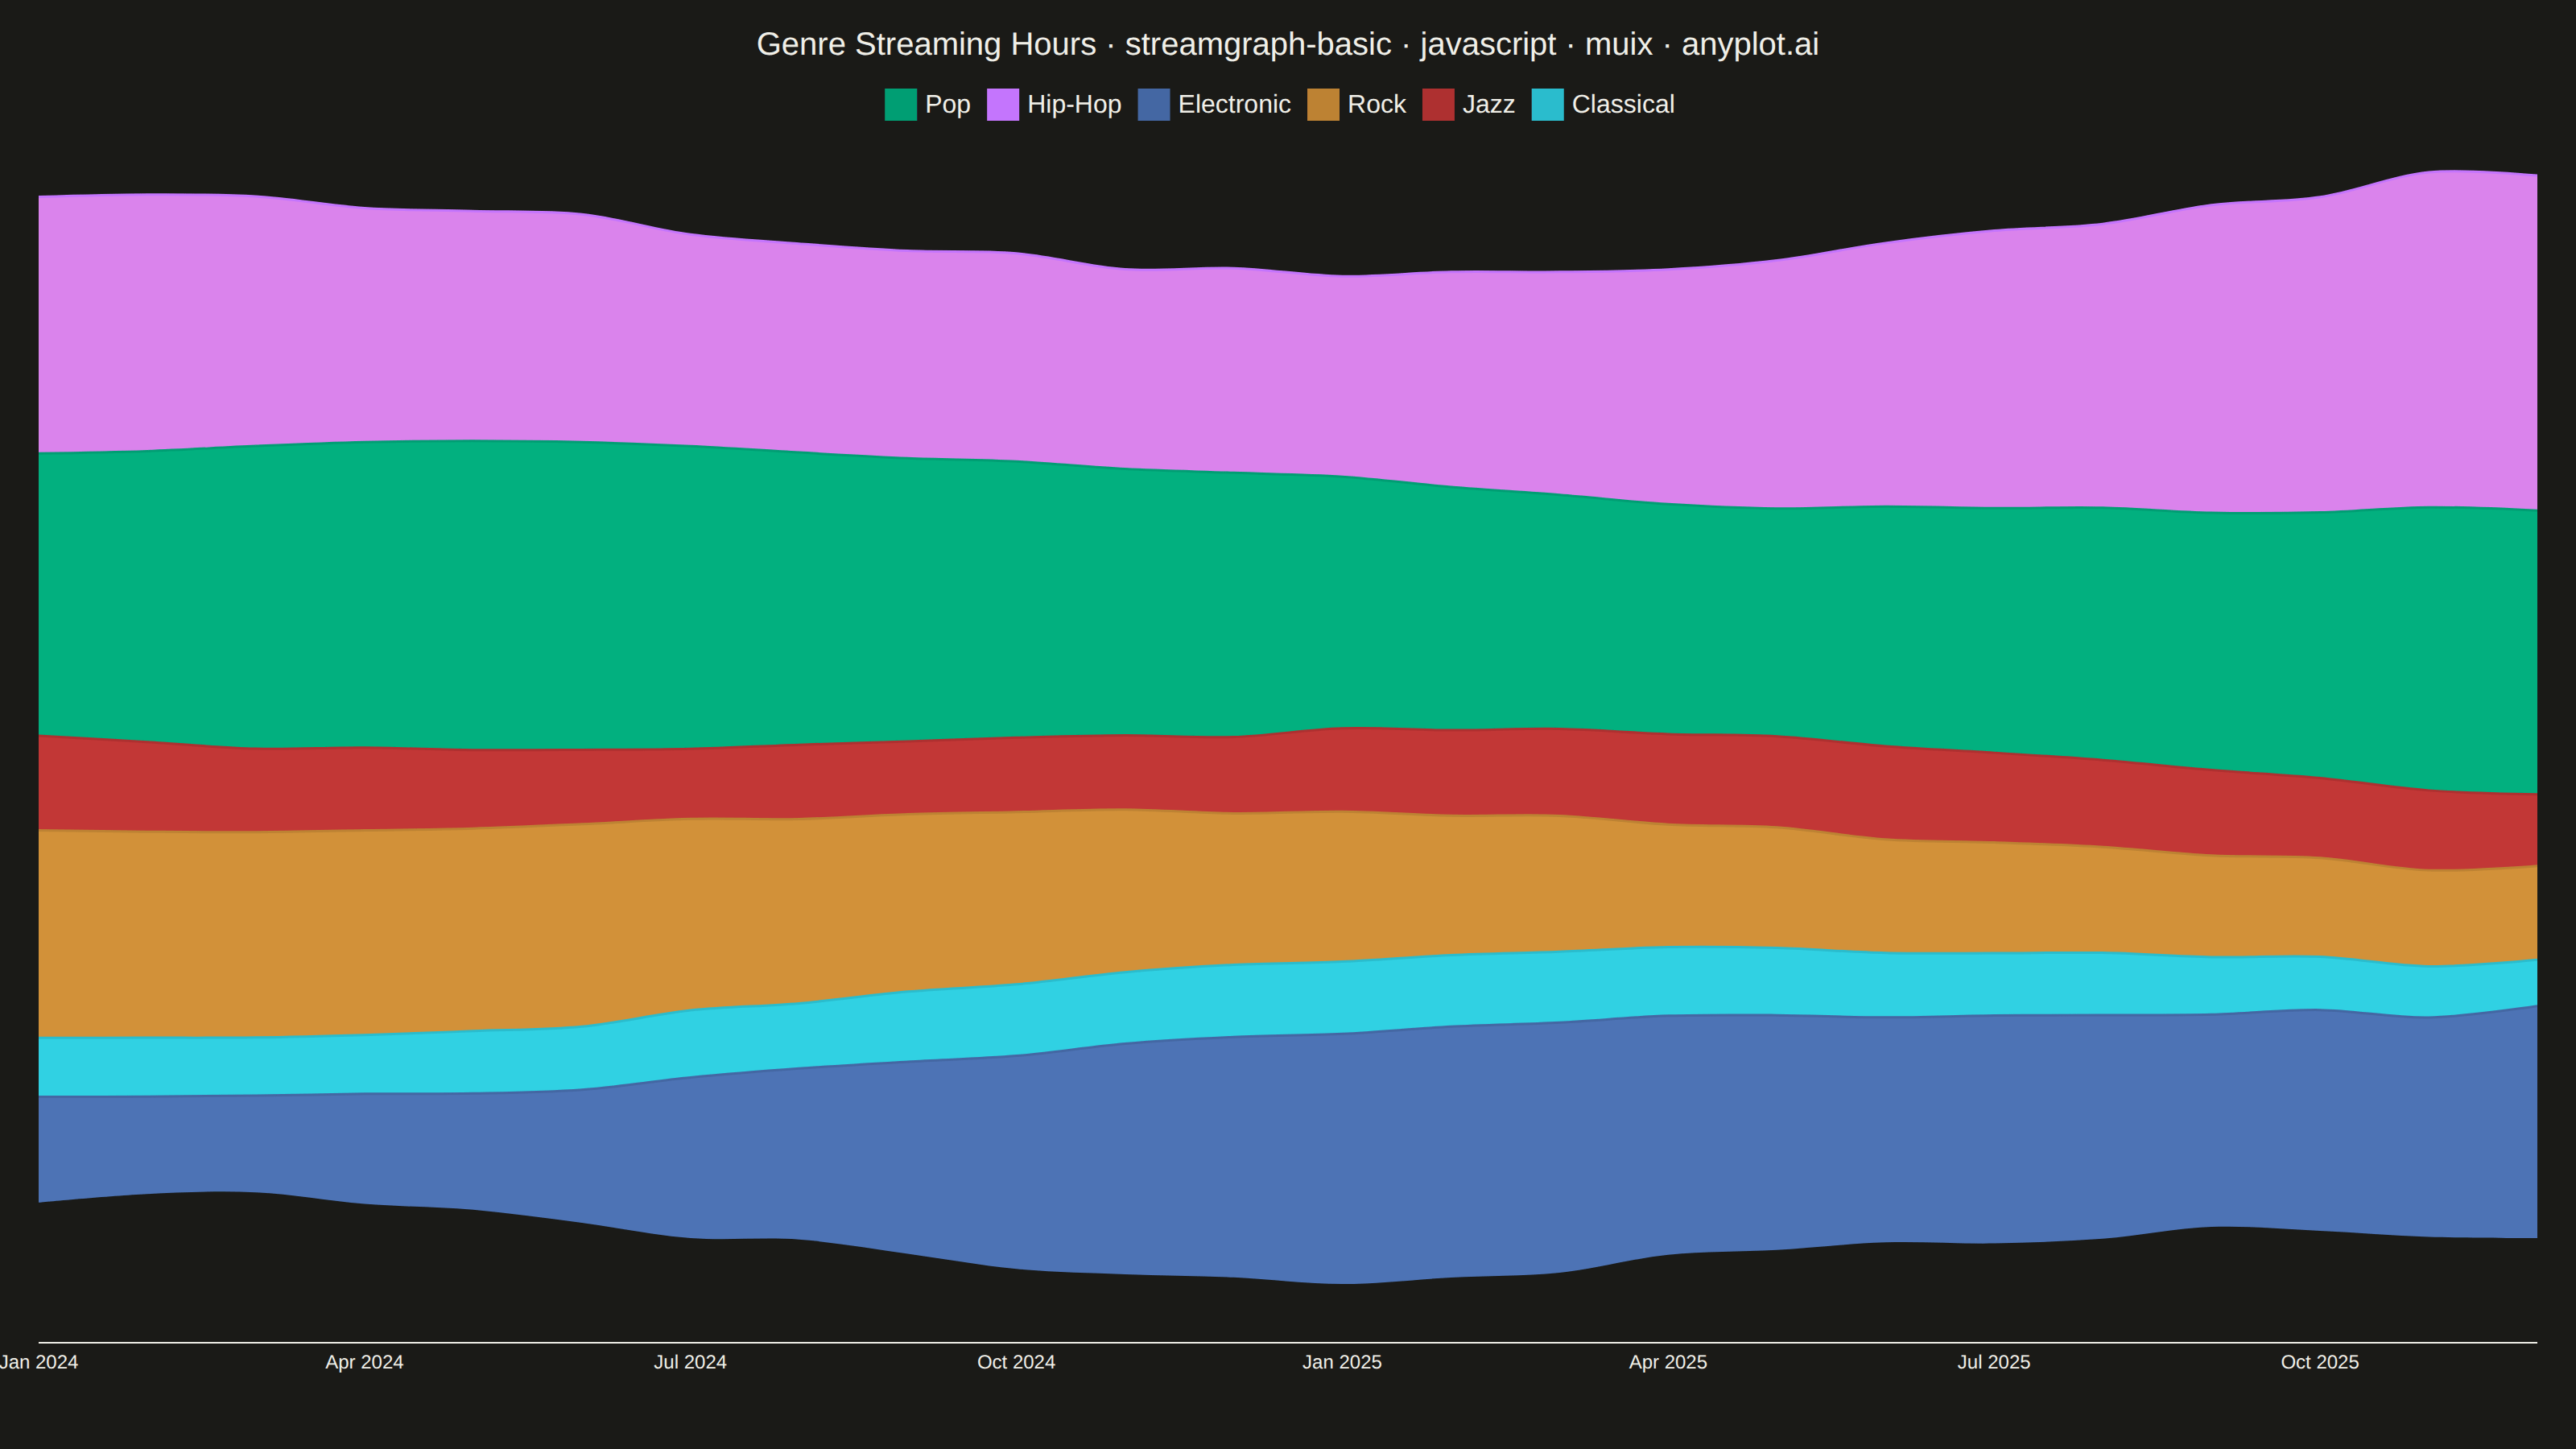
The same plot in 14 other libraries — JavaScript: Chart.js, D3.js, Apache ECharts, Highcharts; Python: Altair, Bokeh, lets-plot, Matplotlib, Plotly, plotnine, Pygal, Seaborn; R: ggplot2; Julia: Makie.jl. Compare all 15 side by side: Basic Stream Graph in Python, R, Julia and JavaScript.
A streamgraph (also known as a stacked area chart with a centered baseline) displaying the composition of multiple categories over time with smooth, flowing curves. Unlike traditional stacked area charts, streamgraphs use a symmetric baseline centered around the x-axis, creating an organic, river-like appearance that emphasizes the overall shape and relative proportions of each category while minimizing the visual distortion of individual layers.
// anyplot.ai
// streamgraph-basic: Basic Stream Graph
// Library: muix 7.29.1 | JavaScript 22.23.1
// Quality: 88/100 | Created: 2026-08-05

import { LineChart } from "@mui/x-charts/LineChart";
import Box from "@mui/material/Box";
import Typography from "@mui/material/Typography";

const t = window.ANYPLOT_TOKENS;

// --- Data (in-memory, deterministic) ----------------------------------------
// Monthly listening hours (in thousands) by music genre, two years of data.

const MONTH_NAMES = ["Jan", "Feb", "Mar", "Apr", "May", "Jun", "Jul", "Aug", "Sep", "Oct", "Nov", "Dec"];
const MONTHS_COUNT = 24;
const months = Array.from(
  { length: MONTHS_COUNT },
  (_, i) => `${MONTH_NAMES[i % 12]} ${2024 + Math.floor(i / 12)}`,
);

// Tiny fixed-seed LCG for reproducible micro-variation (no seeded RNG in the browser)
let seed = 42;
function nextRandom() {
  seed = (seed * 1103515245 + 12345) & 0x7fffffff;
  return seed / 0x7fffffff;
}

// Genre trajectories: Electronic and Hip-Hop grow steadily, Rock cools off,
// Jazz and Classical decline slowly, Pop stays roughly flat.
const genres = [
  { name: "Pop", base: 380, amp: 55, freq: 0.55, phase: 0.4, trend: 0.4 },
  { name: "Hip-Hop", base: 300, amp: 70, freq: 0.45, phase: 2.1, trend: 5.5 },
  { name: "Electronic", base: 190, amp: 60, freq: 0.65, phase: 4.0, trend: 8.5 },
  { name: "Rock", base: 260, amp: 45, freq: 0.35, phase: 1.2, trend: -3.5 },
  { name: "Jazz", base: 140, amp: 25, freq: 0.5, phase: 3.3, trend: -2.0 },
  { name: "Classical", base: 100, amp: 18, freq: 0.4, phase: 5.1, trend: -1.2 },
];

const genreValues = genres.map((g) =>
  Array.from({ length: MONTHS_COUNT }, (_, i) => {
    const wave = Math.sin(i * g.freq * 0.5 + g.phase) * g.amp;
    const noise = (nextRandom() - 0.5) * g.amp * 0.3;
    return Math.round(Math.max(30, g.base + g.trend * i + wave + noise));
  }),
);

const series = genres.map((g, idx) => ({
  id: g.name,
  label: g.name,
  data: genreValues[idx],
  area: true,
  stack: "listening",
  stackOrder: "insideOut" as const,
  stackOffset: "wiggle" as const,
  curve: "catmullRom" as const,
  showMark: false,
  color: t.palette[idx],
}));

const TITLE = "Genre Streaming Hours · streamgraph-basic · javascript · muix · anyplot.ai";
const TITLE_FONT_SIZE = Math.max(15, Math.round(22 * Math.min(1, 67 / TITLE.length)));
const TITLE_HEIGHT = 60;

// --- Chart (default-exported component — the harness mounts it) ------------
export default function Chart() {
  const { width, height } = window.ANYPLOT_SIZE;

  return (
    <Box
      sx={{
        width,
        height,
        display: "flex",
        flexDirection: "column",
      }}
    >
      <Typography
        sx={{
          color: t.ink,
          fontSize: TITLE_FONT_SIZE,
          fontWeight: 500,
          textAlign: "center",
          lineHeight: 1.2,
          paddingTop: "16px",
        }}
      >
        {TITLE}
      </Typography>
      <LineChart
        width={width}
        height={height - TITLE_HEIGHT}
        skipAnimation
        series={series}
        xAxis={[
          {
            scaleType: "point",
            data: months,
            tickLabelInterval: (_value: string, index: number) => index % 3 === 0,
            disableTicks: true,
          },
        ]}
        leftAxis={null}
        grid={{ horizontal: false, vertical: false }}
        margin={{ left: 64, right: 24, top: 44, bottom: 56 }}
        slotProps={{
          legend: {
            position: { vertical: "top", horizontal: "middle" },
            direction: "row",
            padding: { top: 0, bottom: 12 },
          },
        }}
        sx={{
          "& .MuiChartsAxis-tickLabel": { fontSize: "14px", fill: t.inkSoft },
          "& .MuiChartsLegend-label": { fontSize: "14px" },
          "& .MuiAreaElement-root": { fillOpacity: 0.92 },
          "& .MuiLineElement-root": { strokeWidth: 1.5 },
        }}
      />
    </Box>
  );
}
Runnable source as JSON, for any HTTP client: https://api.anyplot.ai/specs/streamgraph-basic/muix/code. Any spec id and library id listed in llms-full.txt fit the same URL shape; every URL below is complete and callable.
{
  "spec_id": "streamgraph-basic",
  "language": "javascript",
  "library": "muix",
  "page": "https://anyplot.ai/streamgraph-basic/javascript/muix",
  "hub": "https://anyplot.ai/streamgraph-basic",
  "code_json": "https://api.anyplot.ai/specs/streamgraph-basic/muix/code",
  "spec_json": "https://api.anyplot.ai/specs/streamgraph-basic",
  "render_light_png": "https://storage.googleapis.com/anyplot-images/plots/streamgraph-basic/javascript/muix/plot-light.png",
  "render_dark_png": "https://storage.googleapis.com/anyplot-images/plots/streamgraph-basic/javascript/muix/plot-dark.png",
  "interactive_light_html": "https://storage.googleapis.com/anyplot-images/plots/streamgraph-basic/javascript/muix/plot-light.html",
  "interactive_dark_html": "https://storage.googleapis.com/anyplot-images/plots/streamgraph-basic/javascript/muix/plot-dark.html",
  "quality_score": 88.0,
  "license": "MIT",
  "guide": "https://anyplot.ai/llms.txt"
}
Part of Basic Stream Graph on anyplot.ai.