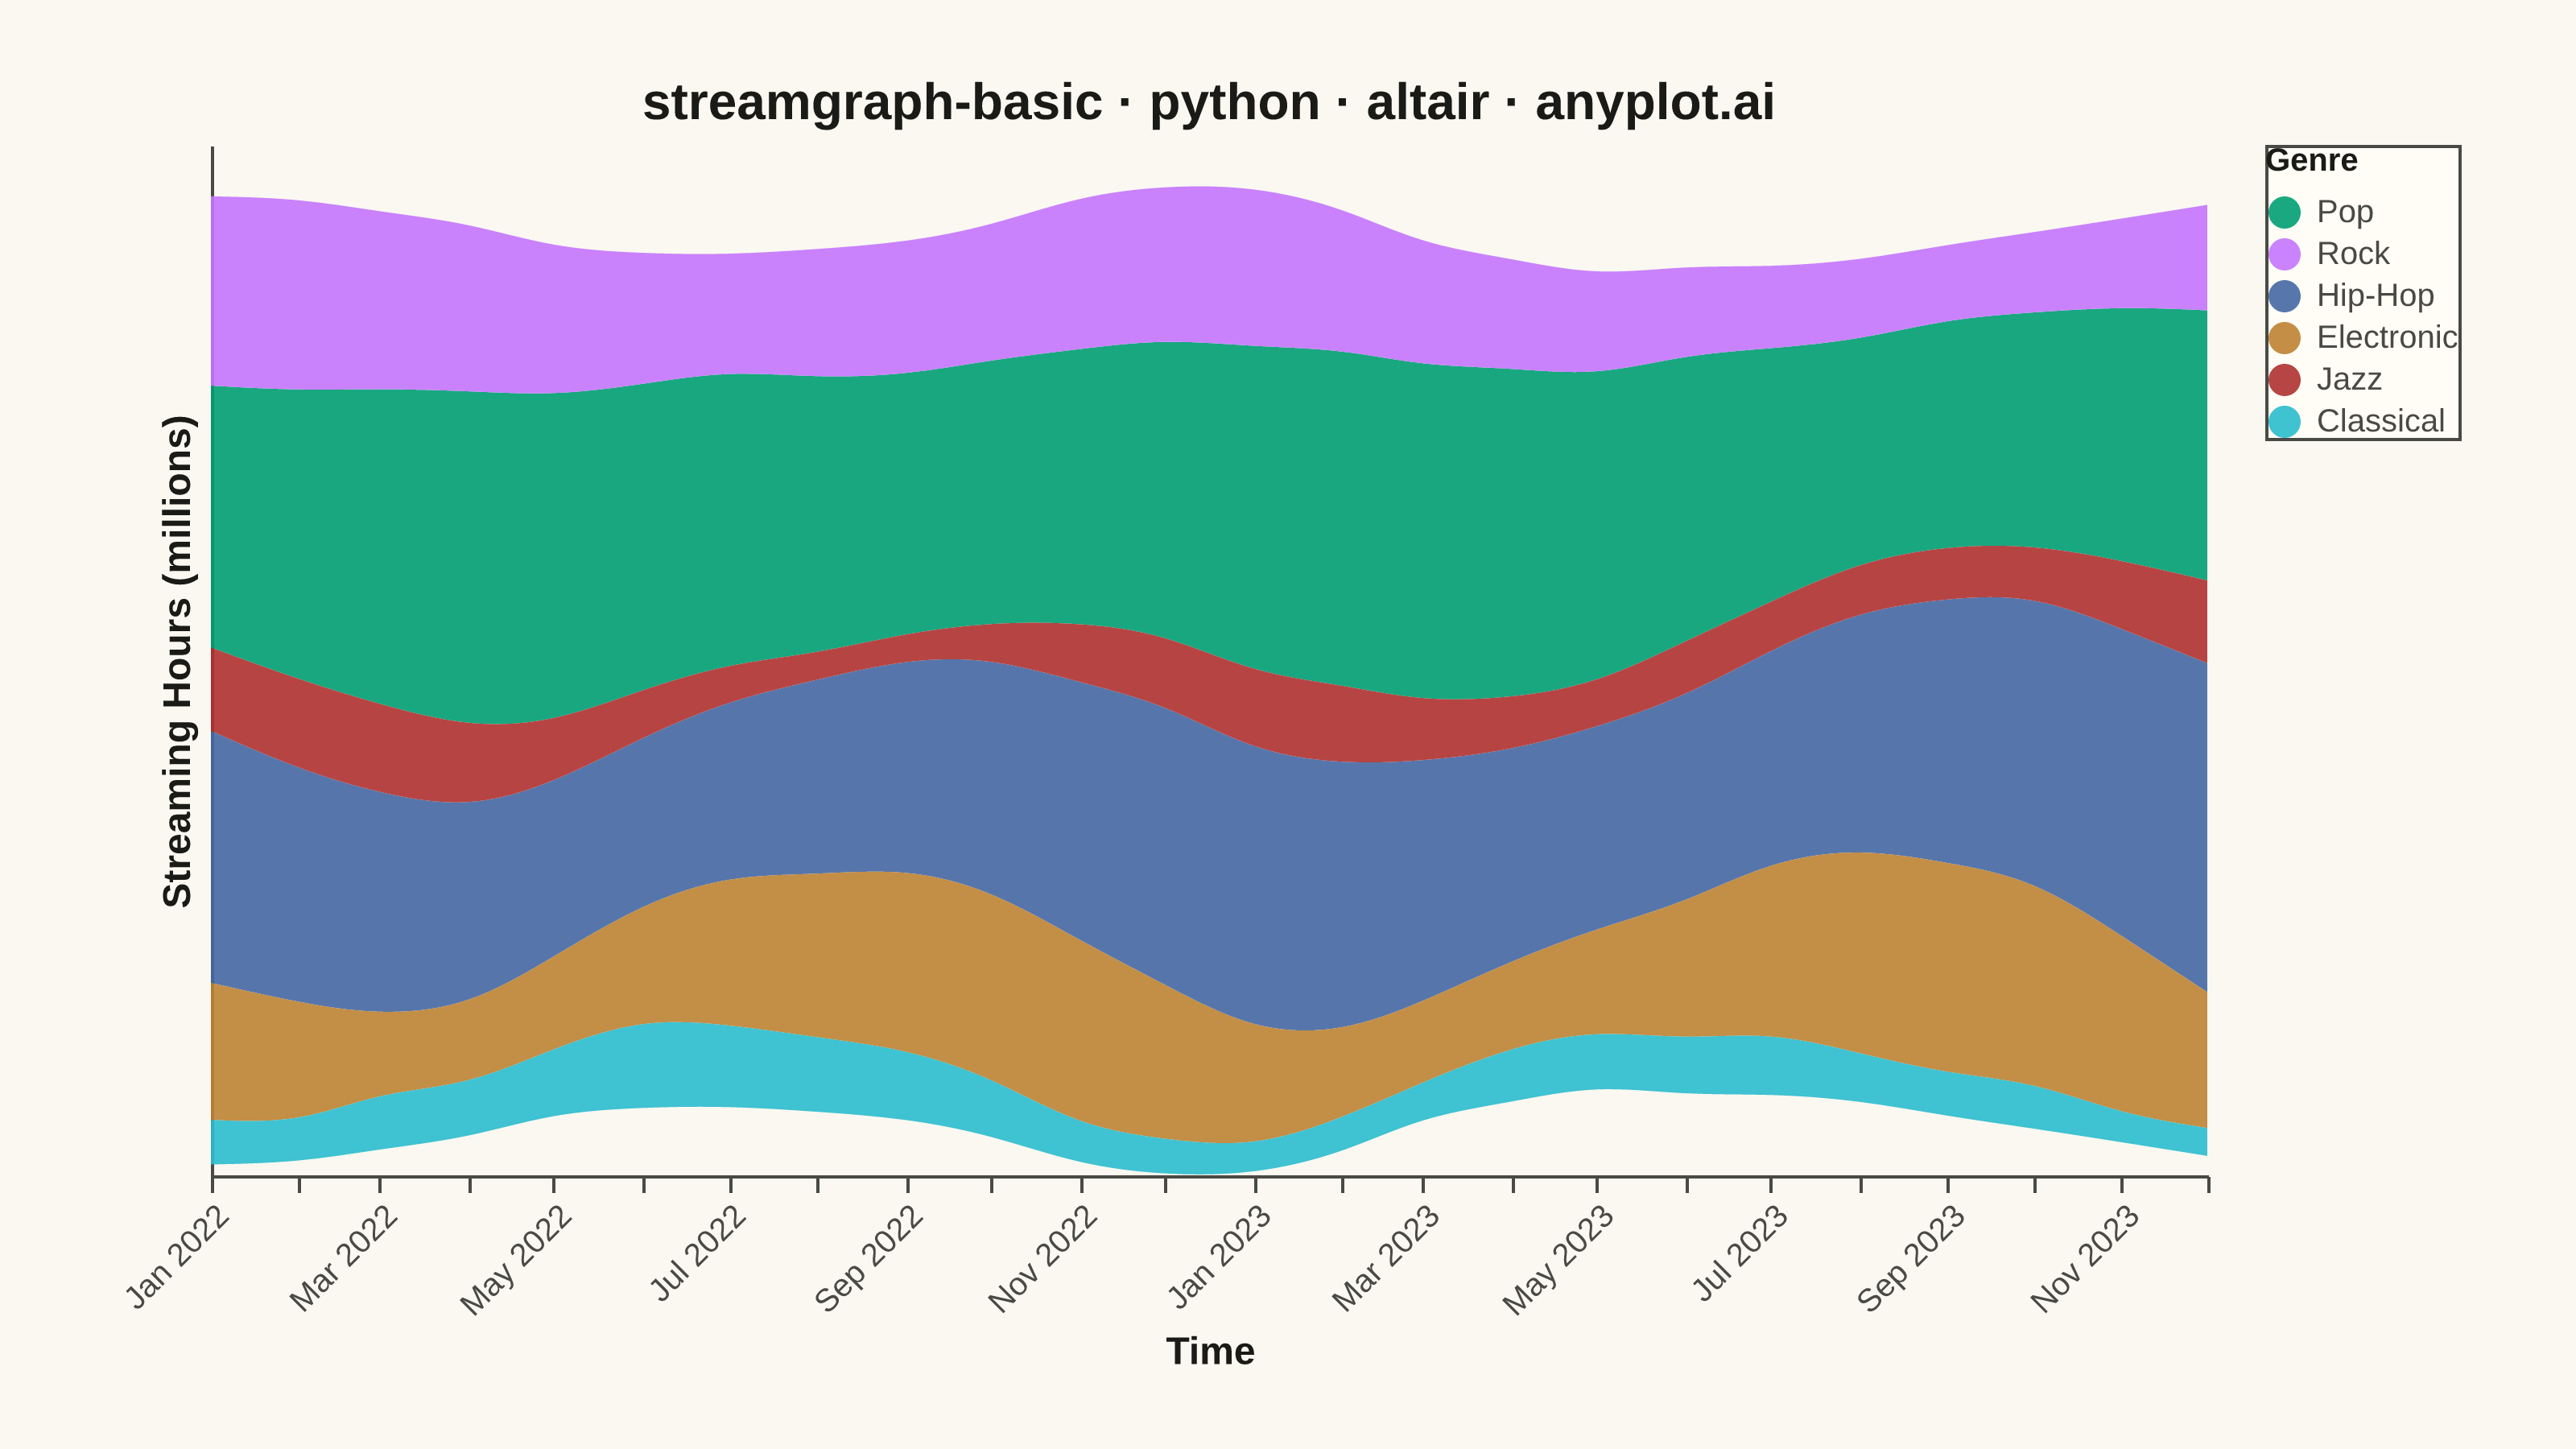
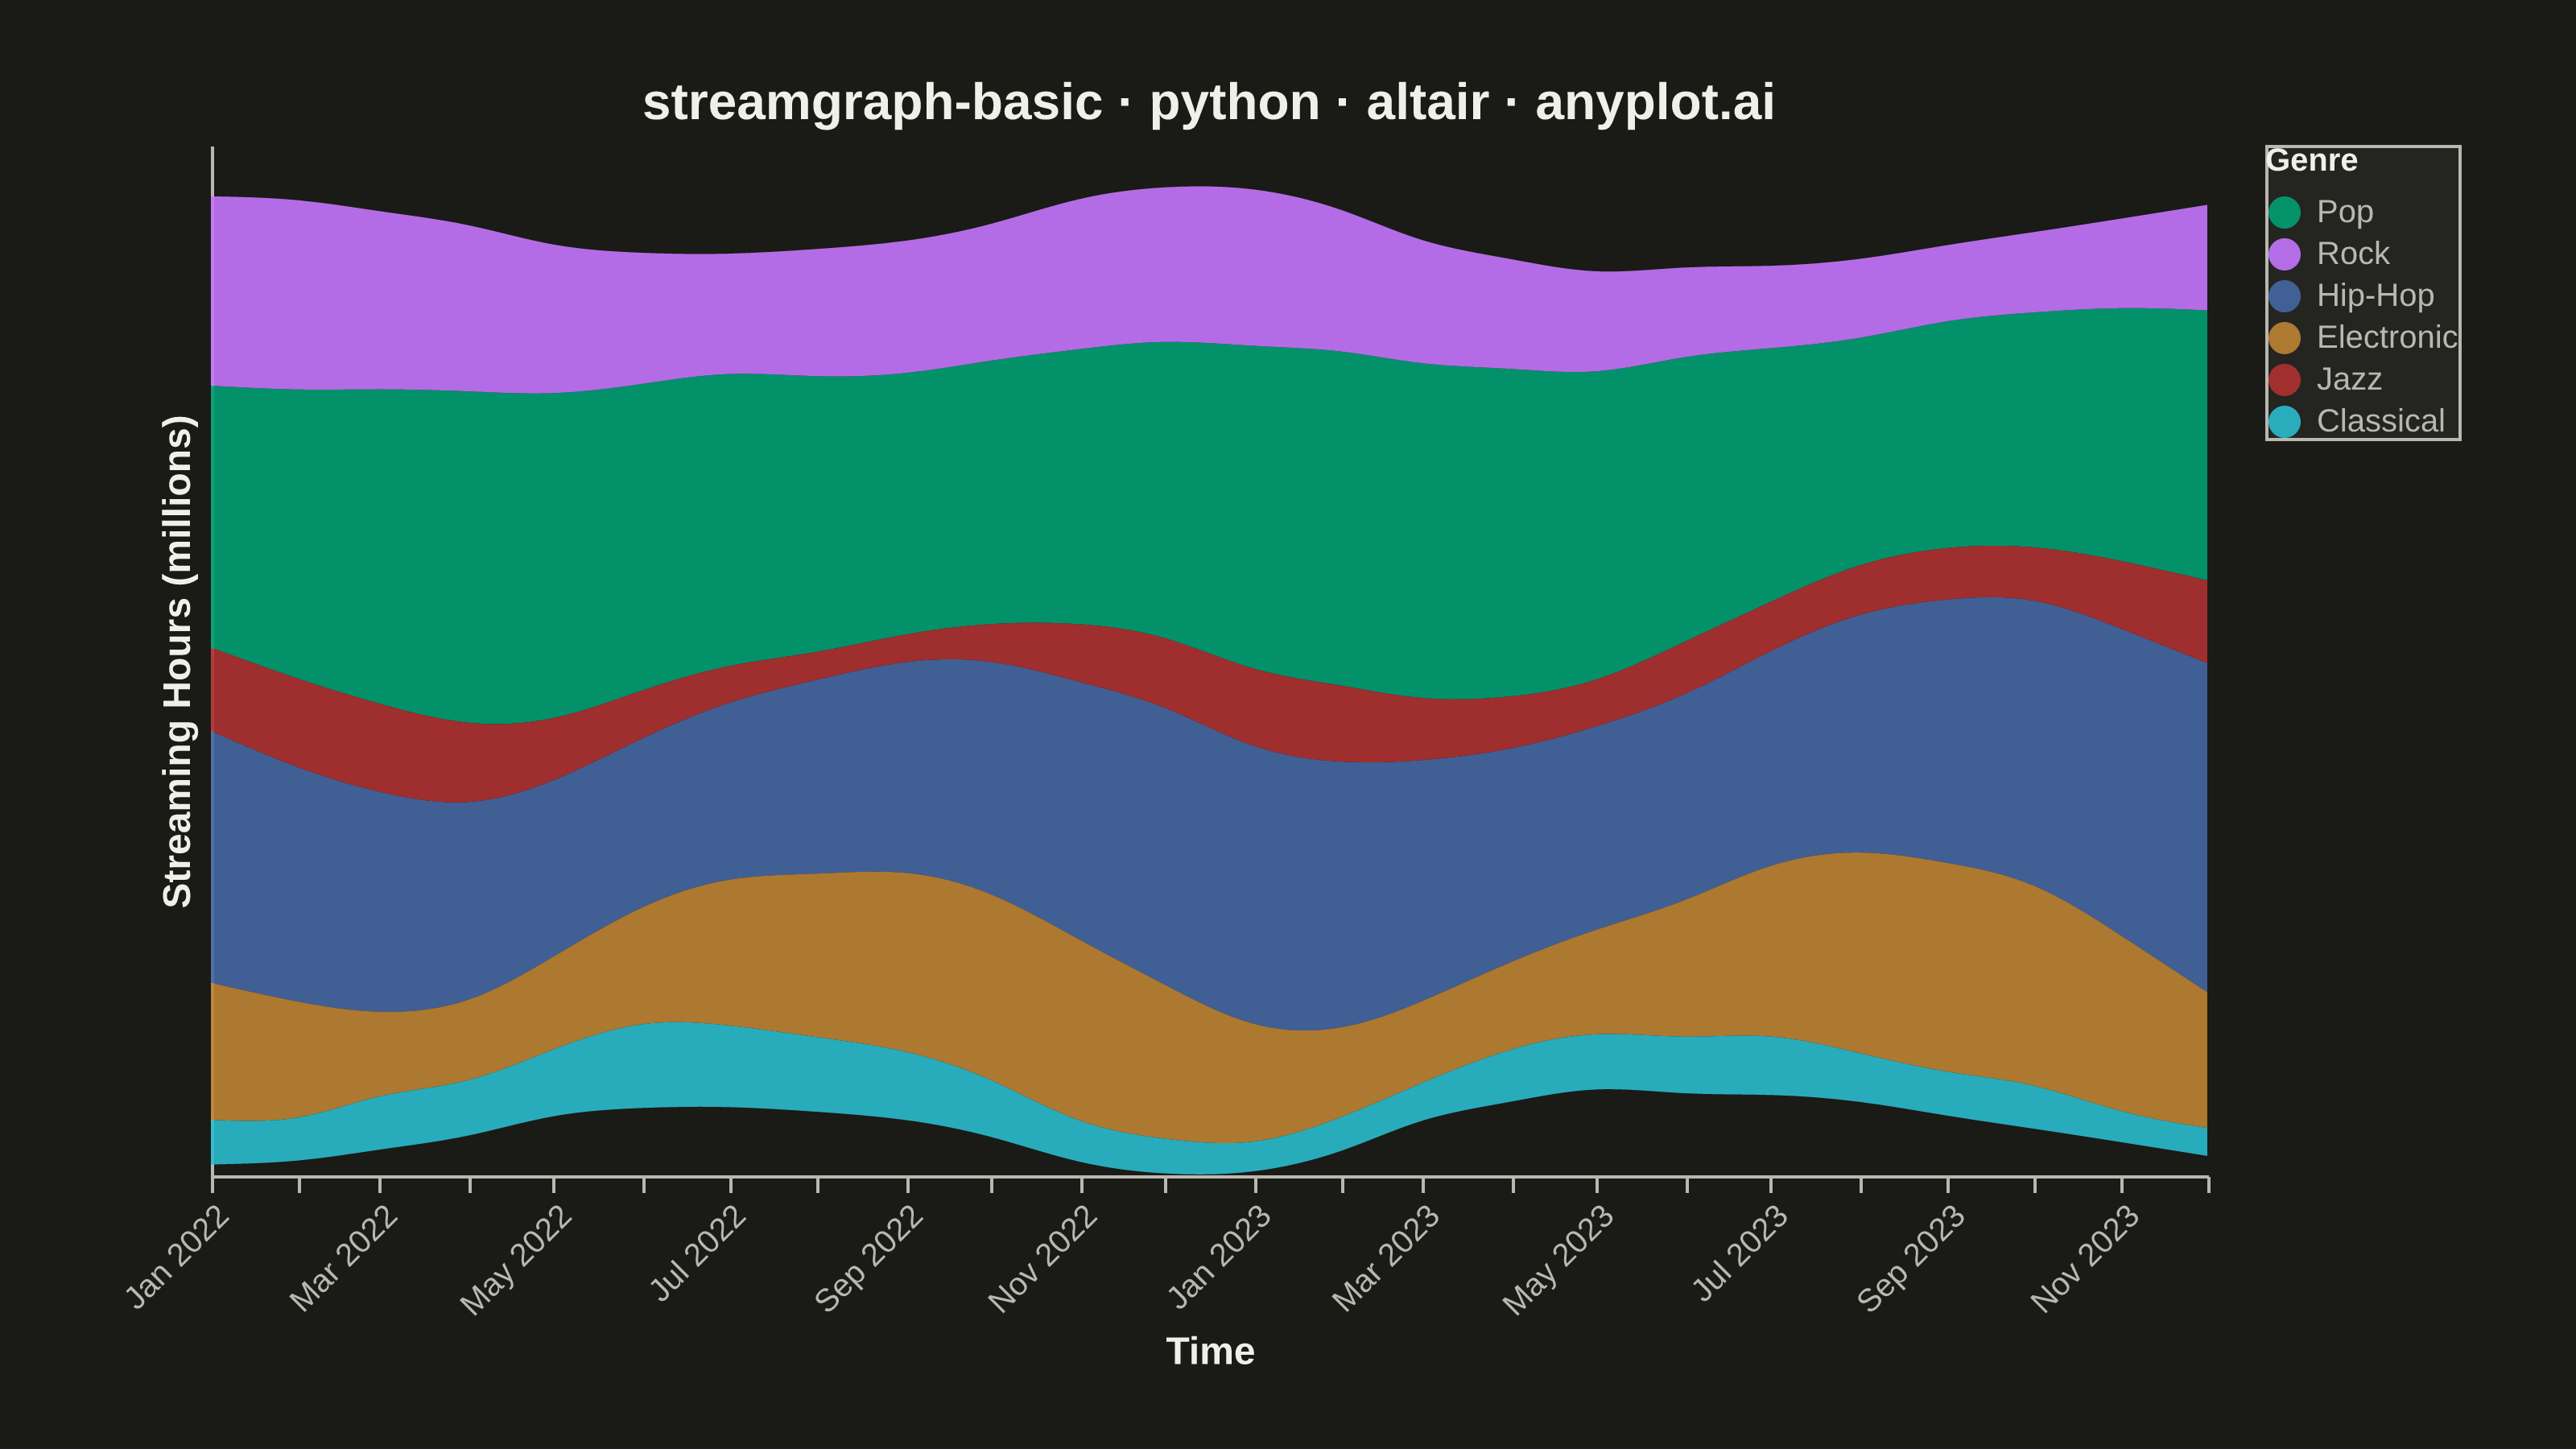
A streamgraph (also known as a stacked area chart with a centered baseline) displaying the composition of multiple categories over time with smooth, flowing curves. Unlike traditional stacked area charts, streamgraphs use a symmetric baseline centered around the x-axis, creating an organic, river-like appearance that emphasizes the overall shape and relative proportions of each category while minimizing the visual distortion of individual layers.
""" anyplot.ai
streamgraph-basic: Basic Stream Graph
Library: altair 6.2.2 | Python 3.13.14
Quality: 90/100 | Updated: 2026-08-05
"""

import os

import altair as alt
import numpy as np
import pandas as pd
from PIL import Image


# Theme-adaptive chrome (Imprint palette)
THEME = os.getenv("ANYPLOT_THEME", "light")
PAGE_BG = "#FAF8F1" if THEME == "light" else "#1A1A17"
ELEVATED_BG = "#FFFDF6" if THEME == "light" else "#242420"
INK = "#1A1A17" if THEME == "light" else "#F0EFE8"
INK_SOFT = "#4A4A44" if THEME == "light" else "#B8B7B0"

IMPRINT_PALETTE = ["#009E73", "#C475FD", "#4467A3", "#BD8233", "#AE3030", "#2ABCCD"]

# Data - Monthly streaming hours by music genre over two years
np.random.seed(42)

months = pd.date_range(start="2022-01-01", periods=24, freq="MS")
genres = ["Pop", "Rock", "Hip-Hop", "Electronic", "Jazz", "Classical"]

# Generate smooth, realistic streaming data for each genre - each genre gets its
# own trend direction, seasonal phase, and amplitude so bands diverge rather than
# swelling/shrinking in lockstep
base_by_genre = {"Pop": 150, "Rock": 100, "Hip-Hop": 120, "Electronic": 80, "Jazz": 40, "Classical": 30}
trend_by_genre = {"Pop": 25, "Rock": -20, "Hip-Hop": 35, "Electronic": 15, "Jazz": -5, "Classical": 5}
phase_by_genre = {
    "Pop": 0,
    "Rock": np.pi / 3,
    "Hip-Hop": np.pi / 2,
    "Electronic": np.pi,
    "Jazz": np.pi / 4,
    "Classical": 3 * np.pi / 2,
}
amplitude_by_genre = {"Pop": 30, "Rock": 15, "Hip-Hop": 25, "Electronic": 35, "Jazz": 10, "Classical": 8}

data = []
for genre in genres:
    base = base_by_genre[genre]
    trend = np.linspace(0, trend_by_genre[genre], 24)  # genre-specific growth or decline
    seasonal = amplitude_by_genre[genre] * np.sin(np.linspace(0, 4 * np.pi, 24) + phase_by_genre[genre])
    noise = np.random.randn(24).cumsum() * 5
    values = base + trend + seasonal + noise
    values = np.maximum(values, 10)  # Ensure positive values
    for i, month in enumerate(months):
        data.append({"time": month, "category": genre, "value": values[i]})

df = pd.DataFrame(data)

title = "streamgraph-basic · python · altair · anyplot.ai"

# Create streamgraph using area mark with center baseline (stack='center')
chart = (
    alt.Chart(df)
    .mark_area(
        interpolate="basis",  # Basis spline for smooth flowing curves
        opacity=0.9,
    )
    .encode(
        x=alt.X("time:T", title="Time", axis=alt.Axis(format="%b %Y", labelAngle=-45)),
        y=alt.Y(
            "value:Q",
            title="Streaming Hours (millions)",
            stack="center",  # Center baseline for streamgraph aesthetic
            axis=alt.Axis(labels=False, ticks=False),  # Hide y-axis labels for streamgraph aesthetic
        ),
        color=alt.Color(
            "category:N",
            title="Genre",
            scale=alt.Scale(domain=genres, range=IMPRINT_PALETTE),
            legend=alt.Legend(orient="right"),
        ),
        order=alt.Order("category:N"),
        tooltip=["time:T", "category:N", alt.Tooltip("value:Q", format=".1f")],
    )
    .properties(
        width=620, height=320, background=PAGE_BG, title=alt.Title(title, fontSize=16, anchor="middle", color=INK)
    )
    .configure_view(continuousWidth=620, continuousHeight=320, fill=PAGE_BG, strokeWidth=0)
    .configure_axis(
        grid=False,
        domainColor=INK_SOFT,
        tickColor=INK_SOFT,
        labelColor=INK_SOFT,
        titleColor=INK,
        labelFontSize=10,
        titleFontSize=12,
    )
    .configure_legend(
        fillColor=ELEVATED_BG,
        strokeColor=INK_SOFT,
        labelColor=INK_SOFT,
        titleColor=INK,
        labelFontSize=10,
        titleFontSize=10,
    )
)

# Save as PNG, then pad to the exact canonical canvas (3200x1800)
chart.save(f"plot-{THEME}.png", scale_factor=4.0)

TW, TH = 3200, 1800
_img = Image.open(f"plot-{THEME}.png").convert("RGB")
_w, _h = _img.size
if _w > TW or _h > TH:
    raise SystemExit(
        f"altair vl-convert produced {_w}x{_h}, exceeds target {TW}x{TH}. "
        f"Shrink chart .properties(width=, height=) values and re-render."
    )
if _w < TW or _h < TH:
    _canvas = Image.new("RGB", (TW, TH), PAGE_BG)
    _canvas.paste(_img, ((TW - _w) // 2, (TH - _h) // 2))
    _canvas.save(f"plot-{THEME}.png")

# Save interactive HTML version
chart.interactive().save(f"plot-{THEME}.html")
Runnable source as JSON, for any HTTP client: https://api.anyplot.ai/specs/streamgraph-basic/altair/code. Any spec id and library id listed in llms-full.txt fit the same URL shape; every URL below is complete and callable.
{
  "spec_id": "streamgraph-basic",
  "language": "python",
  "library": "altair",
  "page": "https://anyplot.ai/streamgraph-basic/python/altair",
  "hub": "https://anyplot.ai/streamgraph-basic",
  "code_json": "https://api.anyplot.ai/specs/streamgraph-basic/altair/code",
  "spec_json": "https://api.anyplot.ai/specs/streamgraph-basic",
  "render_light_png": "https://storage.googleapis.com/anyplot-images/plots/streamgraph-basic/python/altair/plot-light.png",
  "render_dark_png": "https://storage.googleapis.com/anyplot-images/plots/streamgraph-basic/python/altair/plot-dark.png",
  "interactive_light_html": "https://storage.googleapis.com/anyplot-images/plots/streamgraph-basic/python/altair/plot-light.html",
  "interactive_dark_html": "https://storage.googleapis.com/anyplot-images/plots/streamgraph-basic/python/altair/plot-dark.html",
  "quality_score": 90.0,
  "license": "MIT",
  "guide": "https://anyplot.ai/llms.txt"
}
Part of Basic Stream Graph on anyplot.ai.