The same plot in 14 other libraries — JavaScript: Chart.js, D3.js, Apache ECharts, MUI X Charts; Python: Altair, Bokeh, lets-plot, Matplotlib, Plotly, plotnine, Pygal, Seaborn; R: ggplot2; Julia: Makie.jl. Compare all 15 side by side: Basic Stream Graph in Python, R, Julia and JavaScript.
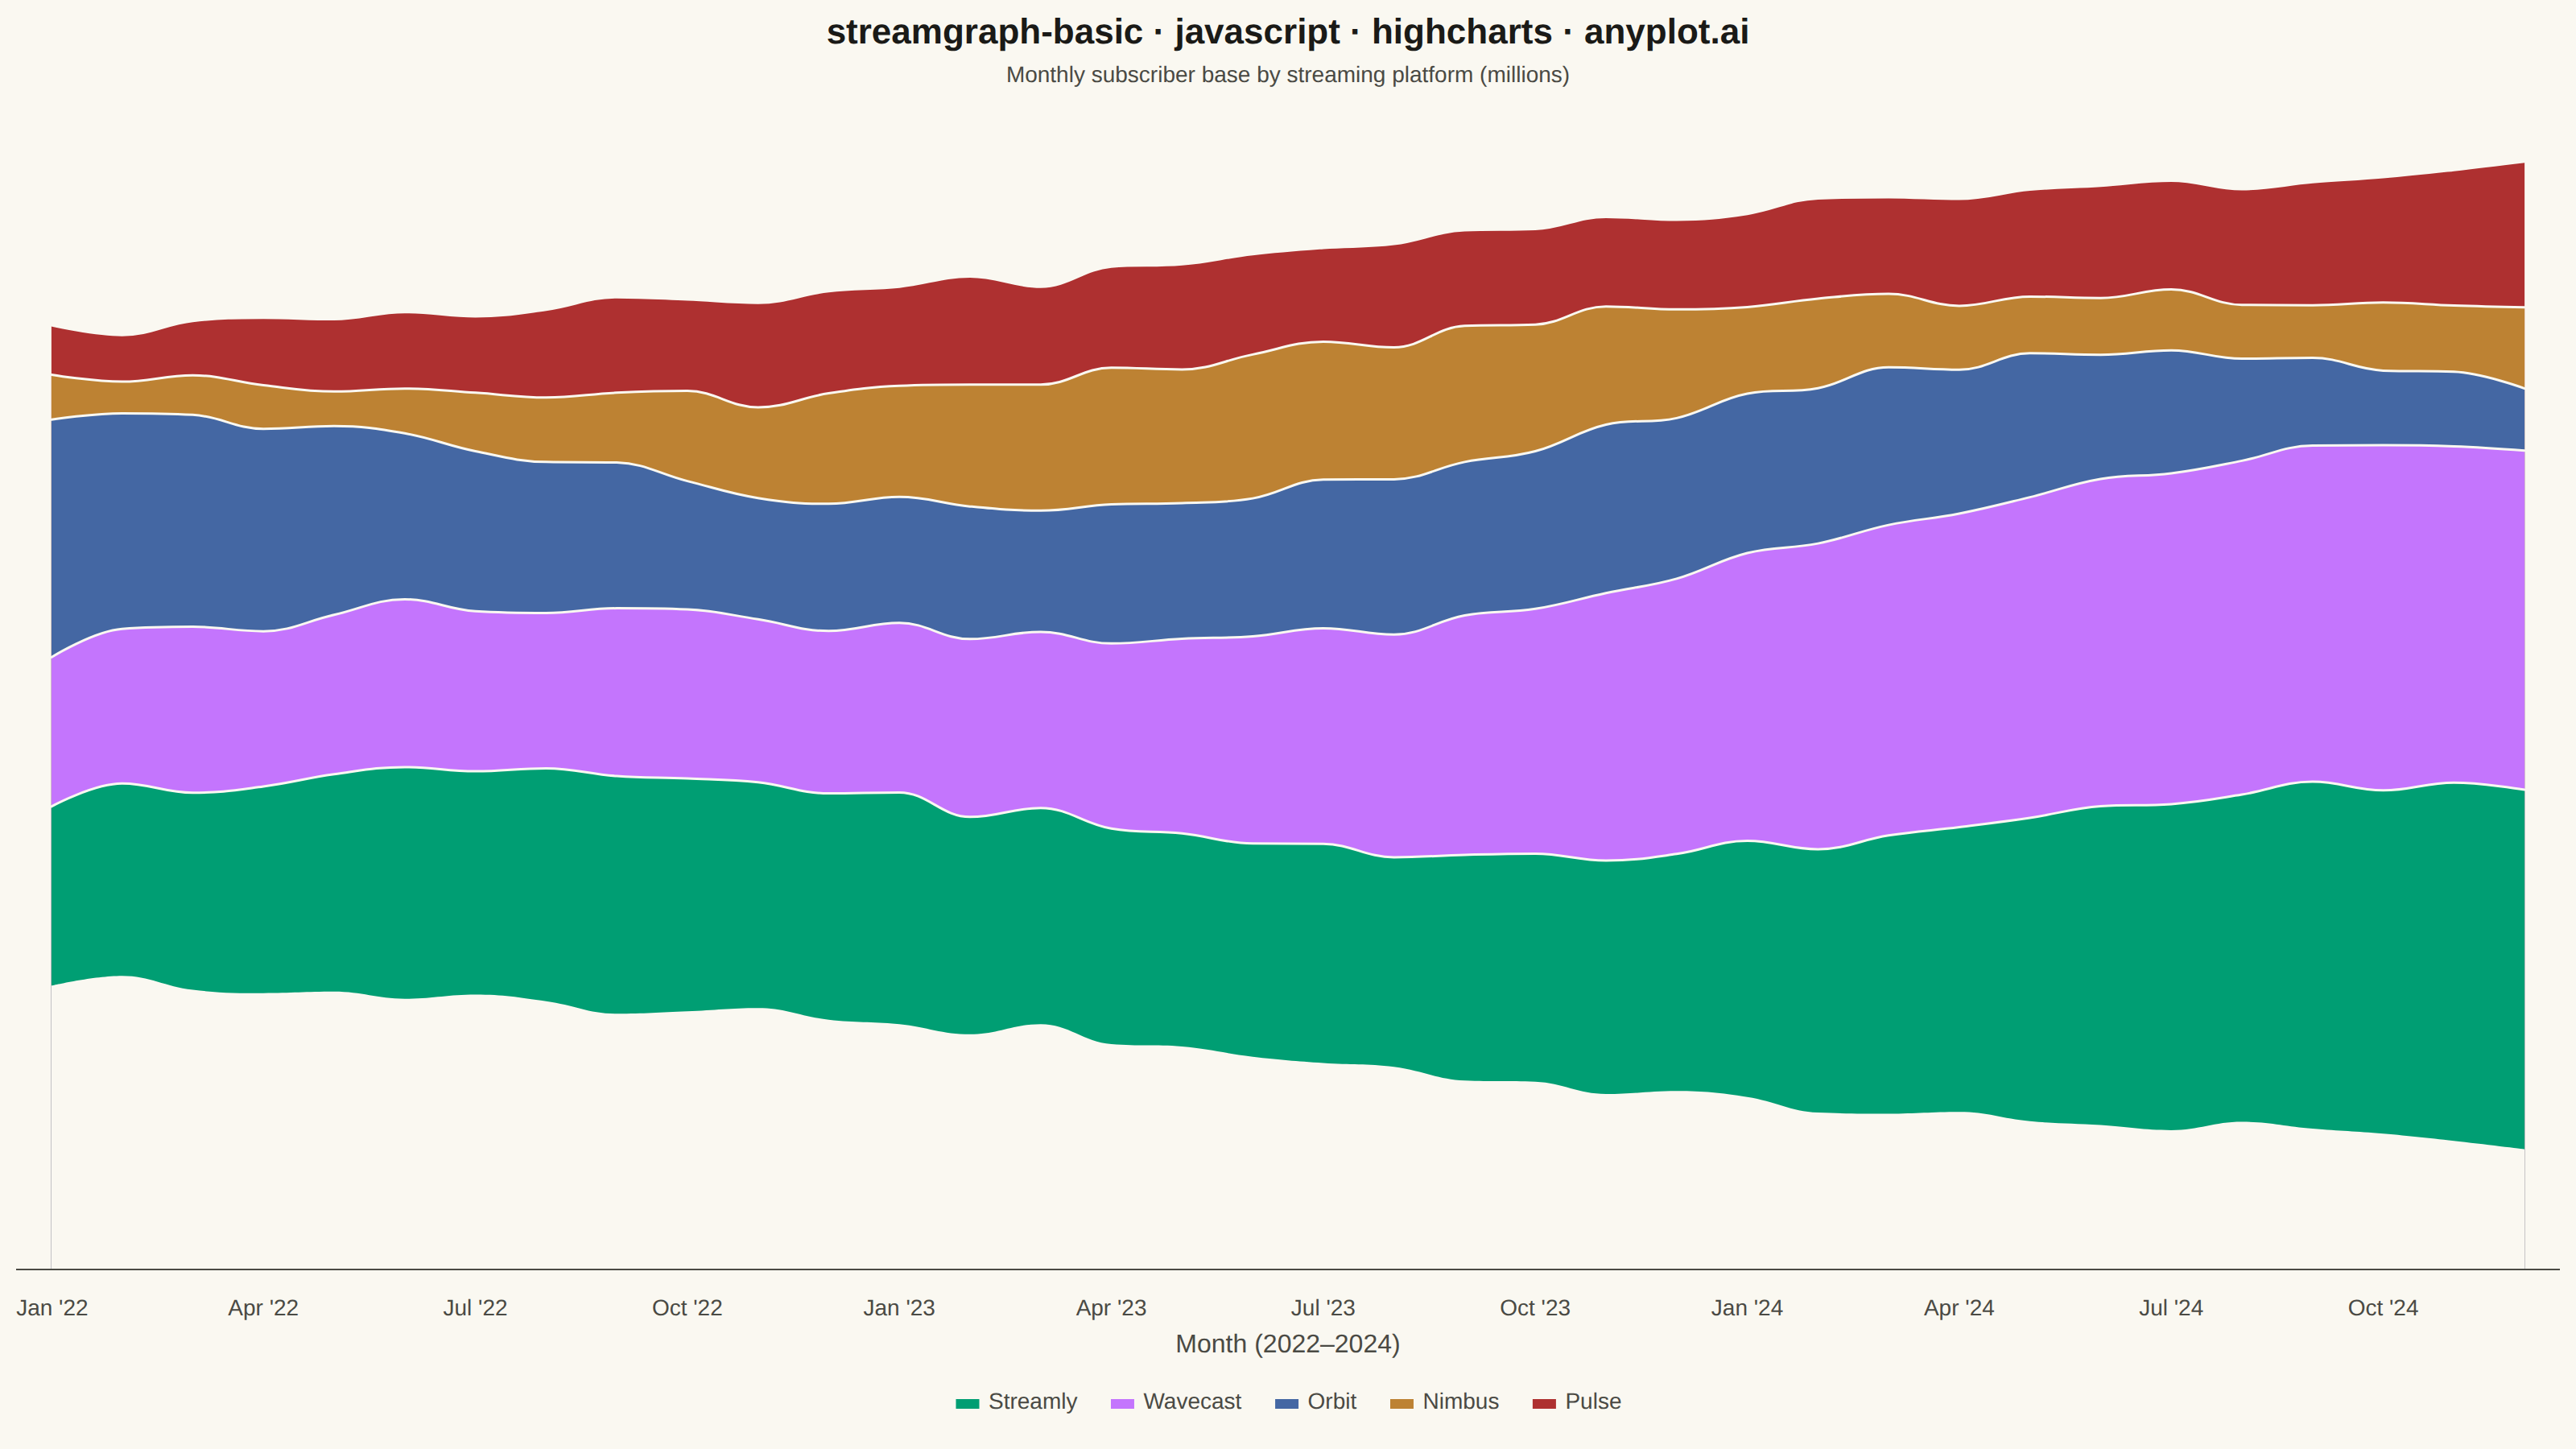
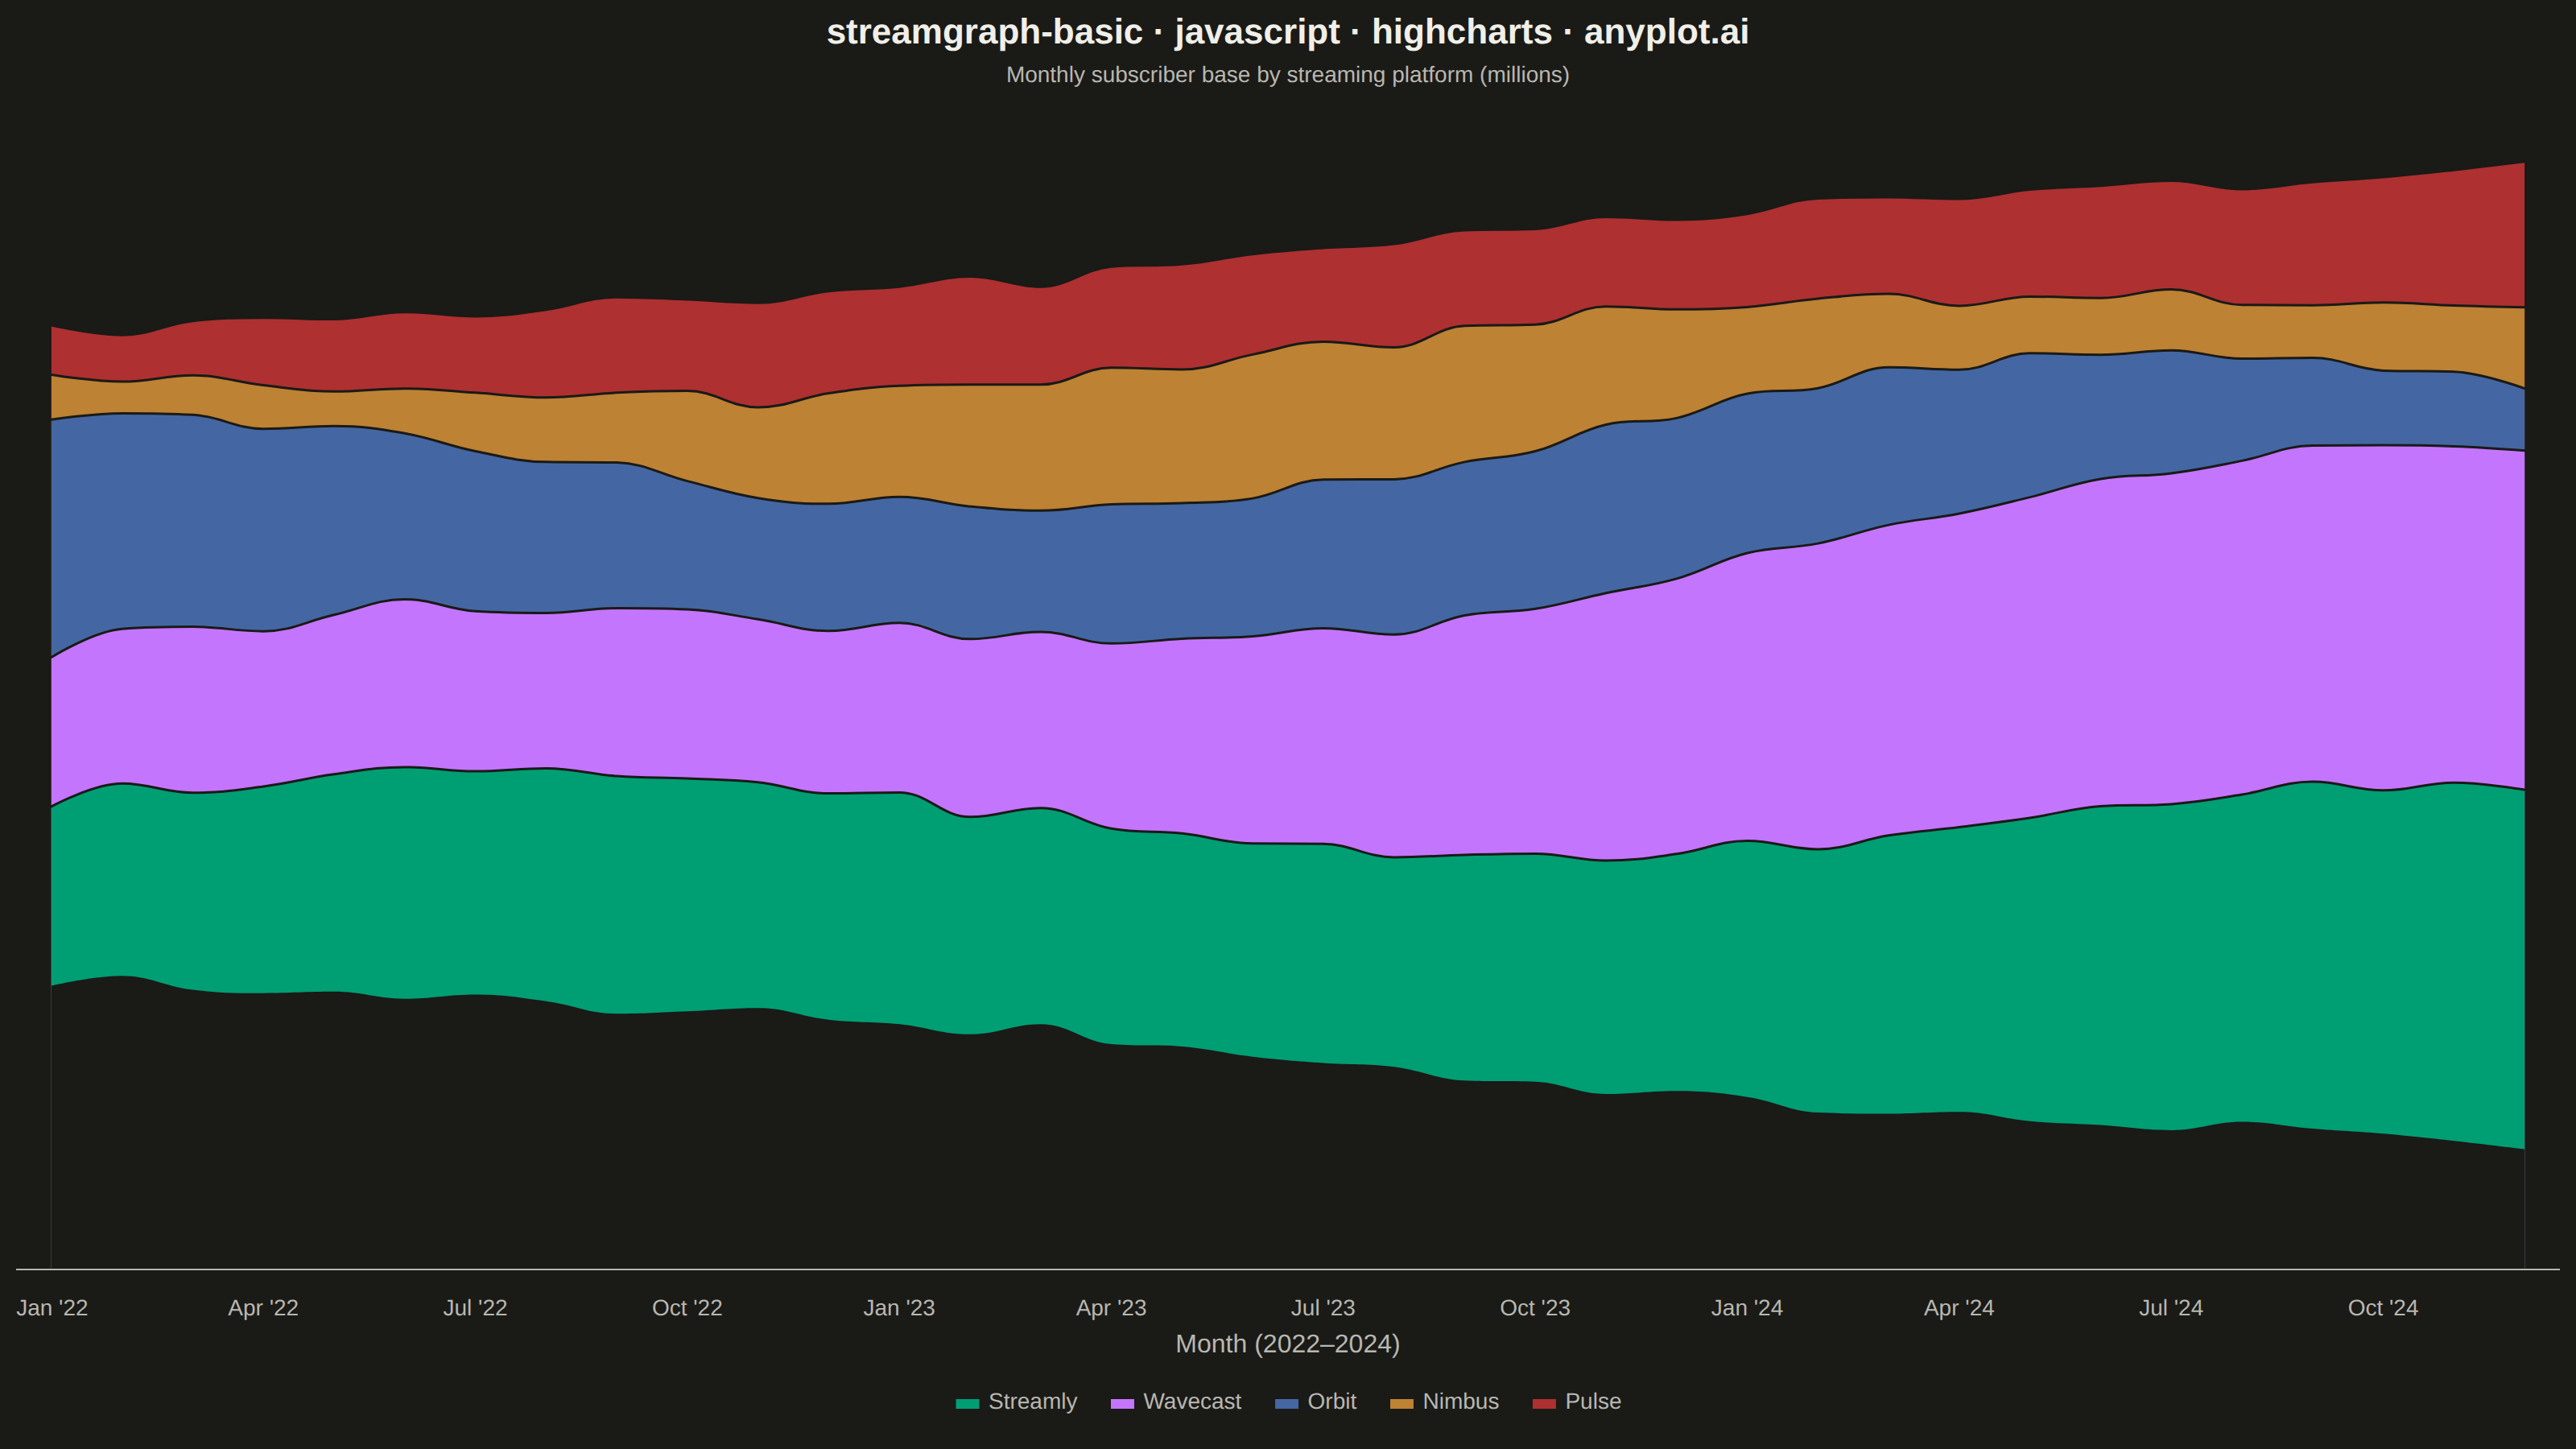
A streamgraph (also known as a stacked area chart with a centered baseline) displaying the composition of multiple categories over time with smooth, flowing curves. Unlike traditional stacked area charts, streamgraphs use a symmetric baseline centered around the x-axis, creating an organic, river-like appearance that emphasizes the overall shape and relative proportions of each category while minimizing the visual distortion of individual layers.
// anyplot.ai
// streamgraph-basic: Basic Stream Graph
// Library: highcharts 12.6.0 | JavaScript 22.23.1
// Quality: 87/100 | Created: 2026-08-05
//# anyplot-orientation: landscape

const t = window.ANYPLOT_TOKENS;

// --- Data (in-memory, deterministic) ----------------------------------------
// Monthly subscriber base (millions) for 5 streaming platforms over 3 years —
// some rise, some fade, one is flat, so the stack shows genuine hand-off
// between layers instead of everything drifting in the same direction.
const platforms = ["Streamly", "Wavecast", "Orbit", "Nimbus", "Pulse"];
const monthCount = 36;
const monthLabels = [];
for (let m = 0; m < monthCount; m++) {
  const year = 2022 + Math.floor(m / 12);
  const label = new Date(Date.UTC(year, m % 12, 1)).toLocaleString("en-US", {
    month: "short",
  });
  monthLabels.push(`${label} '${String(year).slice(2)}`);
}

// Small deterministic LCG so the wobble is reproducible without a real RNG.
let seed = 42;
function rand() {
  seed = (seed * 1103515245 + 12345) % 2147483648;
  return seed / 2147483648;
}

const platformParams = [
  { base: 28, trend: 0.75, amp: 6, phase: 0.3 }, // Streamly — steady grower
  { base: 20, trend: 1.05, amp: 5, phase: 1.6 }, // Wavecast — fast riser
  { base: 34, trend: -0.55, amp: 7, phase: 2.4 }, // Orbit — fading incumbent
  { base: 14, trend: 0.1, amp: 8, phase: 4.2 }, // Nimbus — seasonal, flat trend
  { base: 10, trend: 0.35, amp: 3, phase: 5.4 }, // Pulse — small, slow climb
];

const seriesData = platformParams.map(() => []);
for (let m = 0; m < monthCount; m++) {
  platformParams.forEach((p, i) => {
    const seasonal = p.amp * Math.sin(m / 4.5 + p.phase);
    const noise = (rand() - 0.5) * 2.5;
    const value = Math.max(2, p.base + p.trend * m + seasonal + noise);
    seriesData[i].push(Math.round(value * 10) / 10);
  });
}

// --- Streamgraph geometry ------------------------------------------------
// Only the core Highcharts bundle is loaded (no streamgraph/arearange
// module), and plain `stacking: 'normal'` cannot combine a negative offset
// series with positive-valued series into one continuous stack — it keeps
// positive and negative stacks separate. So the true symmetric envelope is
// computed by hand: `baseline[m]` is -total(m)/2 and `cumTop[i][m]` is the
// running top edge after stacking platforms 0..i on top of that baseline.
// Each platform is then drawn as its own NON-stacked areaspline reaching
// from a shared low threshold up to cumTop[i], largest cumulative first so
// each later (smaller-cumulative) layer opaquely nests over it — only the
// thin strip between two consecutive cumulative curves stays visible, and
// that strip is exactly that platform's value. A final background-colored
// mask layer then erases the region below the wiggling baseline so the
// bottom edge moves with the total too, not just the top.
const baseline = [];
const cumTop = platforms.map(() => []);
for (let m = 0; m < monthCount; m++) {
  let total = 0;
  for (let i = 0; i < seriesData.length; i++) total += seriesData[i][m];
  const base = -total / 2;
  baseline.push(base);
  let running = base;
  for (let i = 0; i < seriesData.length; i++) {
    running += seriesData[i][m];
    cumTop[i].push(Math.round(running * 100) / 100);
  }
}
const lowThreshold = Math.min(...baseline) - 20;

// zIndex (not array order) controls paint order here: the platform with the
// largest cumulative (i = platforms.length - 1, the running total of all of
// them) must paint behind everything else, and each smaller cumulative
// paints progressively in front of it, ending with platform 0 frontmost.
const bandSeries = platforms.map((name, i) => ({
  name,
  color: t.palette[i],
  data: cumTop[i].map((y, m) => ({ y, custom: { actual: seriesData[i][m] } })),
  zIndex: platforms.length - i,
}));

const maskSeries = {
  name: "__baseline_mask__",
  data: baseline,
  color: t.pageBg,
  lineWidth: 0,
  fillOpacity: 1,
  enableMouseTracking: false,
  showInLegend: false,
  zIndex: platforms.length + 1,
};

// --- Chart -------------------------------------------------------------------
Highcharts.chart("container", {
  chart: {
    type: "areaspline",
    backgroundColor: "transparent",
    animation: false,
    style: { fontFamily: "inherit" },
  },
  credits: { enabled: false },
  title: {
    text: "streamgraph-basic · javascript · highcharts · anyplot.ai",
    style: { color: t.ink, fontSize: "22px", fontWeight: "600" },
  },
  subtitle: {
    text: "Monthly subscriber base by streaming platform (millions)",
    style: { color: t.inkSoft, fontSize: "14px" },
  },
  xAxis: {
    categories: monthLabels,
    tickInterval: 3,
    lineColor: t.inkSoft,
    tickColor: t.inkSoft,
    gridLineColor: "transparent",
    labels: { style: { color: t.inkSoft, fontSize: "14px" } },
    title: {
      text: "Month (2022–2024)",
      style: { color: t.inkSoft, fontSize: "16px" },
    },
  },
  yAxis: {
    visible: false,
    startOnTick: false,
    endOnTick: false,
  },
  legend: {
    itemStyle: { color: t.inkSoft, fontSize: "14px" },
    itemHoverStyle: { color: t.ink },
  },
  tooltip: {
    shared: false,
    formatter: function () {
      return `<b>${this.x}</b><br/><span style="color:${this.color}">●</span> ${this.series.name}: <b>${this.point.custom.actual}M</b> subscribers`;
    },
  },
  plotOptions: {
    series: {
      animation: false,
      marker: { enabled: false },
      lineWidth: 1.5,
      lineColor: t.pageBg,
      threshold: lowThreshold,
      fillOpacity: 1,
    },
  },
  series: [...bandSeries, maskSeries],
});
Runnable source as JSON, for any HTTP client: https://api.anyplot.ai/specs/streamgraph-basic/highcharts/code. Any spec id and library id listed in llms-full.txt fit the same URL shape; every URL below is complete and callable.
{
  "spec_id": "streamgraph-basic",
  "language": "javascript",
  "library": "highcharts",
  "page": "https://anyplot.ai/streamgraph-basic/javascript/highcharts",
  "hub": "https://anyplot.ai/streamgraph-basic",
  "code_json": "https://api.anyplot.ai/specs/streamgraph-basic/highcharts/code",
  "spec_json": "https://api.anyplot.ai/specs/streamgraph-basic",
  "render_light_png": "https://storage.googleapis.com/anyplot-images/plots/streamgraph-basic/javascript/highcharts/plot-light.png",
  "render_dark_png": "https://storage.googleapis.com/anyplot-images/plots/streamgraph-basic/javascript/highcharts/plot-dark.png",
  "interactive_light_html": "https://storage.googleapis.com/anyplot-images/plots/streamgraph-basic/javascript/highcharts/plot-light.html",
  "interactive_dark_html": "https://storage.googleapis.com/anyplot-images/plots/streamgraph-basic/javascript/highcharts/plot-dark.html",
  "quality_score": 87.0,
  "license": "MIT",
  "guide": "https://anyplot.ai/llms.txt"
}
Part of Basic Stream Graph on anyplot.ai.