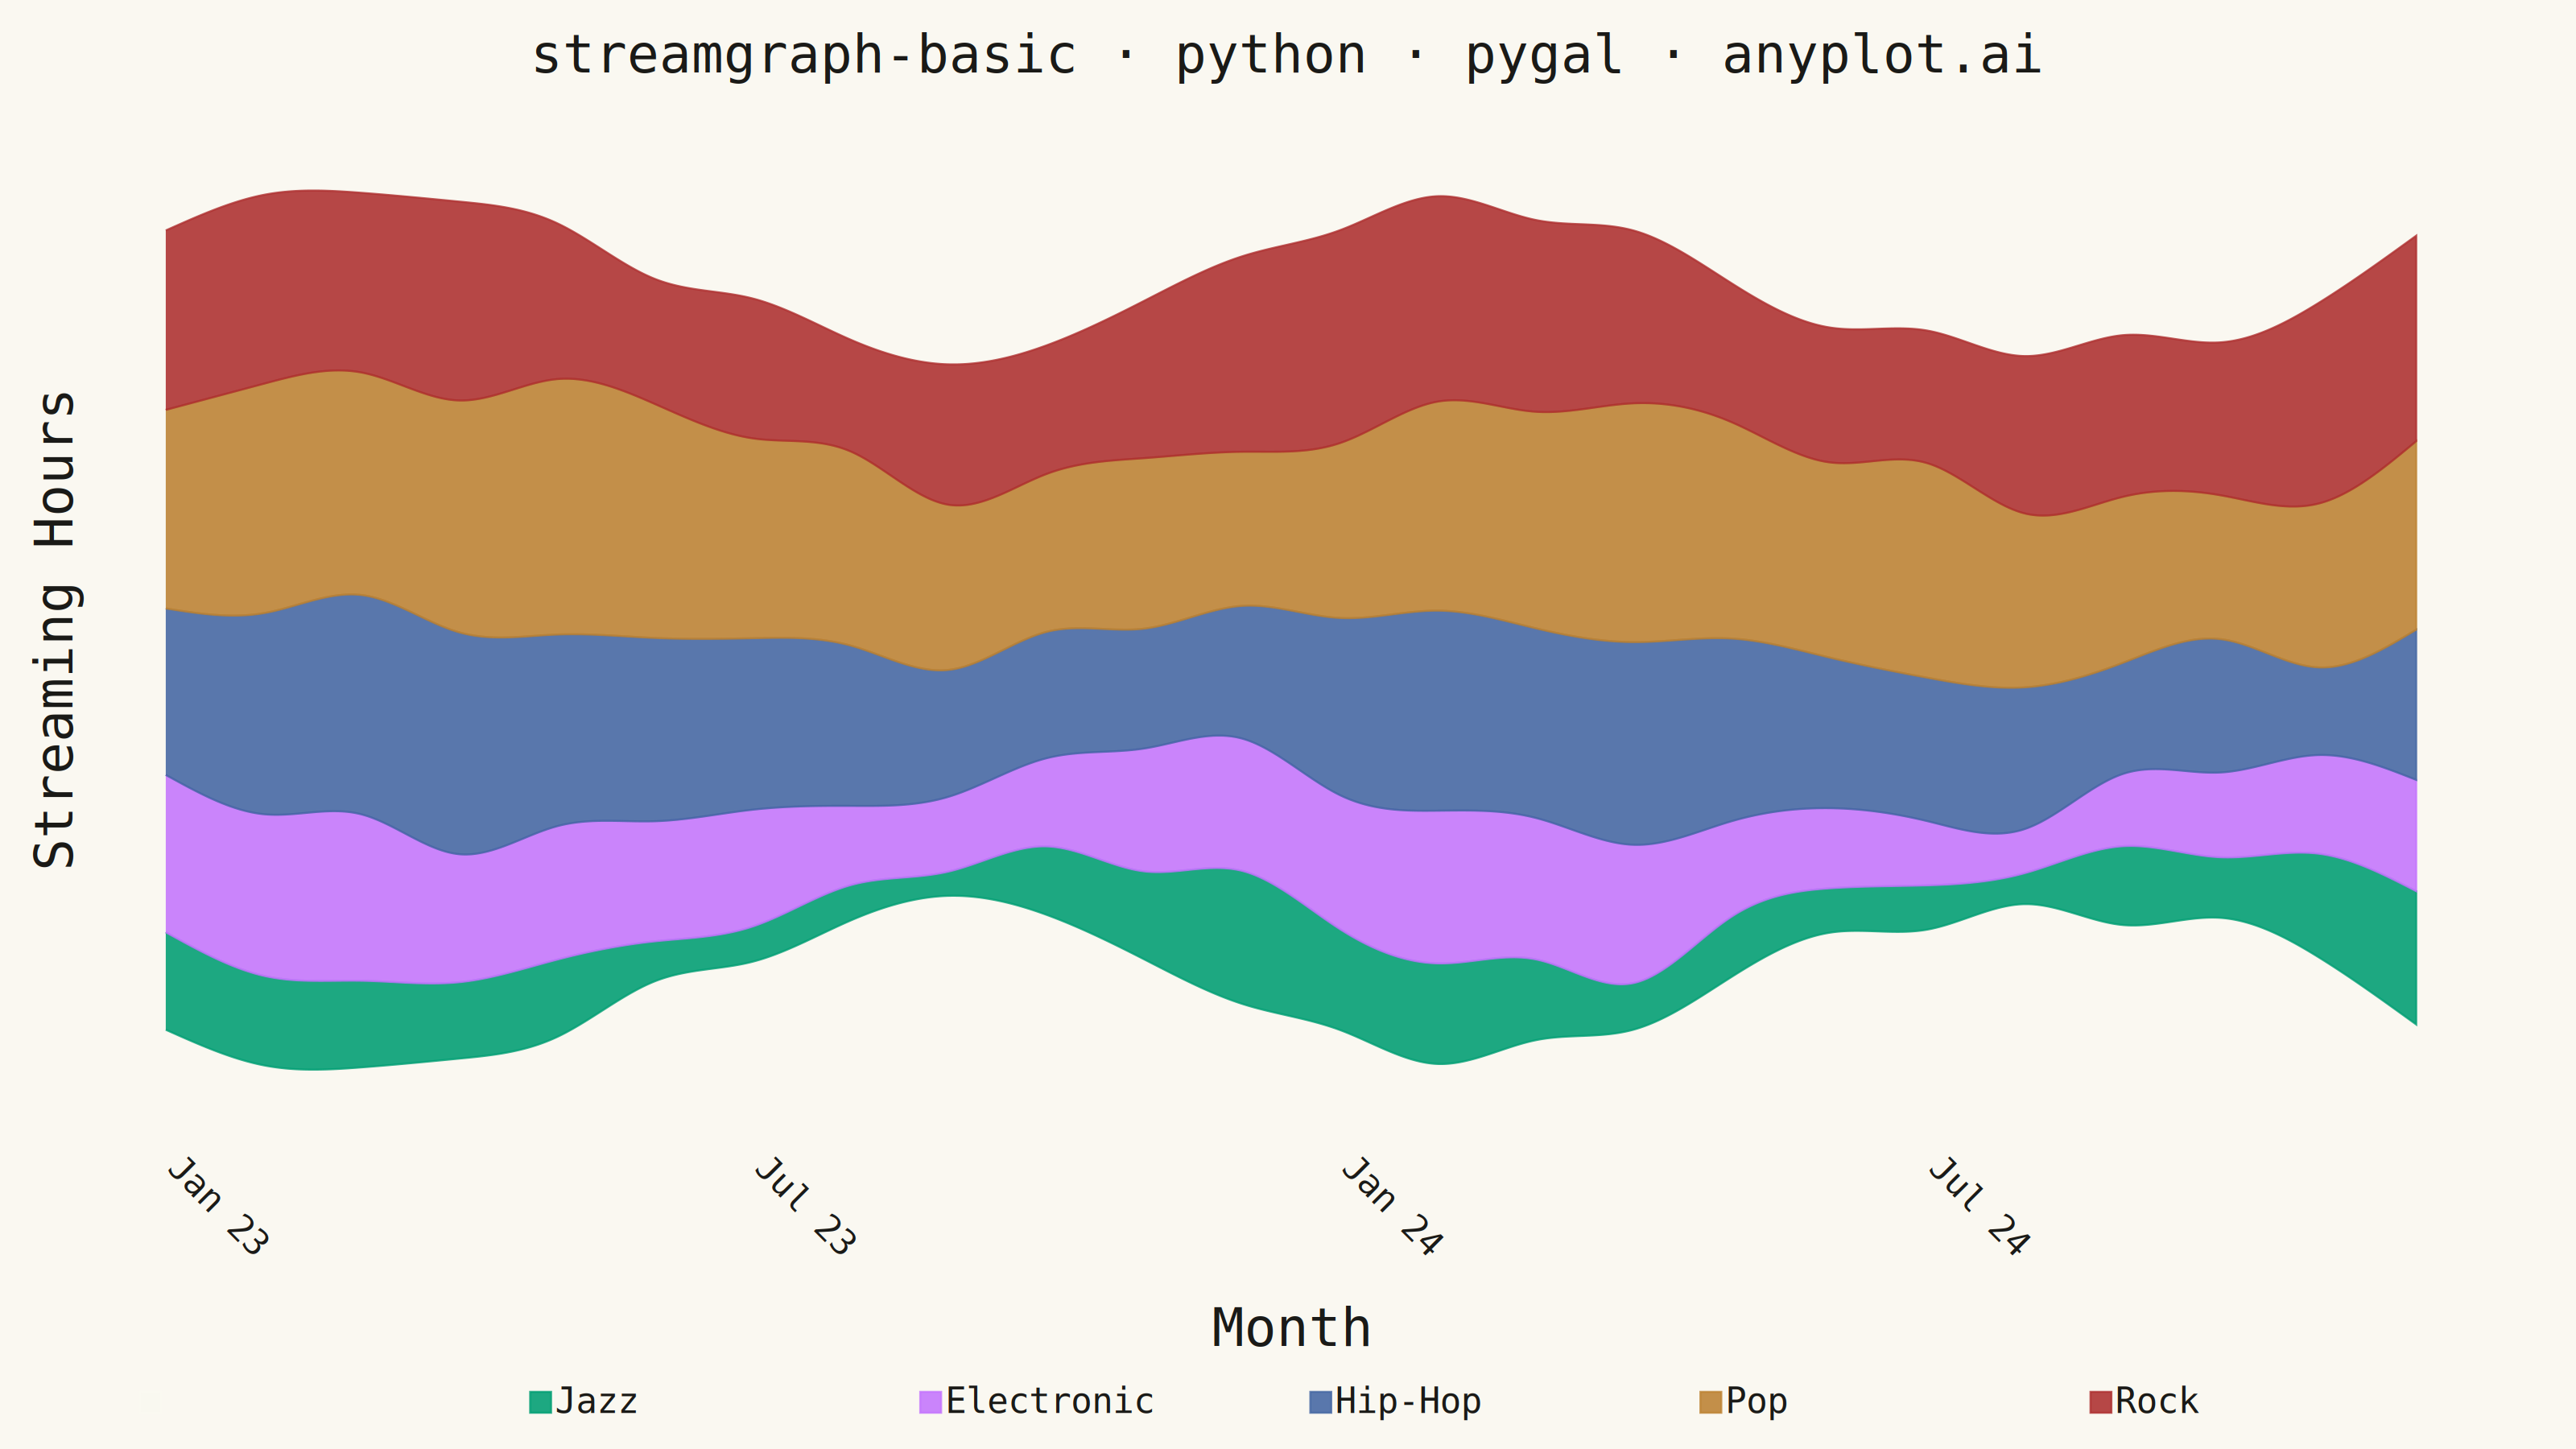
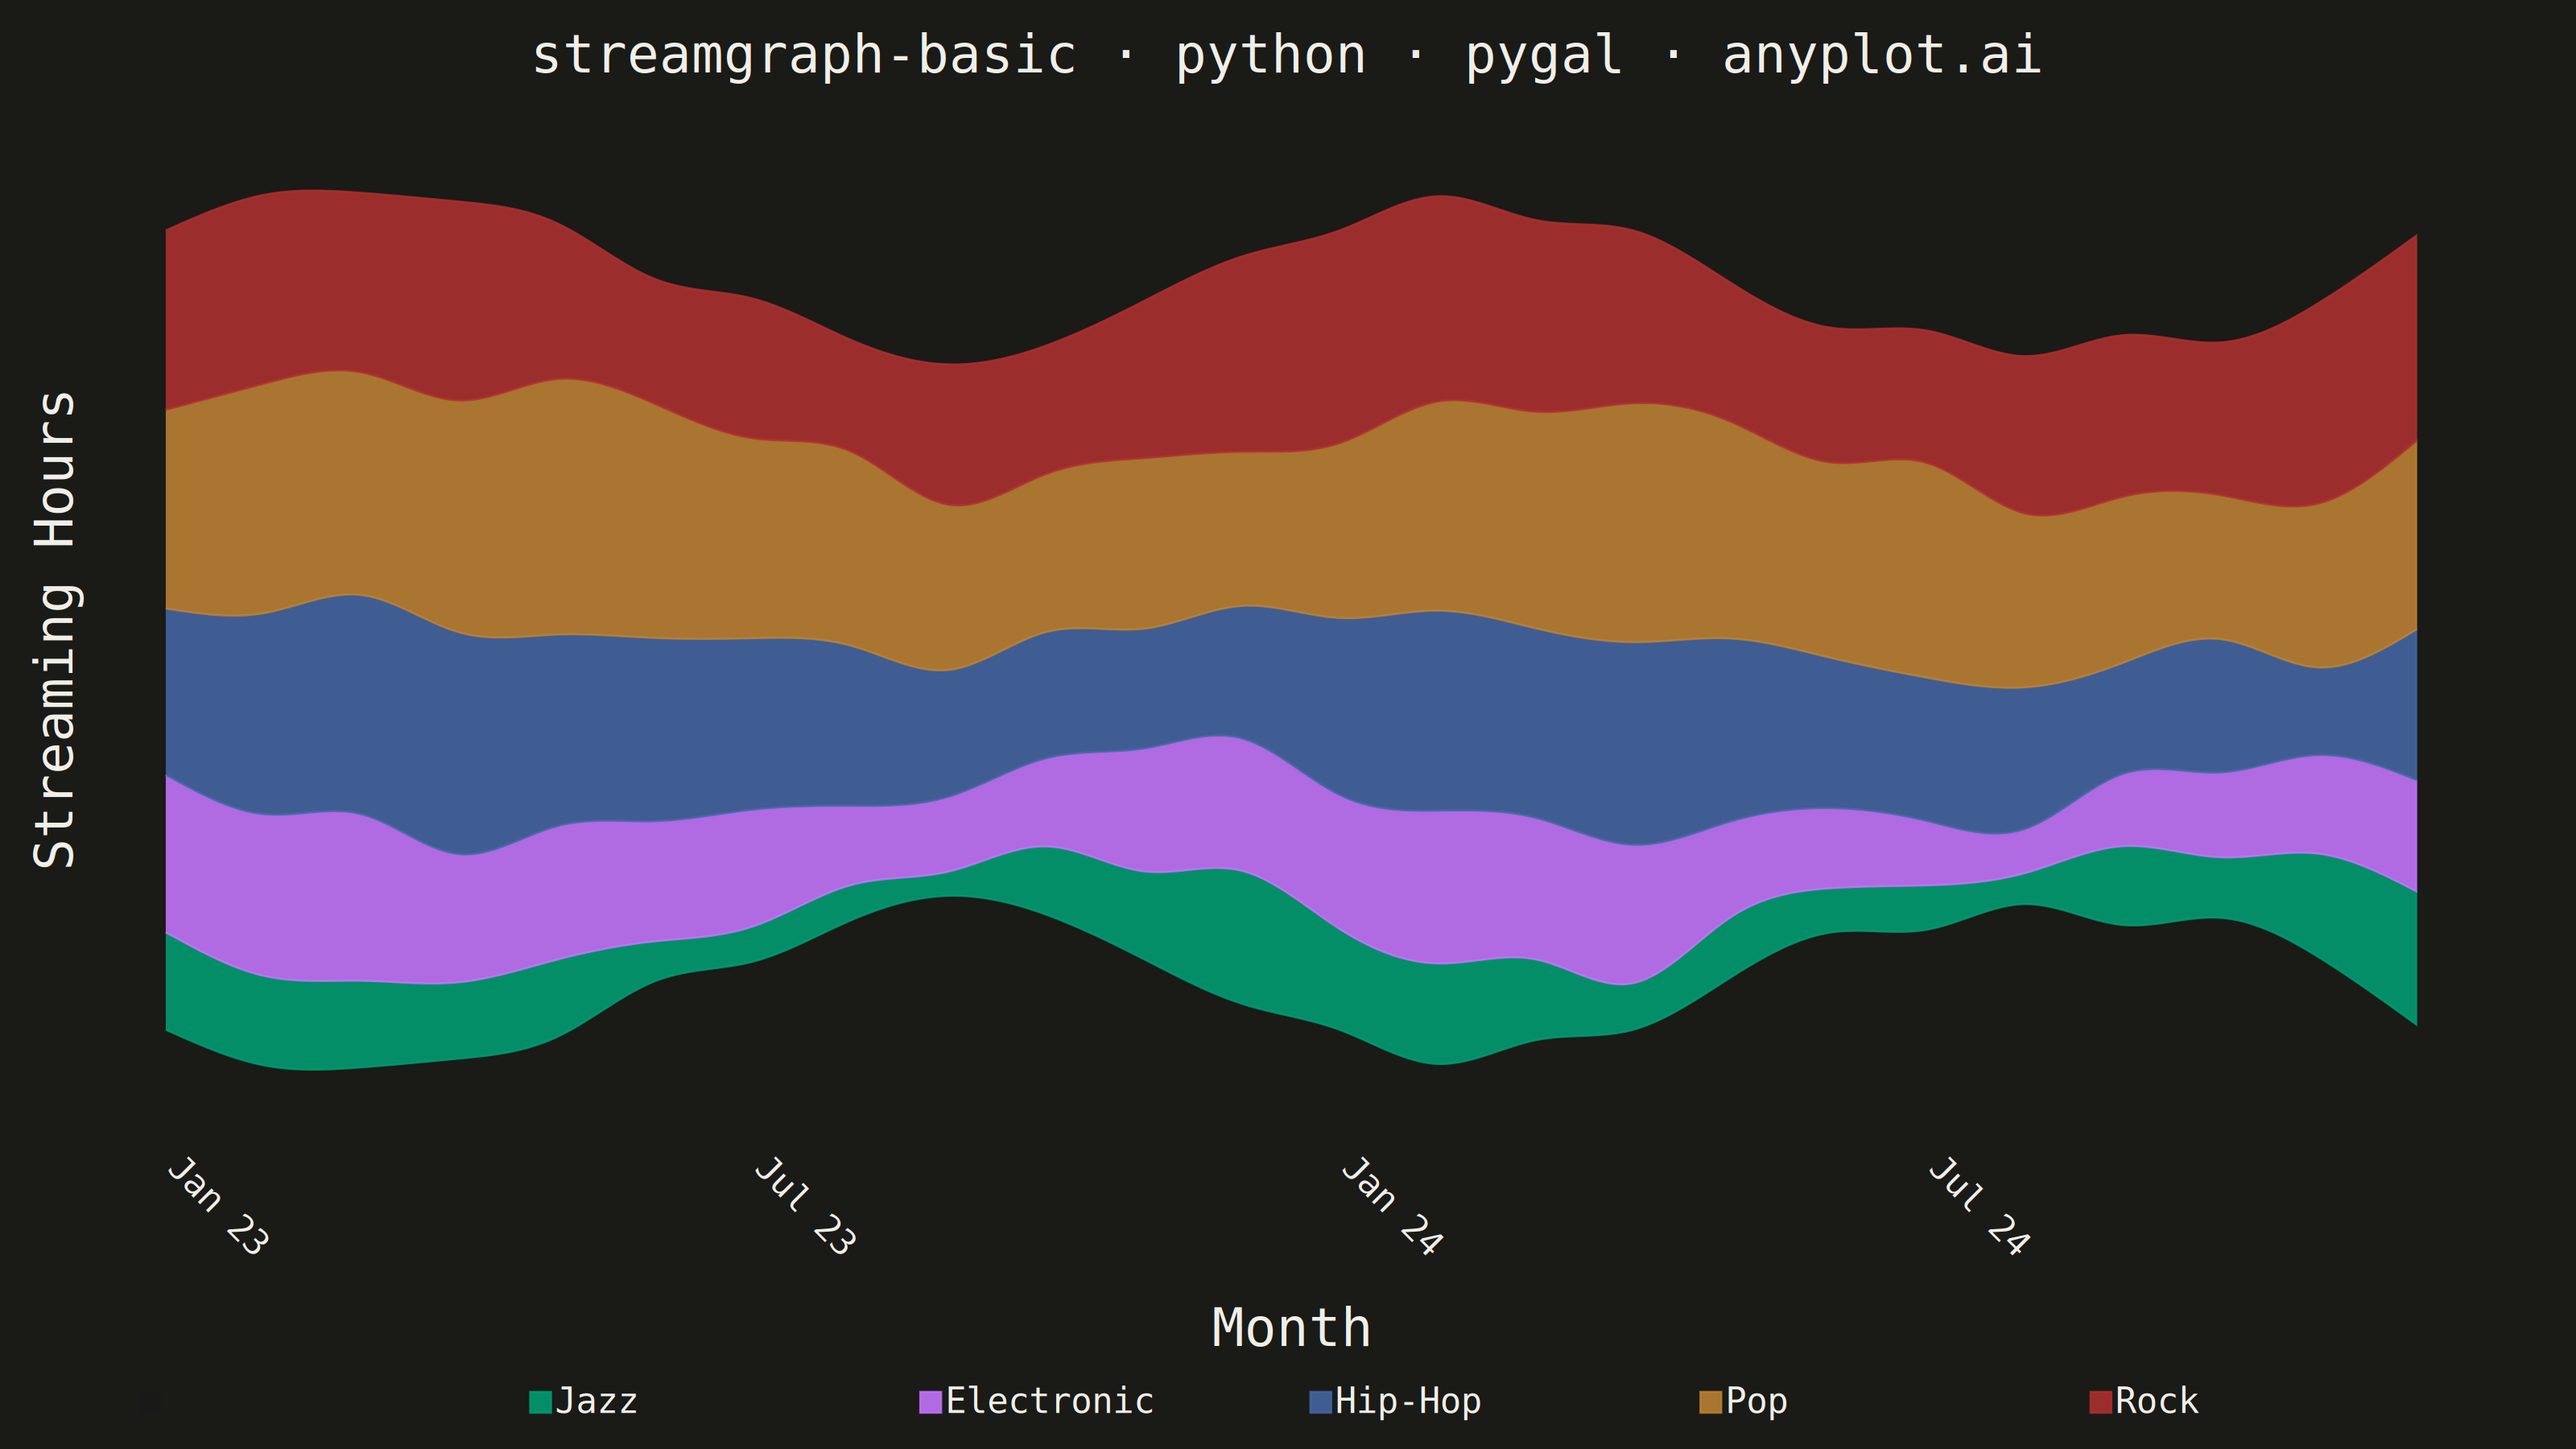
A streamgraph (also known as a stacked area chart with a centered baseline) displaying the composition of multiple categories over time with smooth, flowing curves. Unlike traditional stacked area charts, streamgraphs use a symmetric baseline centered around the x-axis, creating an organic, river-like appearance that emphasizes the overall shape and relative proportions of each category while minimizing the visual distortion of individual layers.
""" anyplot.ai
streamgraph-basic: Basic Stream Graph
Library: pygal 3.1.3 | Python 3.13.14
Quality: 91/100 | Updated: 2026-08-05
"""

import os
import sys


# Remove script directory from sys.path so 'import pygal' finds the installed package
_script_dir = os.path.dirname(os.path.abspath(__file__))
sys.path = [p for p in sys.path if os.path.abspath(p) != _script_dir]

import numpy as np
import pygal
from pygal.style import Style


# Theme tokens
THEME = os.getenv("ANYPLOT_THEME", "light")
PAGE_BG = "#FAF8F1" if THEME == "light" else "#1A1A17"
INK = "#1A1A17" if THEME == "light" else "#F0EFE8"
INK_SOFT = "#4A4A44" if THEME == "light" else "#B8B7B0"
INK_MUTED = "#6B6A63" if THEME == "light" else "#A8A79F"

IMPRINT_PALETTE = ["#009E73", "#C475FD", "#4467A3", "#BD8233", "#AE3030"]

# Prepend background color for the invisible baseline series, then Imprint for genres
COLORS = [PAGE_BG] + IMPRINT_PALETTE

# Data: monthly streaming hours by music genre over two years
np.random.seed(42)

months = 24
month_labels = [
    "Jan 23",
    "Feb 23",
    "Mar 23",
    "Apr 23",
    "May 23",
    "Jun 23",
    "Jul 23",
    "Aug 23",
    "Sep 23",
    "Oct 23",
    "Nov 23",
    "Dec 23",
    "Jan 24",
    "Feb 24",
    "Mar 24",
    "Apr 24",
    "May 24",
    "Jun 24",
    "Jul 24",
    "Aug 24",
    "Sep 24",
    "Oct 24",
    "Nov 24",
    "Dec 24",
]
genres = ["Pop", "Rock", "Hip-Hop", "Electronic", "Jazz"]
base_values = {"Pop": 45, "Rock": 35, "Hip-Hop": 40, "Electronic": 30, "Jazz": 15}

raw_series = {}
for genre in genres:
    base = base_values[genre]
    trend = np.linspace(0, np.random.uniform(-10, 15), months)
    seasonal = 8 * np.sin(np.linspace(0, 4 * np.pi, months) + np.random.uniform(0, 2 * np.pi))
    noise = np.random.randn(months) * 3
    values = base + trend + seasonal + noise
    values = np.maximum(values, 5)
    raw_series[genre] = values

# Inside-out layer ordering (Byron & Wattenberg): the genre with the widest
# peak-to-trough swing sits in the visual center, with progressively calmer
# genres nested outward on alternating sides. This minimizes the stream's
# overall "wiggle" and gives the eye a natural focal point instead of an
# arbitrary stacking order.
swing = {genre: raw_series[genre].max() - raw_series[genre].min() for genre in genres}
ranked = sorted(genres, key=lambda g: swing[g], reverse=True)
ordered = [None] * len(ranked)
left, right = len(ranked) // 2, len(ranked) // 2
for i, genre in enumerate(ranked):
    if i == 0:
        ordered[left] = genre
    elif i % 2 == 1:
        left -= 1
        ordered[left] = genre
    else:
        right += 1
        ordered[right] = genre
genres = ordered
data = {genre: raw_series[genre].tolist() for genre in genres}

# The genre with the strongest net growth (Dec 24 vs Jan 23) is the one worth
# drawing the eye to — give it a bolder stroke while the rest stay at the
# shared baseline weight.
growth = {genre: raw_series[genre][-1] - raw_series[genre][0] for genre in genres}
featured_genre = max(growth, key=growth.get)

# True streamgraph baseline: center the entire stack symmetrically around y=0.
# baseline[t] = -total[t]/2 so the stack spans from -total/2 to +total/2.
data_array = np.array([data[genre] for genre in genres])
total_at_each_time = data_array.sum(axis=0)
baseline = (-total_at_each_time / 2).tolist()

# Symmetric y-axis range with a small margin
half_total_max = total_at_each_time.max() / 2
y_range = half_total_max * 1.12

# Style
custom_style = Style(
    background=PAGE_BG,
    plot_background=PAGE_BG,
    foreground=INK,
    foreground_strong=INK,
    foreground_subtle=INK_MUTED,
    colors=COLORS,
    title_font_size=66,
    label_font_size=56,
    major_label_font_size=44,
    legend_font_size=44,
    value_font_size=36,
    stroke_width=2.5,
    opacity=0.88,
    opacity_hover=0.95,
)

# Chart
# The centered baseline has no absolute meaning (it's an invisible offset,
# not a real per-genre value), so per streamgraph convention the y-axis
# ticks/gridlines are hidden entirely (show_y_labels=False) rather than
# showing numbers a viewer could misread as actual streaming hours.
# pygal always renders a solid, non-hideable "major line" at the position-0
# x tick regardless of show_x_guides, which left a stray vertical line at
# the first month; the inline CSS override below removes it for a
# chrome-free streamgraph look.
chart = pygal.StackedLine(
    width=3200,
    height=1800,
    title="streamgraph-basic · python · pygal · anyplot.ai",
    x_title="Month",
    y_title="Streaming Hours",
    style=custom_style,
    fill=True,
    show_dots=False,
    show_y_guides=False,
    show_y_labels=False,
    show_x_guides=False,
    legend_at_bottom=True,
    legend_at_bottom_columns=len(genres) + 1,
    legend_box_size=26,
    margin=60,
    spacing=24,
    truncate_legend=-1,
    truncate_label=-1,
    interpolate="cubic",
    show_minor_x_labels=False,
    x_label_rotation=45,
    range=(-y_range, y_range),
    css=("file://style.css", "file://graph.css", "inline:.axis.x .line { opacity: 0; }"),
)

chart.x_labels = month_labels
chart.x_labels_major = ["Jan 23", "Jul 23", "Jan 24", "Jul 24"]

# Invisible baseline series shifts the stack so genres span -total/2 to +total/2.
# Color matches background (PAGE_BG) so it renders as transparent.
chart.add("", baseline)

# Genre series added in inside-out order; the featured (fastest-growing) genre
# gets a heavier stroke to act as the streamgraph's focal point.
for genre in genres:
    if genre == featured_genre:
        chart.add(genre, data[genre], stroke_style={"width": 4.5})
    else:
        chart.add(genre, data[genre])

# Save
chart.render_to_png(f"plot-{THEME}.png")
with open(f"plot-{THEME}.html", "wb") as f:
    f.write(chart.render())
Runnable source as JSON, for any HTTP client: https://api.anyplot.ai/specs/streamgraph-basic/pygal/code. Any spec id and library id listed in llms-full.txt fit the same URL shape; every URL below is complete and callable.
{
  "spec_id": "streamgraph-basic",
  "language": "python",
  "library": "pygal",
  "page": "https://anyplot.ai/streamgraph-basic/python/pygal",
  "hub": "https://anyplot.ai/streamgraph-basic",
  "code_json": "https://api.anyplot.ai/specs/streamgraph-basic/pygal/code",
  "spec_json": "https://api.anyplot.ai/specs/streamgraph-basic",
  "render_light_png": "https://storage.googleapis.com/anyplot-images/plots/streamgraph-basic/python/pygal/plot-light.png",
  "render_dark_png": "https://storage.googleapis.com/anyplot-images/plots/streamgraph-basic/python/pygal/plot-dark.png",
  "interactive_light_html": "https://storage.googleapis.com/anyplot-images/plots/streamgraph-basic/python/pygal/plot-light.html",
  "interactive_dark_html": "https://storage.googleapis.com/anyplot-images/plots/streamgraph-basic/python/pygal/plot-dark.html",
  "quality_score": 91.0,
  "license": "MIT",
  "guide": "https://anyplot.ai/llms.txt"
}
Part of Basic Stream Graph on anyplot.ai.