The same plot in 14 other libraries — Python: Altair, Bokeh, lets-plot, Matplotlib, Plotly, plotnine, Pygal, Seaborn; R: ggplot2; JavaScript: Chart.js, D3.js, Apache ECharts, Highcharts, MUI X Charts. Compare all 15 side by side: Basic Stream Graph in Python, R, Julia and JavaScript.
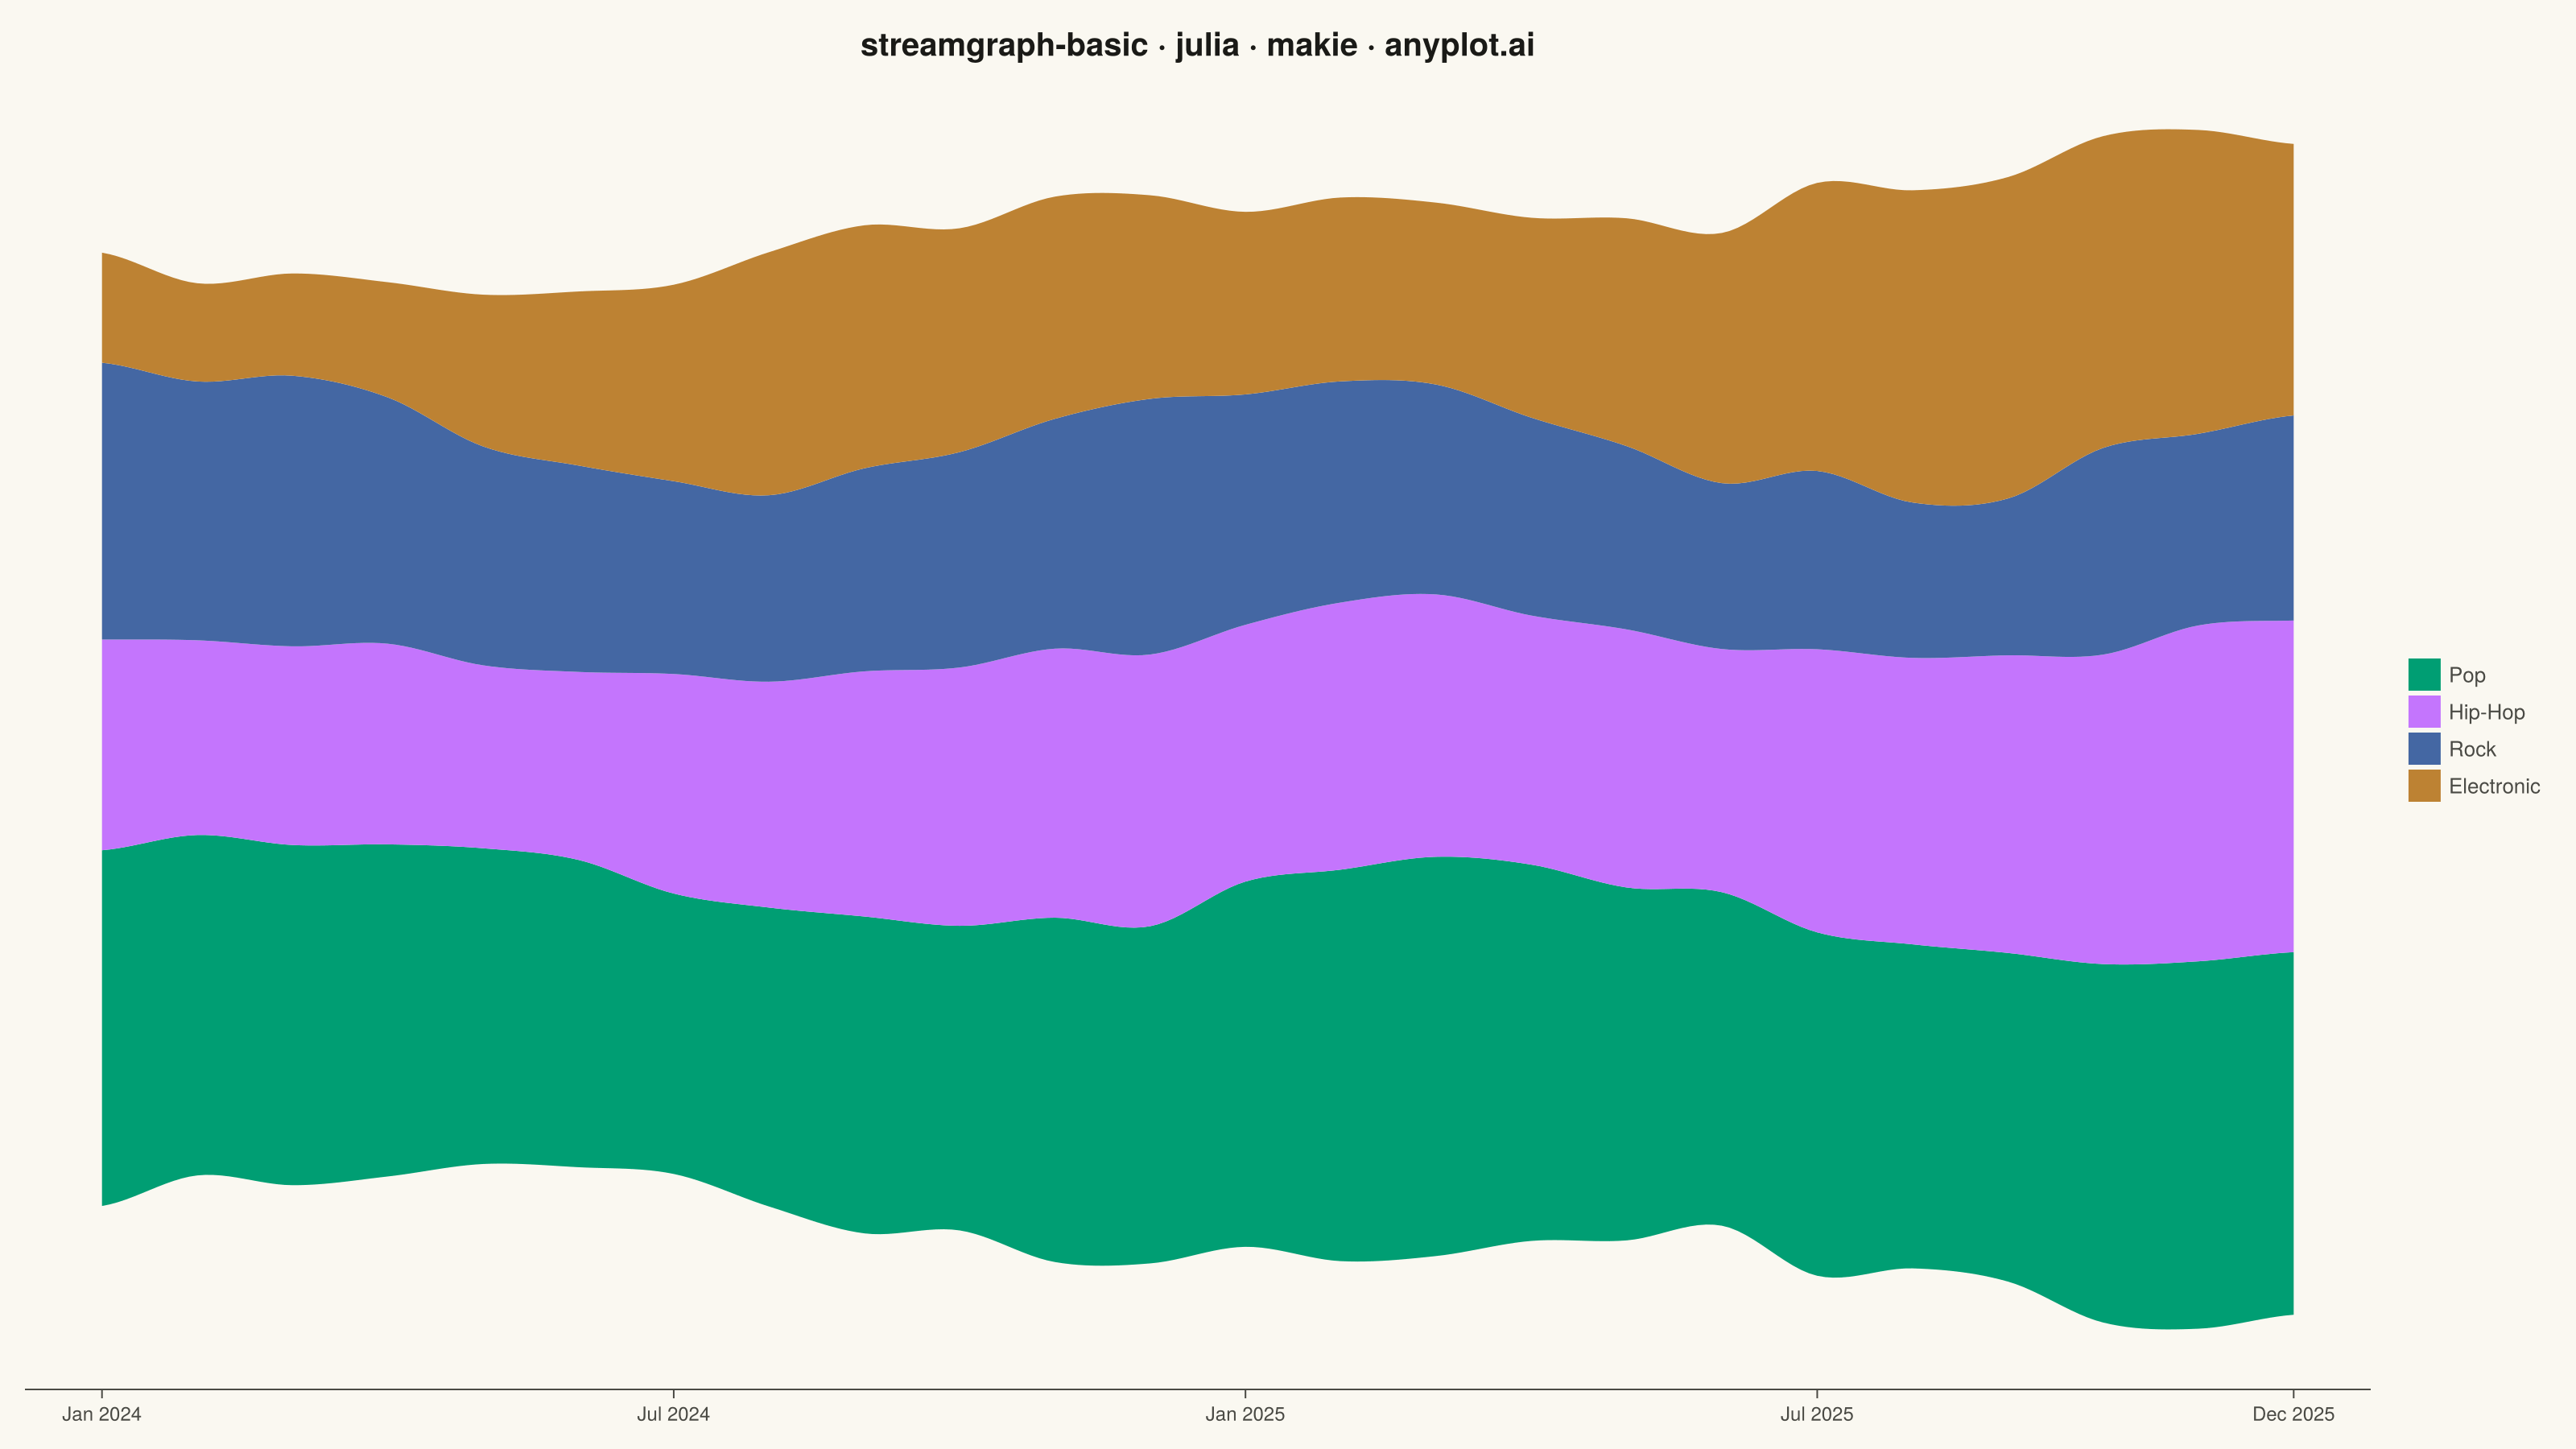
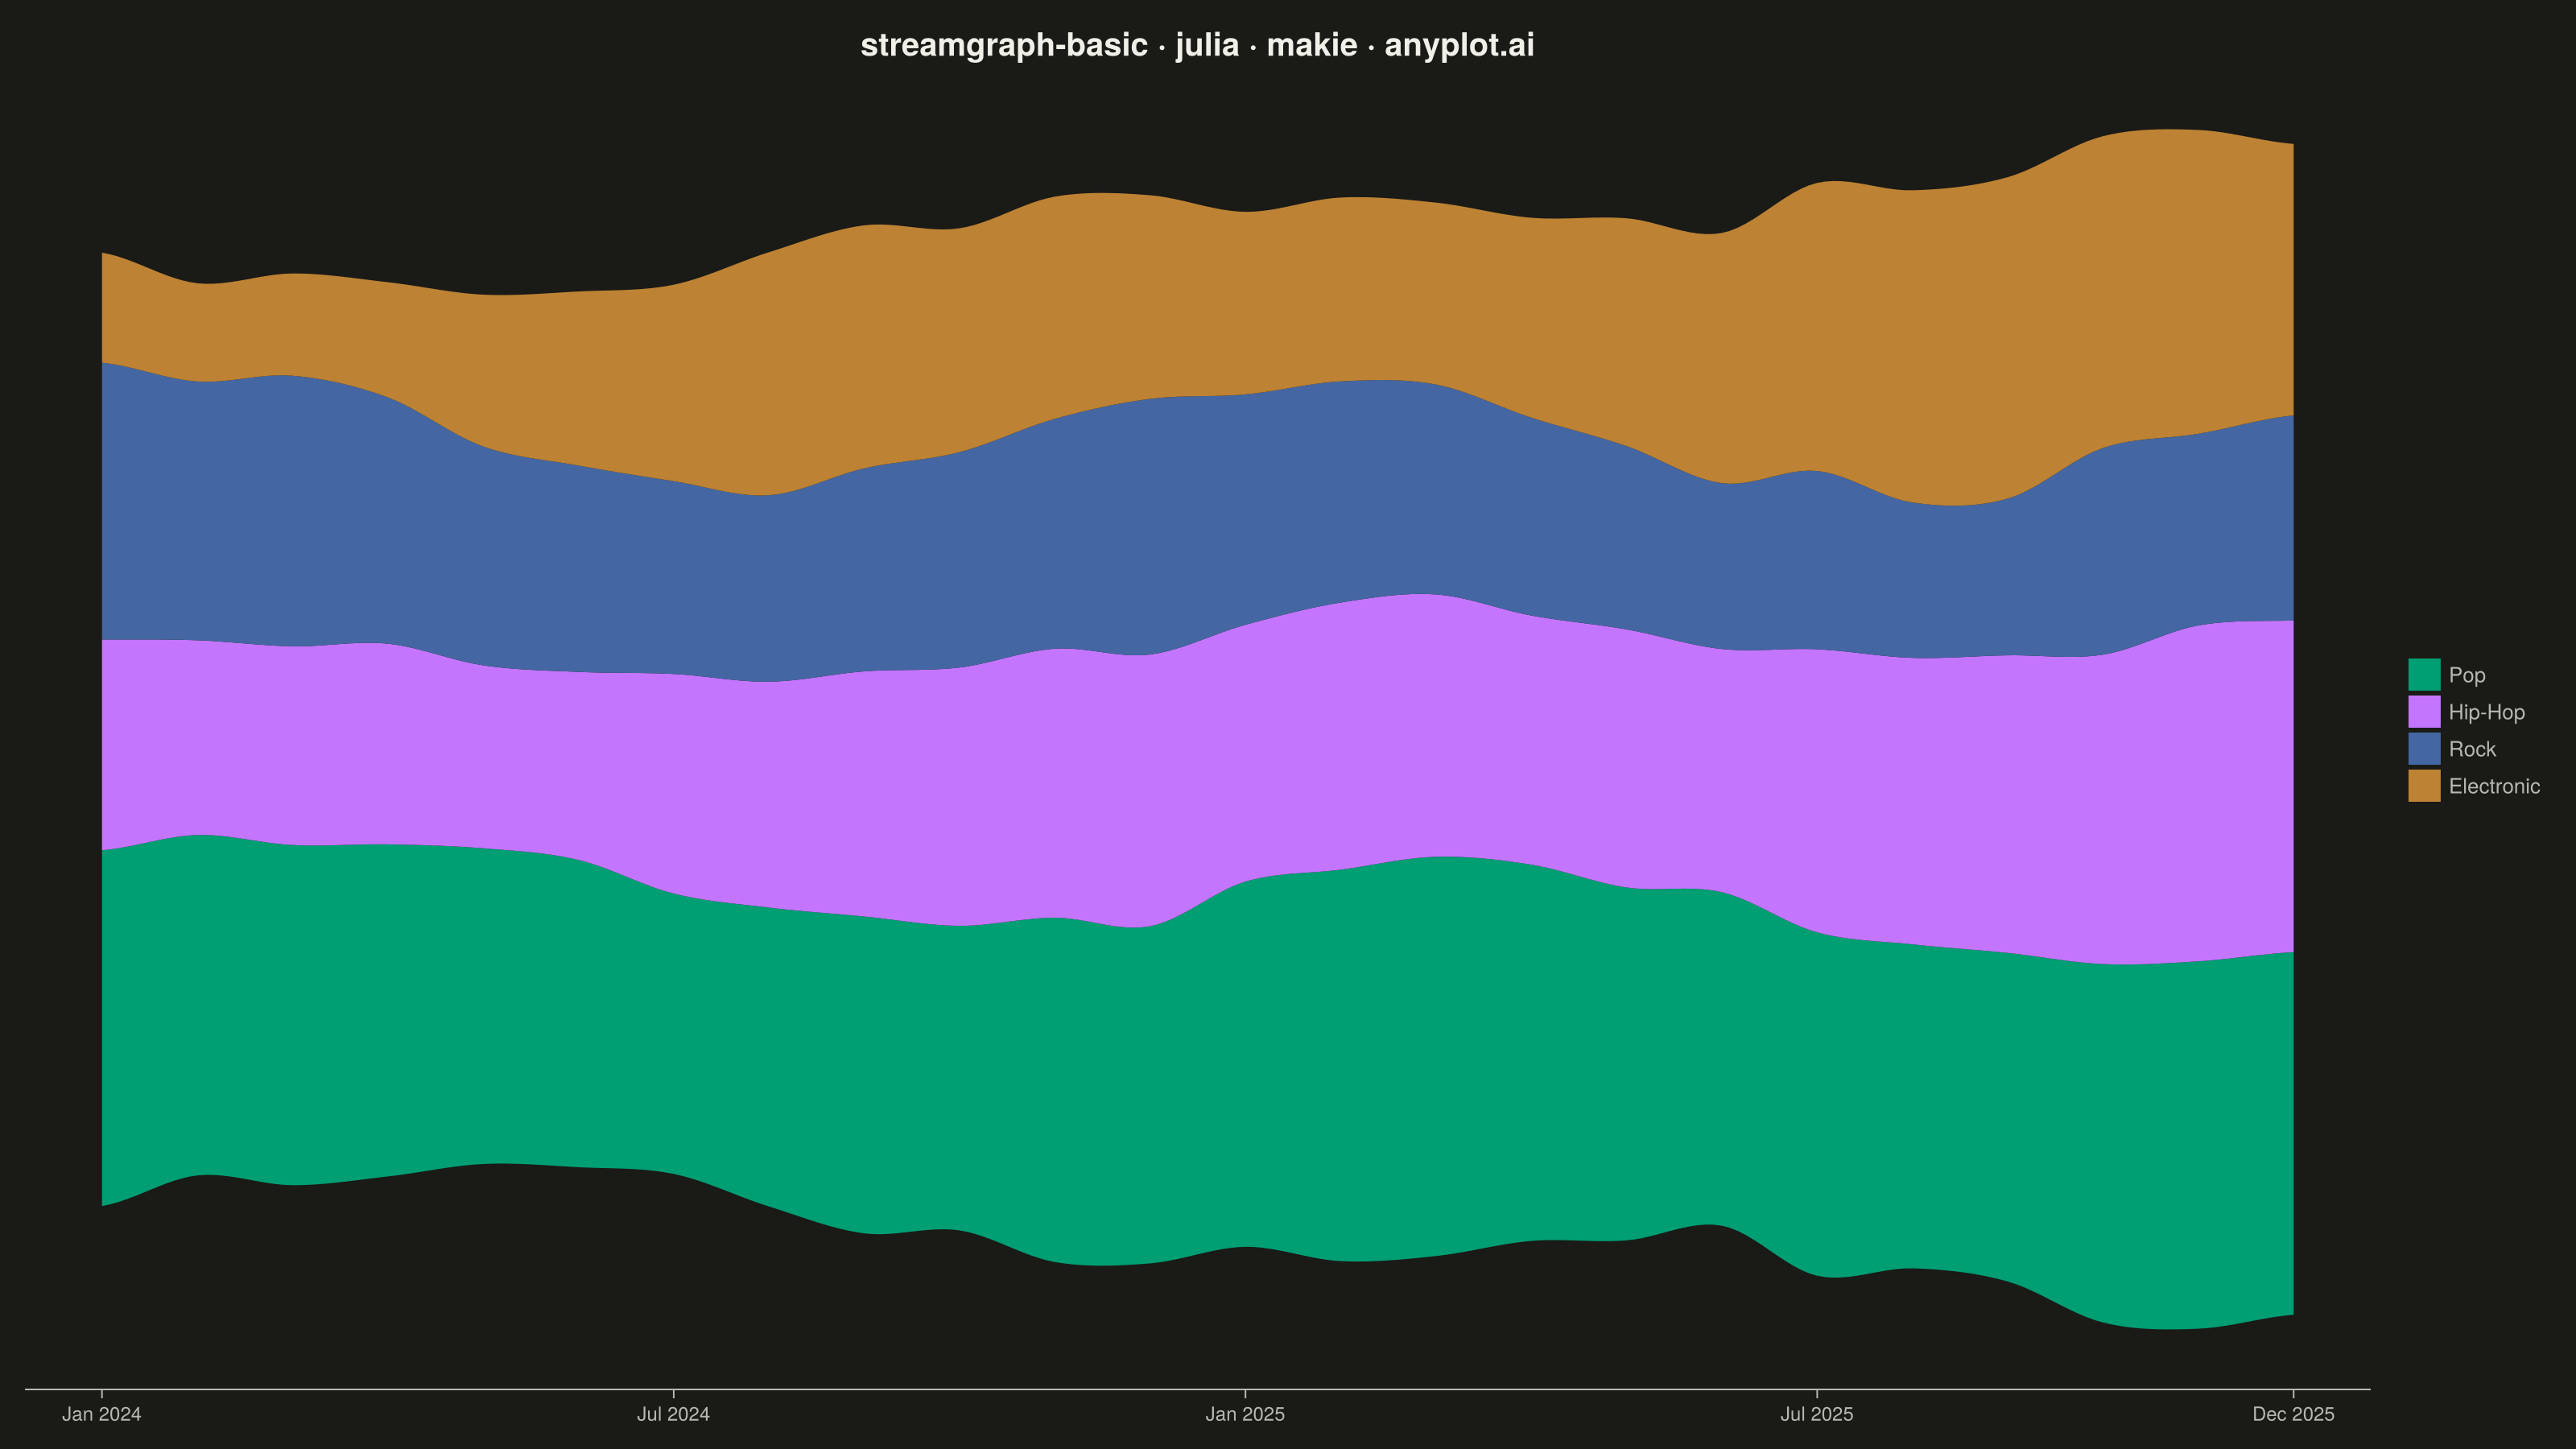
A streamgraph (also known as a stacked area chart with a centered baseline) displaying the composition of multiple categories over time with smooth, flowing curves. Unlike traditional stacked area charts, streamgraphs use a symmetric baseline centered around the x-axis, creating an organic, river-like appearance that emphasizes the overall shape and relative proportions of each category while minimizing the visual distortion of individual layers.
# anyplot.ai
# streamgraph-basic: Basic Stream Graph
# Library: makie 0.21.9 | Julia 1.11.9
# Quality: 84/100 | Created: 2026-08-05

using CairoMakie
using Colors
using Random

Random.seed!(42)

# Theme tokens
const THEME    = get(ENV, "ANYPLOT_THEME", "light")
const PAGE_BG  = THEME == "light" ? colorant"#FAF8F1" : colorant"#1A1A17"
const INK      = THEME == "light" ? colorant"#1A1A17" : colorant"#F0EFE8"
const INK_SOFT = THEME == "light" ? colorant"#4A4A44" : colorant"#B8B7B0"

const IMPRINT_PALETTE = [
    colorant"#009E73",  # 1 — brand green, ALWAYS first series (Imprint palette)
    colorant"#C475FD",  # 2 — lavender
    colorant"#4467A3",  # 3 — blue
    colorant"#BD8233",  # 4 — ochre
]

# Data — monthly streaming hours (millions) by music genre, 2024-2025
genres = ["Pop", "Hip-Hop", "Rock", "Electronic"]
n_genres = length(genres)
n_months = 24

base_level = [420.0, 260.0, 340.0, 180.0]
trend      = [3.5, 6.5, -4.0, 9.0]
wave_amp   = [55.0, 35.0, 45.0, 65.0]
wave_phase = [0.4, 2.1, 1.0, 3.4]

raw_values = zeros(Float64, n_months, n_genres)
for g in 1:n_genres
    for t in 1:n_months
        seasonal = wave_amp[g] * sin(2π * t / 12 + wave_phase[g])
        noise = randn() * base_level[g] * 0.05
        raw_values[t, g] = max(0.0, base_level[g] + trend[g] * t + seasonal + noise)
    end
end

# Smooth interpolation (Catmull-Rom spline) so each genre's layer flows
# organically between the monthly samples instead of showing sharp knots.
steps_per_segment = 12
n_smooth = (n_months - 1) * steps_per_segment + 1
x_smooth = collect(range(1, n_months; length = n_smooth))
smooth_values = zeros(Float64, n_smooth, n_genres)

for g in 1:n_genres
    idx = 1
    for i in 1:(n_months - 1)
        p0 = raw_values[max(i - 1, 1), g]
        p1 = raw_values[i, g]
        p2 = raw_values[i + 1, g]
        p3 = raw_values[min(i + 2, n_months), g]
        last_step = i == n_months - 1 ? steps_per_segment : steps_per_segment - 1
        for s in 0:last_step
            u = s / steps_per_segment
            u2 = u * u
            u3 = u2 * u
            val = 0.5 * ((2p1) + (-p0 + p2) * u +
                         (2p0 - 5p1 + 4p2 - p3) * u2 +
                         (-p0 + 3p1 - 3p2 + p3) * u3)
            smooth_values[idx, g] = max(val, 0.0)
            idx += 1
        end
    end
end

# Symmetric ("silhouette") baseline centered on zero — the defining streamgraph trait
totals = vec(sum(smooth_values; dims = 2))
baseline = -totals ./ 2
cum = cumsum(smooth_values; dims = 2)
layer_lower = zeros(Float64, n_smooth, n_genres)
layer_upper = zeros(Float64, n_smooth, n_genres)
for g in 1:n_genres
    layer_lower[:, g] = baseline .+ (g == 1 ? zeros(n_smooth) : cum[:, g - 1])
    layer_upper[:, g] = baseline .+ cum[:, g]
end

# Plot
fig = Figure(
    size            = (1600, 900),
    fontsize        = 14,
    backgroundcolor = PAGE_BG,
)

ax = Axis(
    fig[1, 1];
    title              = "streamgraph-basic · julia · makie · anyplot.ai",
    titlesize          = 30,
    titlecolor         = INK,
    titlefont          = :bold,
    xlabel             = "Month",
    xlabelsize         = 16,
    xlabelcolor        = INK,
    ylabel             = "Streaming Hours (millions)",
    ylabelsize         = 16,
    ylabelcolor        = INK,
    xticklabelsize     = 12,
    xticklabelcolor    = INK_SOFT,
    xtickcolor         = INK_SOFT,
    backgroundcolor    = PAGE_BG,
    topspinevisible    = false,
    rightspinevisible  = false,
    leftspinevisible   = false,
    bottomspinecolor   = INK_SOFT,
    yticksvisible      = false,
    yticklabelsvisible = false,
    xgridvisible       = false,
    ygridvisible       = false,
)

for g in 1:n_genres
    band!(ax, x_smooth, layer_lower[:, g], layer_upper[:, g];
        color = IMPRINT_PALETTE[g])
end

# Thin background-colored strokes between adjacent bands sharpen layer
# separation where two saturated fills touch directly (style guide's
# optional outline pattern, applied here as inter-band edging).
for g in 1:(n_genres - 1)
    lines!(ax, x_smooth, layer_upper[:, g]; color = PAGE_BG, linewidth = 1.5)
end

month_names = ["Jan", "Feb", "Mar", "Apr", "May", "Jun",
               "Jul", "Aug", "Sep", "Oct", "Nov", "Dec"]
xtick_positions = [1, 7, 13, 19, 24]
xtick_labels = String[]
for m in xtick_positions
    month_idx = mod1(m, 12)
    year = 2024 + div(m - 1, 12)
    push!(xtick_labels, "$(month_names[month_idx]) $(year)")
end
ax.xticks = (xtick_positions, xtick_labels)
xlims!(ax, 1 - 0.8, n_months + 0.8)

Legend(fig[1, 2],
    [PolyElement(color = IMPRINT_PALETTE[g]) for g in 1:n_genres],
    genres;
    framevisible = false,
    labelcolor   = INK_SOFT,
    labelsize    = 13,
)

# Save
save("plot-$(THEME).png", fig; px_per_unit = 2)
Runnable source as JSON, for any HTTP client: https://api.anyplot.ai/specs/streamgraph-basic/makie/code. Any spec id and library id listed in llms-full.txt fit the same URL shape; every URL below is complete and callable.
{
  "spec_id": "streamgraph-basic",
  "language": "julia",
  "library": "makie",
  "page": "https://anyplot.ai/streamgraph-basic/julia/makie",
  "hub": "https://anyplot.ai/streamgraph-basic",
  "code_json": "https://api.anyplot.ai/specs/streamgraph-basic/makie/code",
  "spec_json": "https://api.anyplot.ai/specs/streamgraph-basic",
  "render_light_png": "https://storage.googleapis.com/anyplot-images/plots/streamgraph-basic/julia/makie/plot-light.png",
  "render_dark_png": "https://storage.googleapis.com/anyplot-images/plots/streamgraph-basic/julia/makie/plot-dark.png",
  "quality_score": 84.0,
  "license": "MIT",
  "guide": "https://anyplot.ai/llms.txt"
}
Part of Basic Stream Graph on anyplot.ai.