The same plot in 14 other libraries — JavaScript: D3.js, Apache ECharts, Highcharts, MUI X Charts; Python: Altair, Bokeh, lets-plot, Matplotlib, Plotly, plotnine, Pygal, Seaborn; R: ggplot2; Julia: Makie.jl. Compare all 15 side by side: Ternary Density Plot in Python, R, Julia and JavaScript.
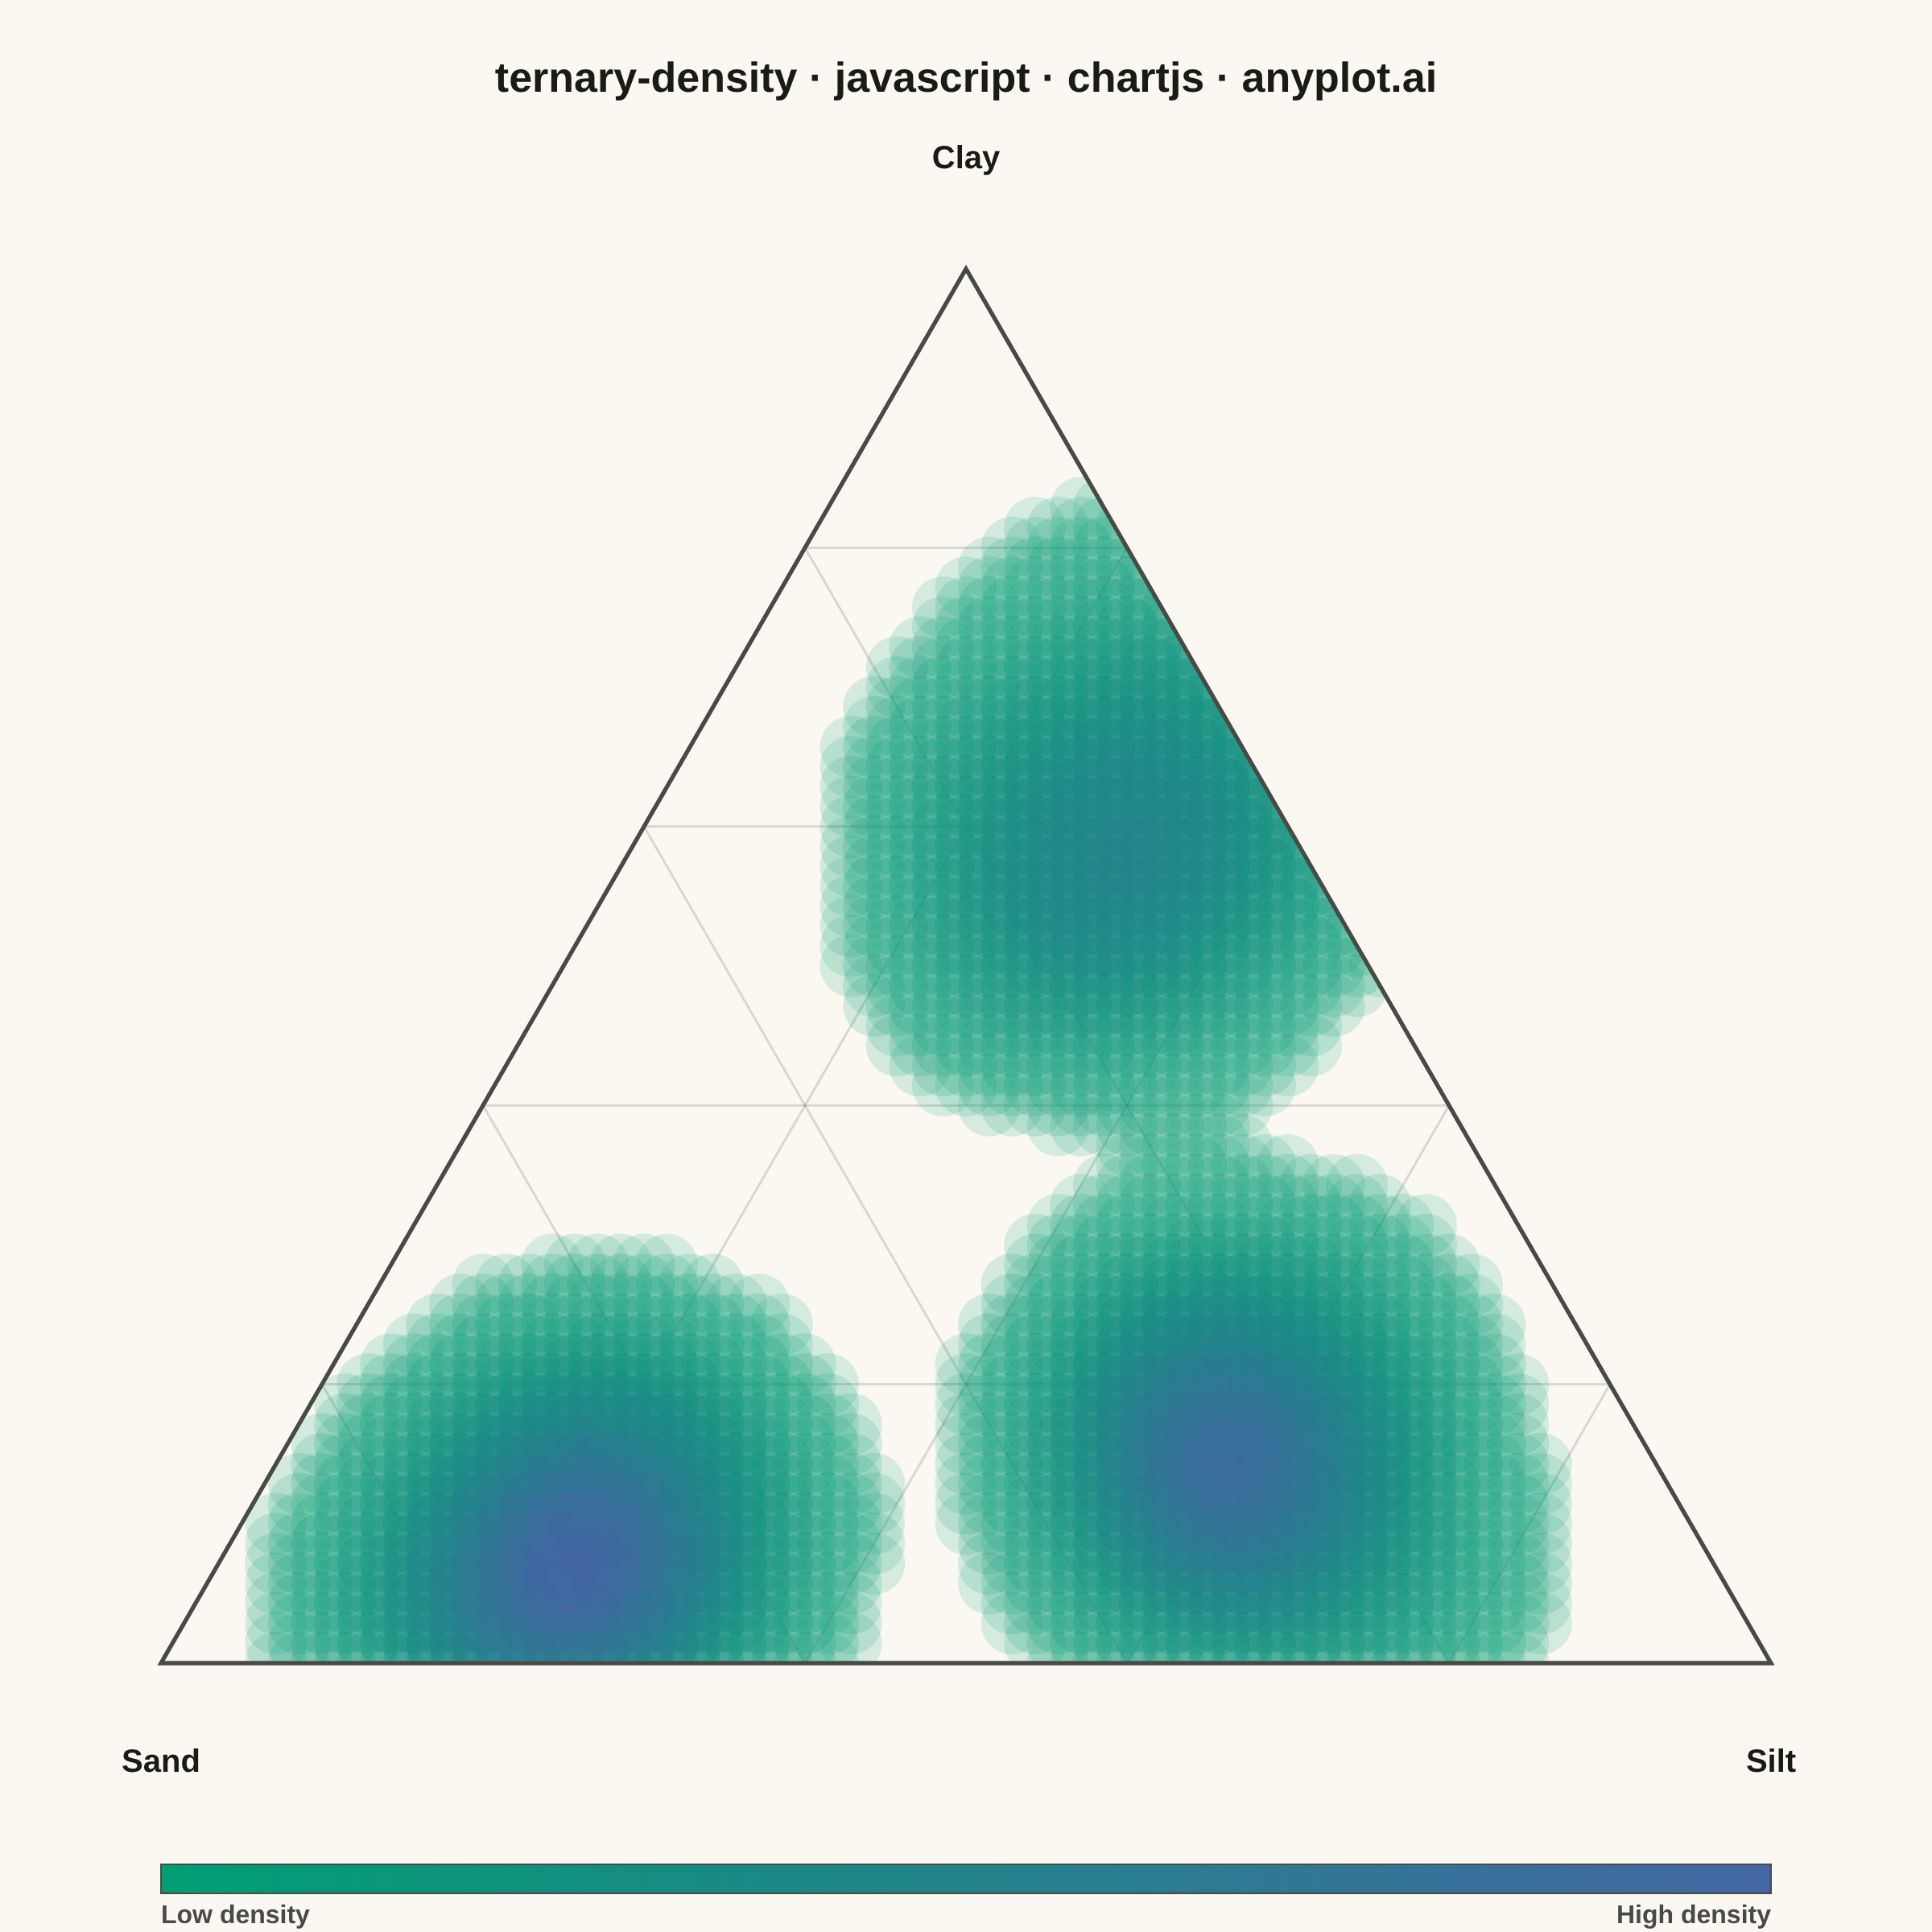
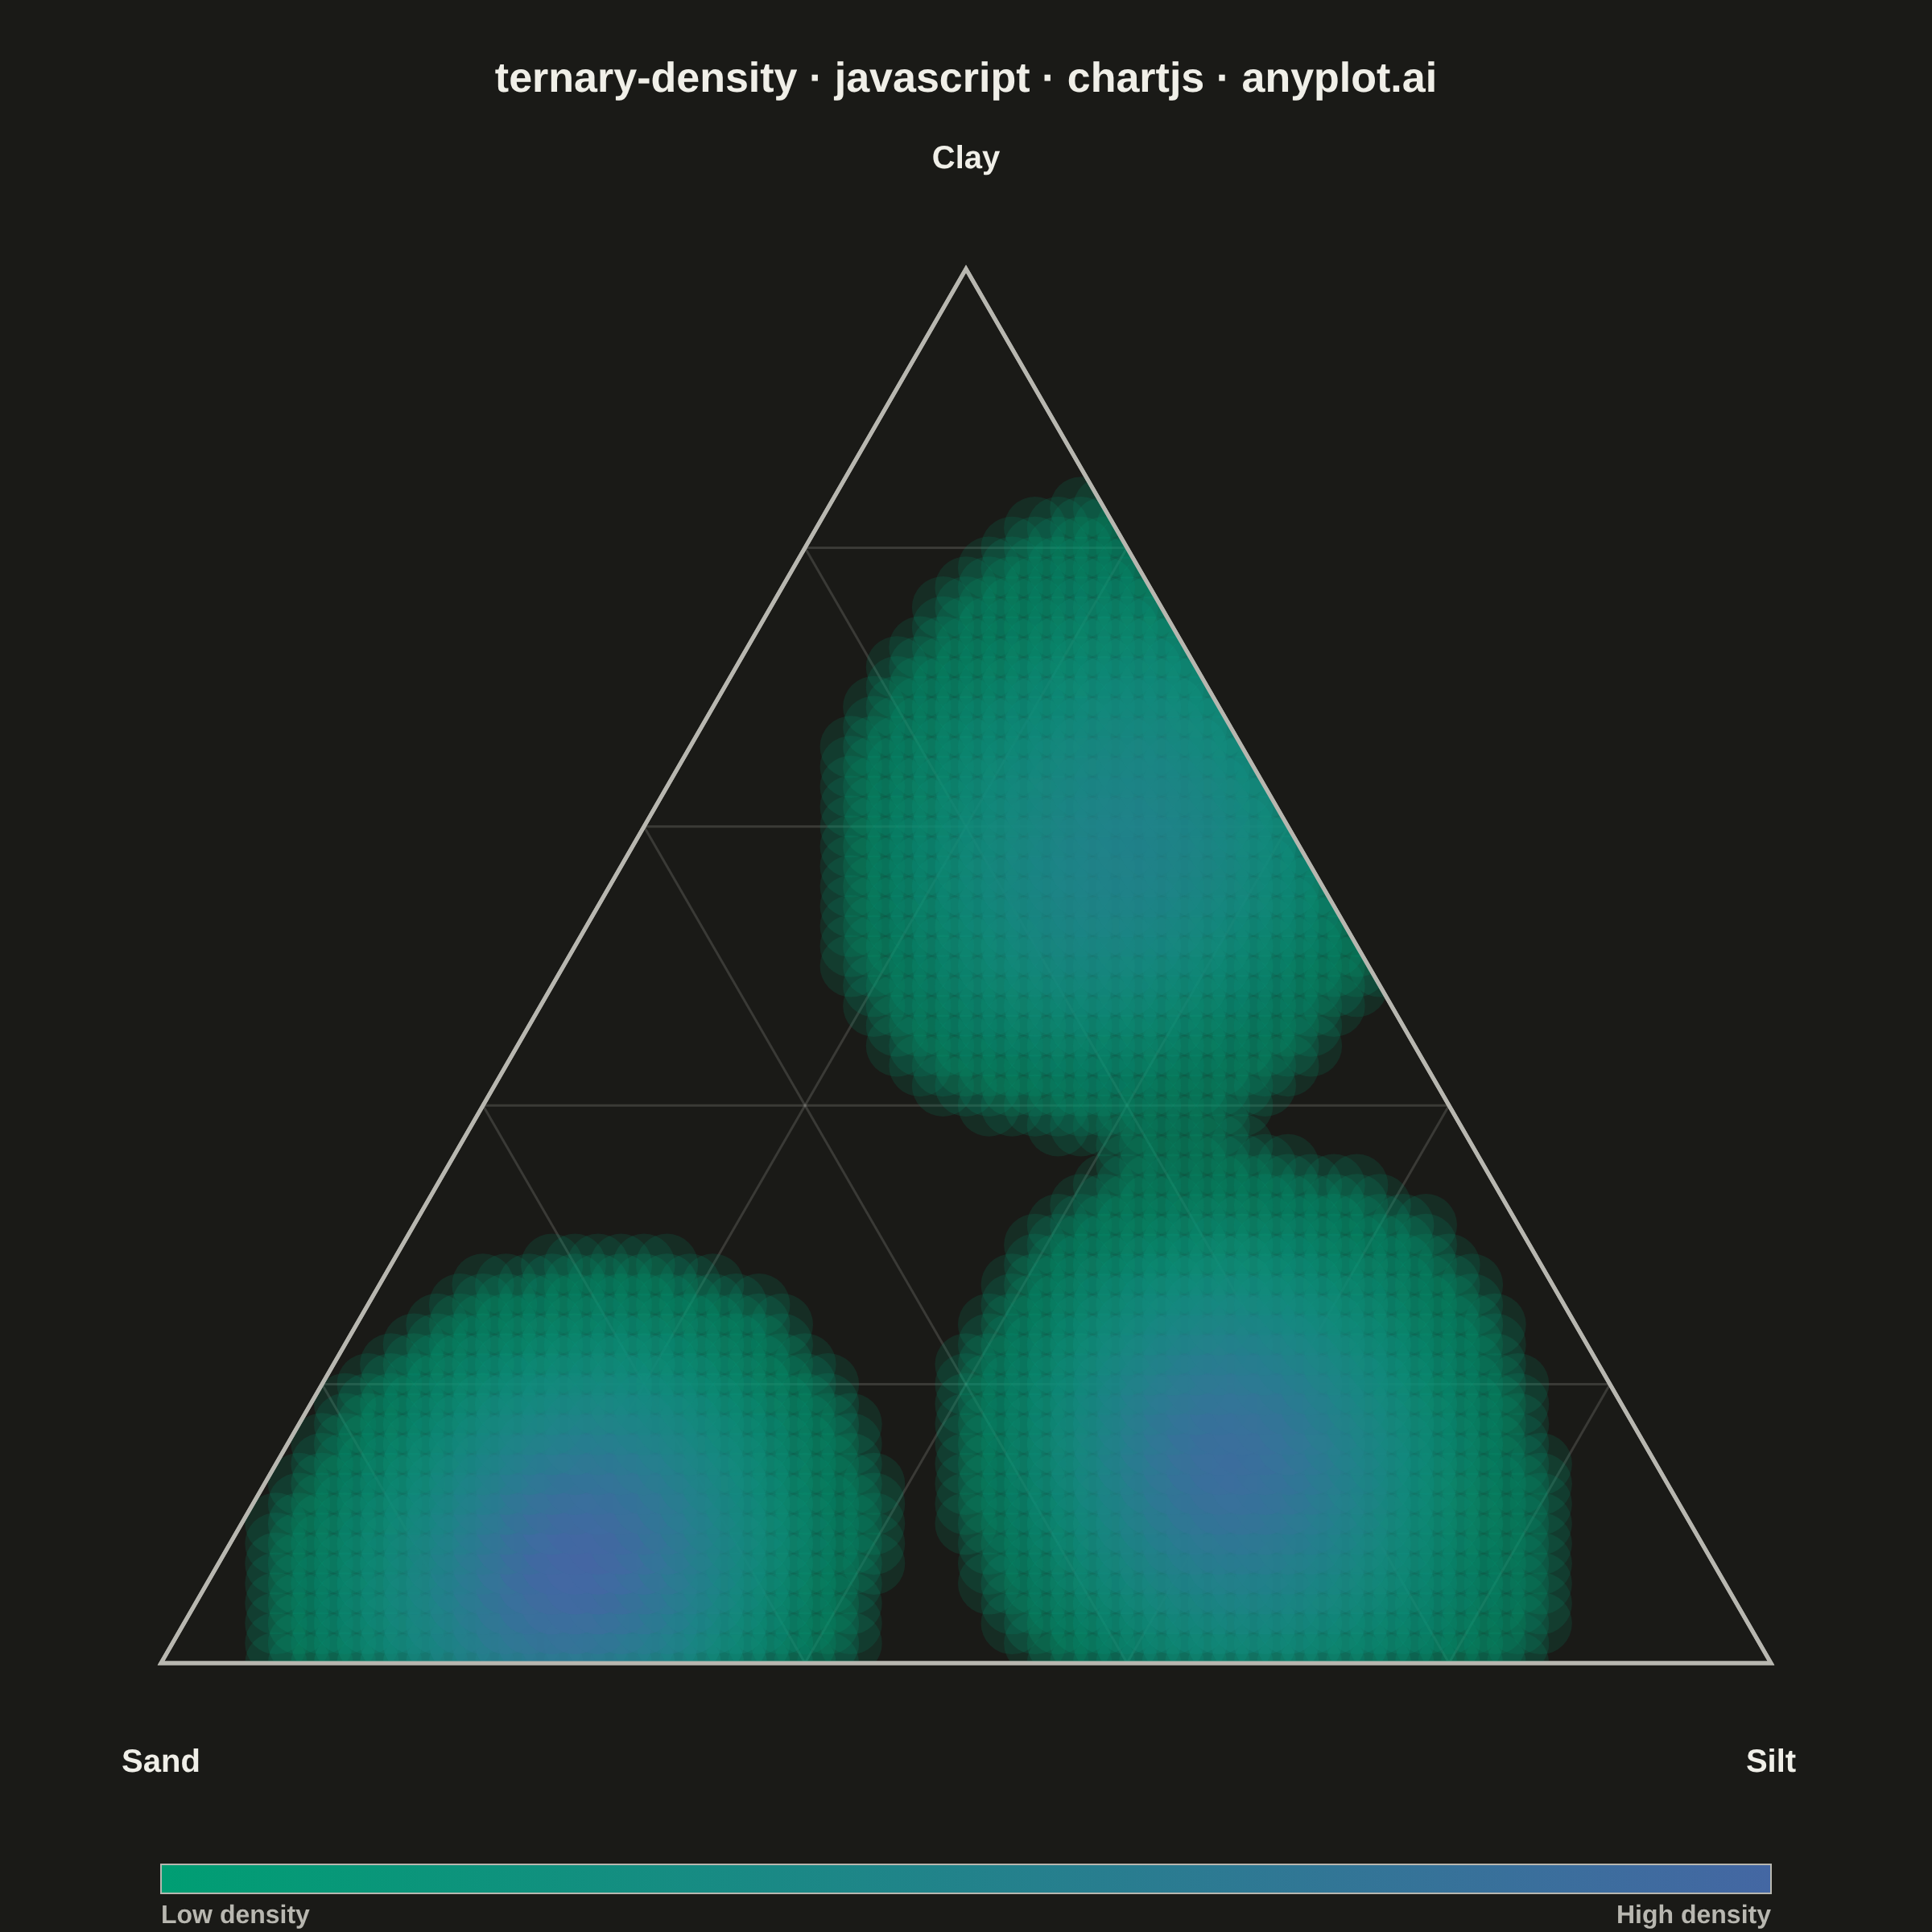
A ternary density plot combines a three-component ternary diagram with kernel density estimation to visualize where compositional data concentrates. Instead of showing individual points, this visualization uses a heatmap overlay to reveal the underlying probability distribution of compositions, making it ideal for identifying clusters, modes, and patterns in large compositional datasets.
// anyplot.ai
// ternary-density: Ternary Density Plot
// Library: chartjs 4.4.7 | JavaScript 22.23.2
// Quality: 92/100 | Created: 2026-09-02

//# anyplot-orientation: square
const t = window.ANYPLOT_TOKENS;
const PAD = 100; // symmetric layout padding (CSS px) that keeps the chart area square

// --- Deterministic PRNG (LCG) + Gaussian sampling ---------------------------
let seed = 42;
function lcg() {
  seed = (seed * 1664525 + 1013904223) % 4294967296;
  return seed / 4294967296;
}
function randn() {
  const u1 = Math.max(lcg(), 1e-9);
  const u2 = lcg();
  return Math.sqrt(-2 * Math.log(u1)) * Math.cos(2 * Math.PI * u2);
}

// --- Barycentric -> Cartesian (equilateral triangle) ------------------------
// Vertices: Sand (a) at (0,0), Silt (b) at (1,0), Clay (c) at (0.5, H)
const H = Math.sqrt(3) / 2;
function bary2xy(a, b, c) {
  return { x: b + 0.5 * c, y: c * H };
}

// --- Data: sediment composition (sand / silt / clay), 3 facies clusters -----
const facies = [
  { name: "Sandy shoreface", center: [0.7, 0.22, 0.08], spread: 0.06, weight: 0.4 },
  { name: "Silty mid-shelf", center: [0.25, 0.6, 0.15], spread: 0.07, weight: 0.35 },
  { name: "Clay-rich basin", center: [0.1, 0.3, 0.6], spread: 0.08, weight: 0.25 },
];
const N_SAMPLES = 1200;
const cumWeights = [];
facies.reduce((sum, f, i) => (cumWeights[i] = sum + f.weight), 0);

const samples = [];
for (let i = 0; i < N_SAMPLES; i++) {
  const r = lcg();
  const cluster = facies[cumWeights.findIndex((w) => r <= w)] ?? facies[facies.length - 1];
  let a = cluster.center[0] + cluster.spread * randn();
  let b = cluster.center[1] + cluster.spread * randn();
  let c = cluster.center[2] + cluster.spread * randn();
  a = Math.max(a, 0.01);
  b = Math.max(b, 0.01);
  c = Math.max(c, 0.01);
  const total = a + b + c;
  const point = bary2xy(a / total, b / total, c / total);
  samples.push(point);
}

// --- Kernel density estimate over a triangular grid --------------------------
const DIVISIONS = 70;
const BANDWIDTH = 0.05;
const cellX = [];
const cellY = [];
const cellDensity = [];
let maxDensity = 0;

for (let iy = 0; iy <= DIVISIONS; iy++) {
  const gy = (iy / DIVISIONS) * H;
  for (let ix = 0; ix <= DIVISIONS; ix++) {
    const gx = ix / DIVISIONS;
    // Skip grid points outside the triangle (barycentric feasibility check)
    const gc = gy / H;
    const gb = gx - 0.5 * gc;
    const ga = 1 - gb - gc;
    if (ga < -0.01 || gb < -0.01 || gc < -0.01) continue;

    let density = 0;
    for (let s = 0; s < samples.length; s++) {
      const dx = gx - samples[s].x;
      const dy = gy - samples[s].y;
      density += Math.exp(-(dx * dx + dy * dy) / (2 * BANDWIDTH * BANDWIDTH));
    }
    density /= samples.length;
    if (density > maxDensity) maxDensity = density;
    cellX.push(gx);
    cellY.push(gy);
    cellDensity.push(density);
  }
}

// --- Density color mapping (imprint_seq: brand green -> blue) ---------------
function hexToRgb(hex) {
  const n = parseInt(hex.slice(1), 16);
  return [(n >> 16) & 255, (n >> 8) & 255, n & 255];
}
const seqLo = hexToRgb(t.seq[0]);
const seqHi = hexToRgb(t.seq[1]);
function densityColor(ratio, alpha) {
  const r = Math.round(seqLo[0] + (seqHi[0] - seqLo[0]) * ratio);
  const g = Math.round(seqLo[1] + (seqHi[1] - seqLo[1]) * ratio);
  const b = Math.round(seqLo[2] + (seqHi[2] - seqLo[2]) * ratio);
  return `rgba(${r}, ${g}, ${b}, ${alpha})`;
}

const DENSITY_FLOOR = 0.03;
const heatPoints = [];
// Mount is a fixed 1200 CSS-px square (see prompts/library/chartjs.md); with
// symmetric layout padding this gives an exact chart-area side of MOUNT - 2*PAD.
const CHART_AREA_PX = 1200 - 2 * PAD;
const cellSpacingPx = CHART_AREA_PX / DIVISIONS;
const cellRadius = cellSpacingPx * 1.35; // heavy overlap smooths the grid into a continuous surface
for (let i = 0; i < cellDensity.length; i++) {
  const ratio = cellDensity[i] / maxDensity;
  if (ratio < DENSITY_FLOOR) continue;
  const alpha = 0.12 + 0.78 * ratio;
  heatPoints.push({
    x: cellX[i],
    y: cellY[i],
    r: cellRadius,
    color: densityColor(ratio, alpha),
  });
}

// --- Ternary grid geometry (drawn beneath the density layer) ----------------
const gridLevels = [0.2, 0.4, 0.6, 0.8];
const gridSegments = [];
for (const k of gridLevels) {
  gridSegments.push([bary2xy(k, 1 - k, 0), bary2xy(k, 0, 1 - k)]); // constant sand
  gridSegments.push([bary2xy(1 - k, k, 0), bary2xy(0, k, 1 - k)]); // constant silt
  gridSegments.push([bary2xy(1 - k, 0, k), bary2xy(0, 1 - k, k)]); // constant clay
}
const triangleOutline = [bary2xy(1, 0, 0), bary2xy(0, 1, 0), bary2xy(0, 0, 1), bary2xy(1, 0, 0)];

// --- Domain: pad the y-range so x-range and y-range are equal ---------------
// Guarantees an undistorted equilateral triangle once the chart area is square.
const marginY = (1 - H) / 2;
const xMin = 0;
const xMax = 1;
const yMin = -marginY;
const yMax = H + marginY;

// --- Custom plugin: ternary grid, vertex labels, title, colorbar ------------
function traceTriangle(ctx, px, py) {
  ctx.beginPath();
  triangleOutline.forEach((p, i) => {
    const [px_, py_] = [px(p.x), py(p.y)];
    if (i === 0) ctx.moveTo(px_, py_);
    else ctx.lineTo(px_, py_);
  });
  ctx.closePath();
}

const ternaryChrome = {
  id: "ternaryChrome",
  beforeDatasetsDraw(chart) {
    const { ctx, scales } = chart;
    const px = (x) => scales.x.getPixelForValue(x);
    const py = (y) => scales.y.getPixelForValue(y);

    ctx.save();
    ctx.strokeStyle = t.grid;
    ctx.lineWidth = 1.5;
    for (const [p0, p1] of gridSegments) {
      ctx.beginPath();
      ctx.moveTo(px(p0.x), py(p0.y));
      ctx.lineTo(px(p1.x), py(p1.y));
      ctx.stroke();
    }

    ctx.strokeStyle = t.inkSoft;
    ctx.lineWidth = 2.5;
    traceTriangle(ctx, px, py);
    ctx.stroke();
    ctx.restore();

    // Clip the upcoming density-bubble dataset to the simplex so heavily
    // overlapping bubbles near the edges never paint outside the valid
    // compositional triangle. Restored (and the outline re-stroked on top)
    // in afterDatasetsDraw once the bubble layer is done.
    ctx.save();
    traceTriangle(ctx, px, py);
    ctx.clip();
  },
  afterDatasetsDraw(chart) {
    const { ctx, scales } = chart;
    const px = (x) => scales.x.getPixelForValue(x);
    const py = (y) => scales.y.getPixelForValue(y);

    ctx.restore(); // drop the clip applied in beforeDatasetsDraw

    // Re-stroke the outline on top of the (now clipped) density layer so the
    // boundary stays crisp instead of being softened by adjacent bubbles.
    ctx.save();
    ctx.strokeStyle = t.inkSoft;
    ctx.lineWidth = 2.5;
    traceTriangle(ctx, px, py);
    ctx.stroke();
    ctx.restore();
  },
  afterDraw(chart) {
    const { ctx, scales, chartArea } = chart;
    const px = (x) => scales.x.getPixelForValue(x);
    const py = (y) => scales.y.getPixelForValue(y);

    // Title
    ctx.save();
    ctx.fillStyle = t.ink;
    ctx.font = "600 26px sans-serif";
    ctx.textAlign = "center";
    ctx.textBaseline = "middle";
    ctx.fillText("ternary-density · javascript · chartjs · anyplot.ai", chart.width / 2, PAD / 2);

    // Vertex labels
    ctx.font = "600 20px sans-serif";
    ctx.fillStyle = t.ink;
    ctx.textBaseline = "bottom";
    ctx.fillText("Sand", px(0), py(0) + PAD * 0.72);
    ctx.fillText("Silt", px(1), py(0) + PAD * 0.72);
    ctx.textBaseline = "top";
    ctx.fillText("Clay", px(0.5), py(H) - PAD * 0.78);

    // Colorbar (density legend) in the bottom margin
    const barW = chartArea.right - chartArea.left;
    const barX = chartArea.left;
    const barY = chart.height - PAD * 0.42;
    const barH = 18;
    const gradient = ctx.createLinearGradient(barX, 0, barX + barW, 0);
    gradient.addColorStop(0, t.seq[0]);
    gradient.addColorStop(1, t.seq[1]);
    ctx.fillStyle = gradient;
    ctx.fillRect(barX, barY, barW, barH);
    ctx.strokeStyle = t.inkSoft;
    ctx.lineWidth = 1;
    ctx.strokeRect(barX, barY, barW, barH);

    ctx.font = "600 16px sans-serif";
    ctx.fillStyle = t.inkSoft;
    ctx.textBaseline = "top";
    ctx.textAlign = "left";
    ctx.fillText("Low density", barX, barY + barH + 6);
    ctx.textAlign = "right";
    ctx.fillText("High density", barX + barW, barY + barH + 6);
    ctx.restore();
  },
};

// --- Mount -------------------------------------------------------------------
const canvas = document.createElement("canvas");
document.getElementById("container").appendChild(canvas);

// --- Chart --------------------------------------------------------------------
new Chart(canvas, {
  type: "bubble",
  data: {
    datasets: [
      {
        data: heatPoints,
        backgroundColor: heatPoints.map((p) => p.color),
        borderWidth: 0,
      },
    ],
  },
  options: {
    responsive: true,
    maintainAspectRatio: false,
    animation: false,
    layout: { padding: PAD },
    plugins: {
      title: { display: false },
      legend: { display: false },
      tooltip: { enabled: false },
    },
    scales: {
      x: { type: "linear", min: xMin, max: xMax, display: false },
      y: { type: "linear", min: yMin, max: yMax, display: false },
    },
  },
  plugins: [ternaryChrome],
});
Runnable source as JSON, for any HTTP client: https://api.anyplot.ai/specs/ternary-density/chartjs/code. Any spec id and library id listed in llms-full.txt fit the same URL shape; every URL below is complete and callable.
{
  "spec_id": "ternary-density",
  "language": "javascript",
  "library": "chartjs",
  "page": "https://anyplot.ai/ternary-density/javascript/chartjs",
  "hub": "https://anyplot.ai/ternary-density",
  "code_json": "https://api.anyplot.ai/specs/ternary-density/chartjs/code",
  "spec_json": "https://api.anyplot.ai/specs/ternary-density",
  "render_light_png": "https://storage.googleapis.com/anyplot-images/plots/ternary-density/javascript/chartjs/plot-light.png",
  "render_dark_png": "https://storage.googleapis.com/anyplot-images/plots/ternary-density/javascript/chartjs/plot-dark.png",
  "interactive_light_html": "https://storage.googleapis.com/anyplot-images/plots/ternary-density/javascript/chartjs/plot-light.html",
  "interactive_dark_html": "https://storage.googleapis.com/anyplot-images/plots/ternary-density/javascript/chartjs/plot-dark.html",
  "quality_score": 92.0,
  "license": "MIT",
  "guide": "https://anyplot.ai/llms.txt"
}
Part of Ternary Density Plot on anyplot.ai.