The same plot in 14 other libraries — Python: Altair, Bokeh, lets-plot, Matplotlib, Plotly, plotnine, Pygal, Seaborn; R: ggplot2; JavaScript: Chart.js, D3.js, Apache ECharts, Highcharts, MUI X Charts. Compare all 15 side by side: Ternary Density Plot in Python, R, Julia and JavaScript.
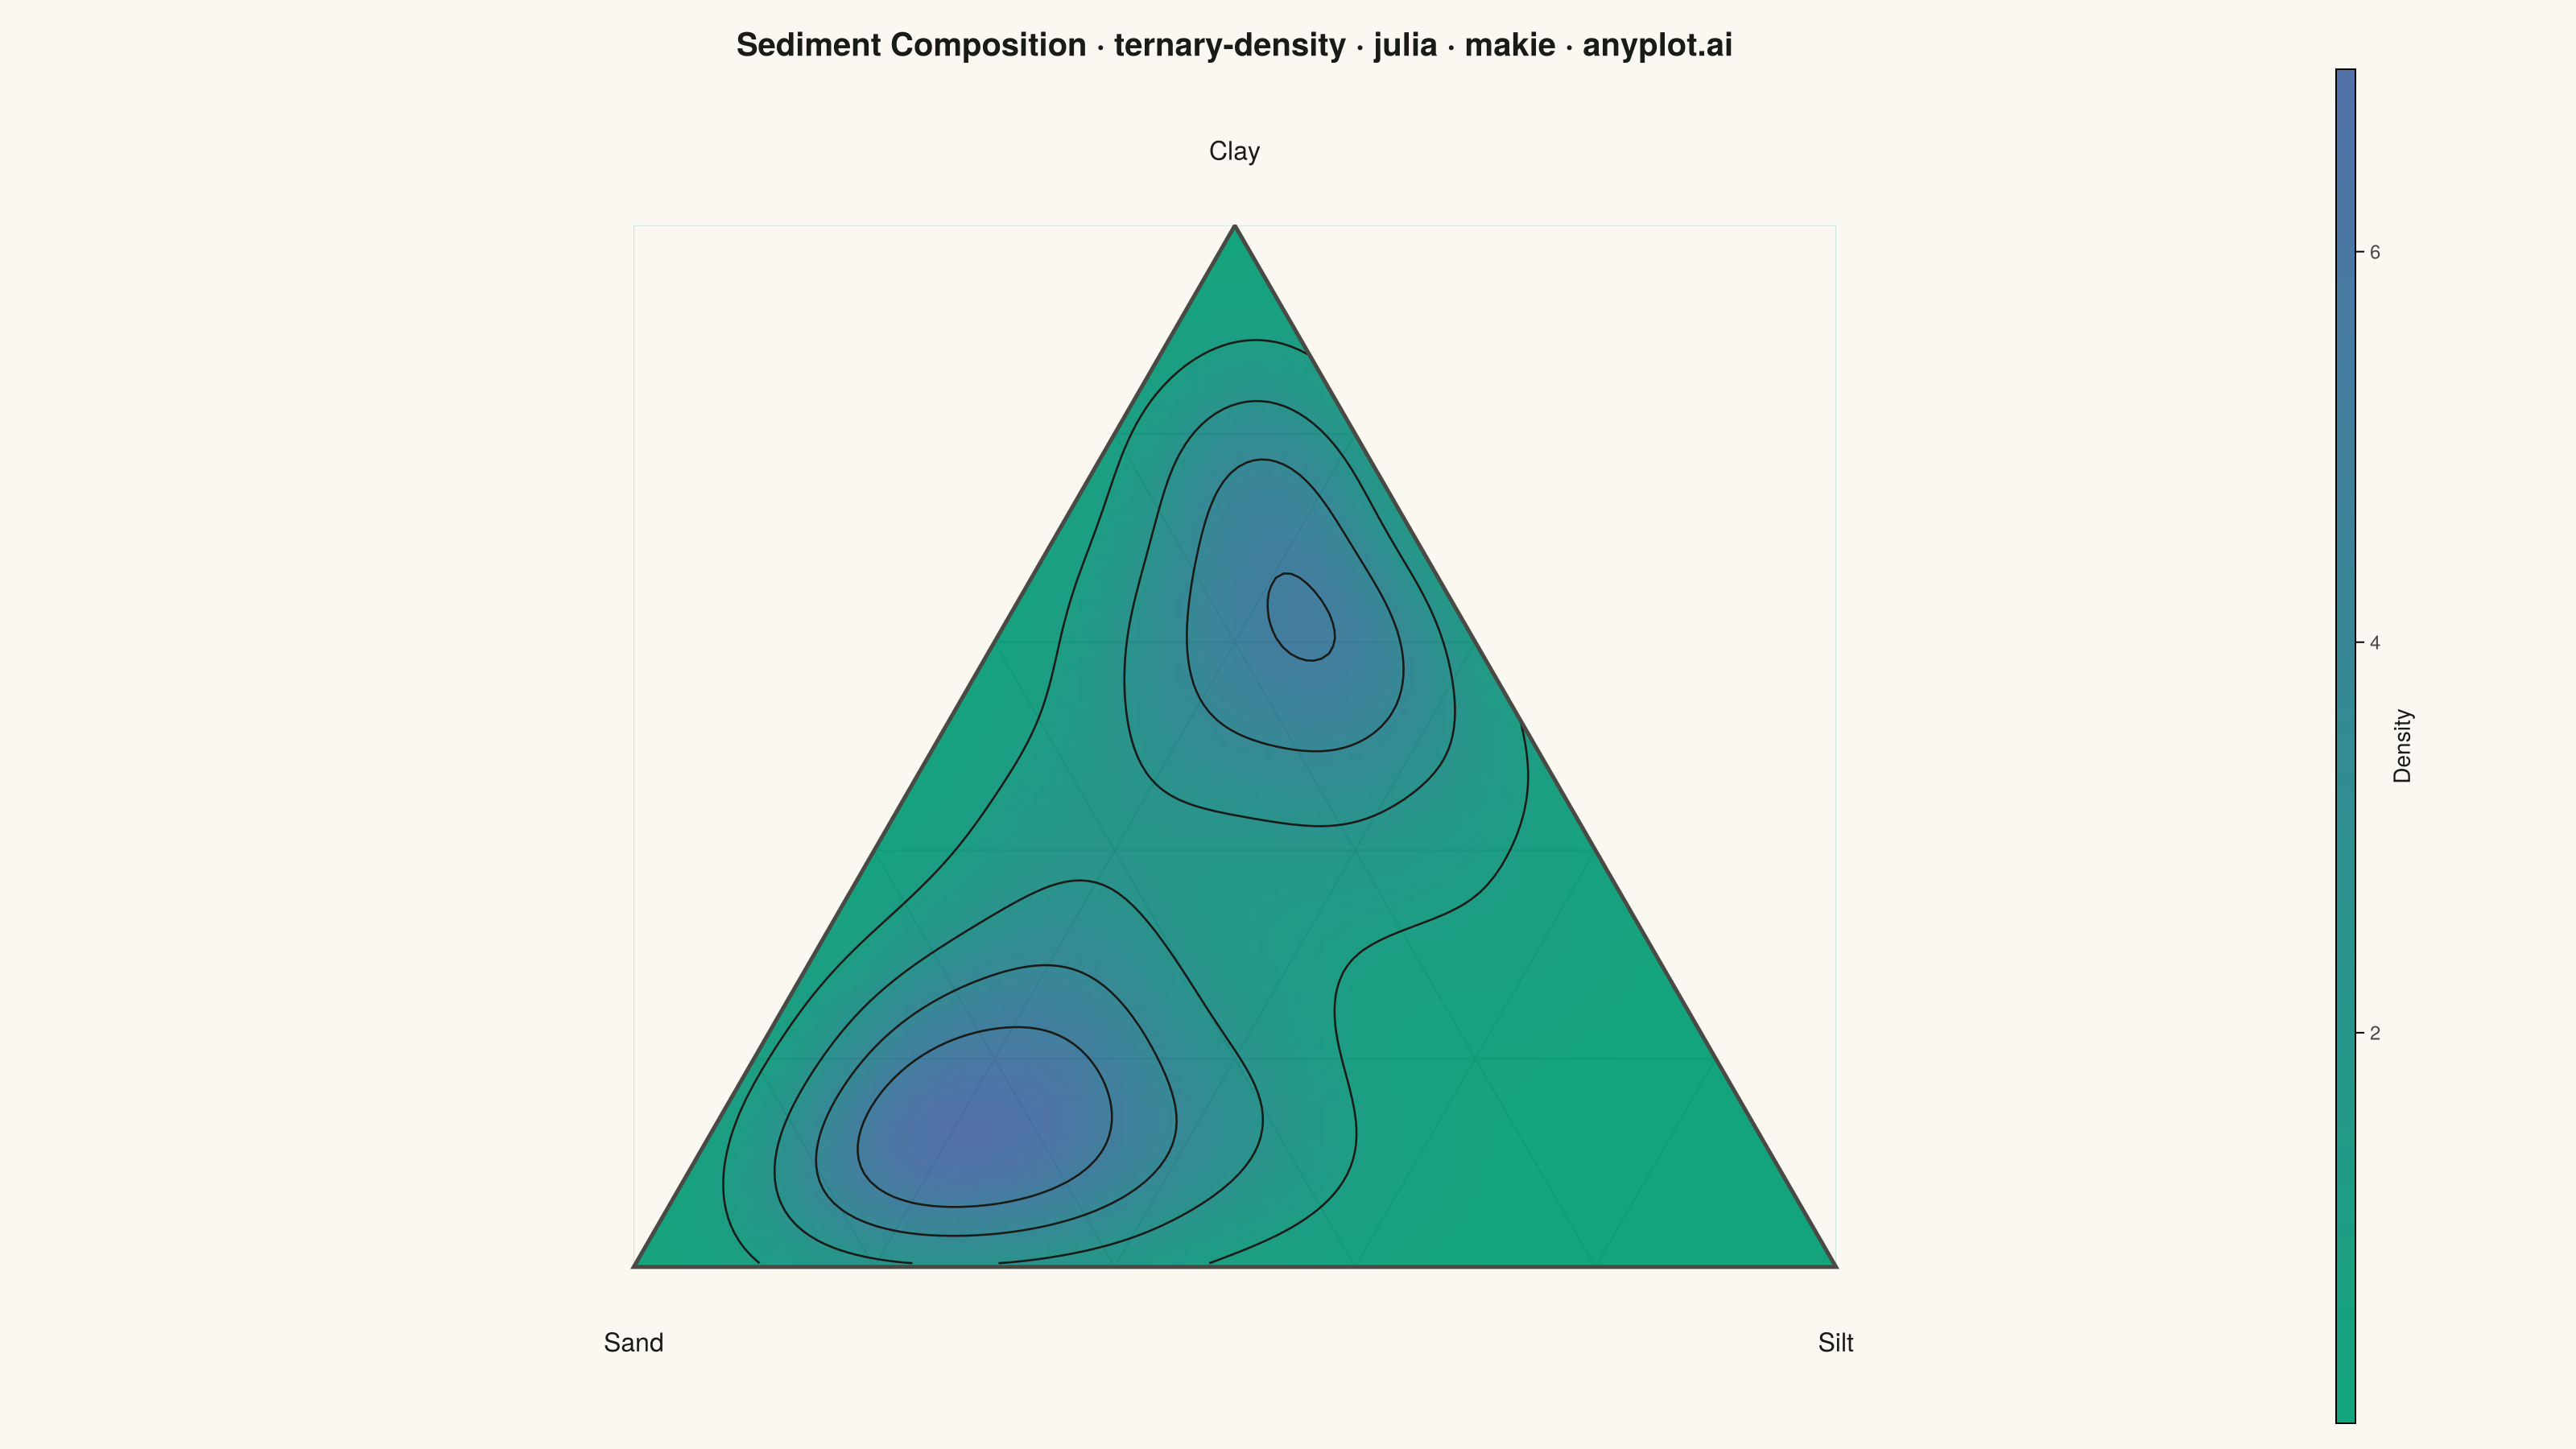
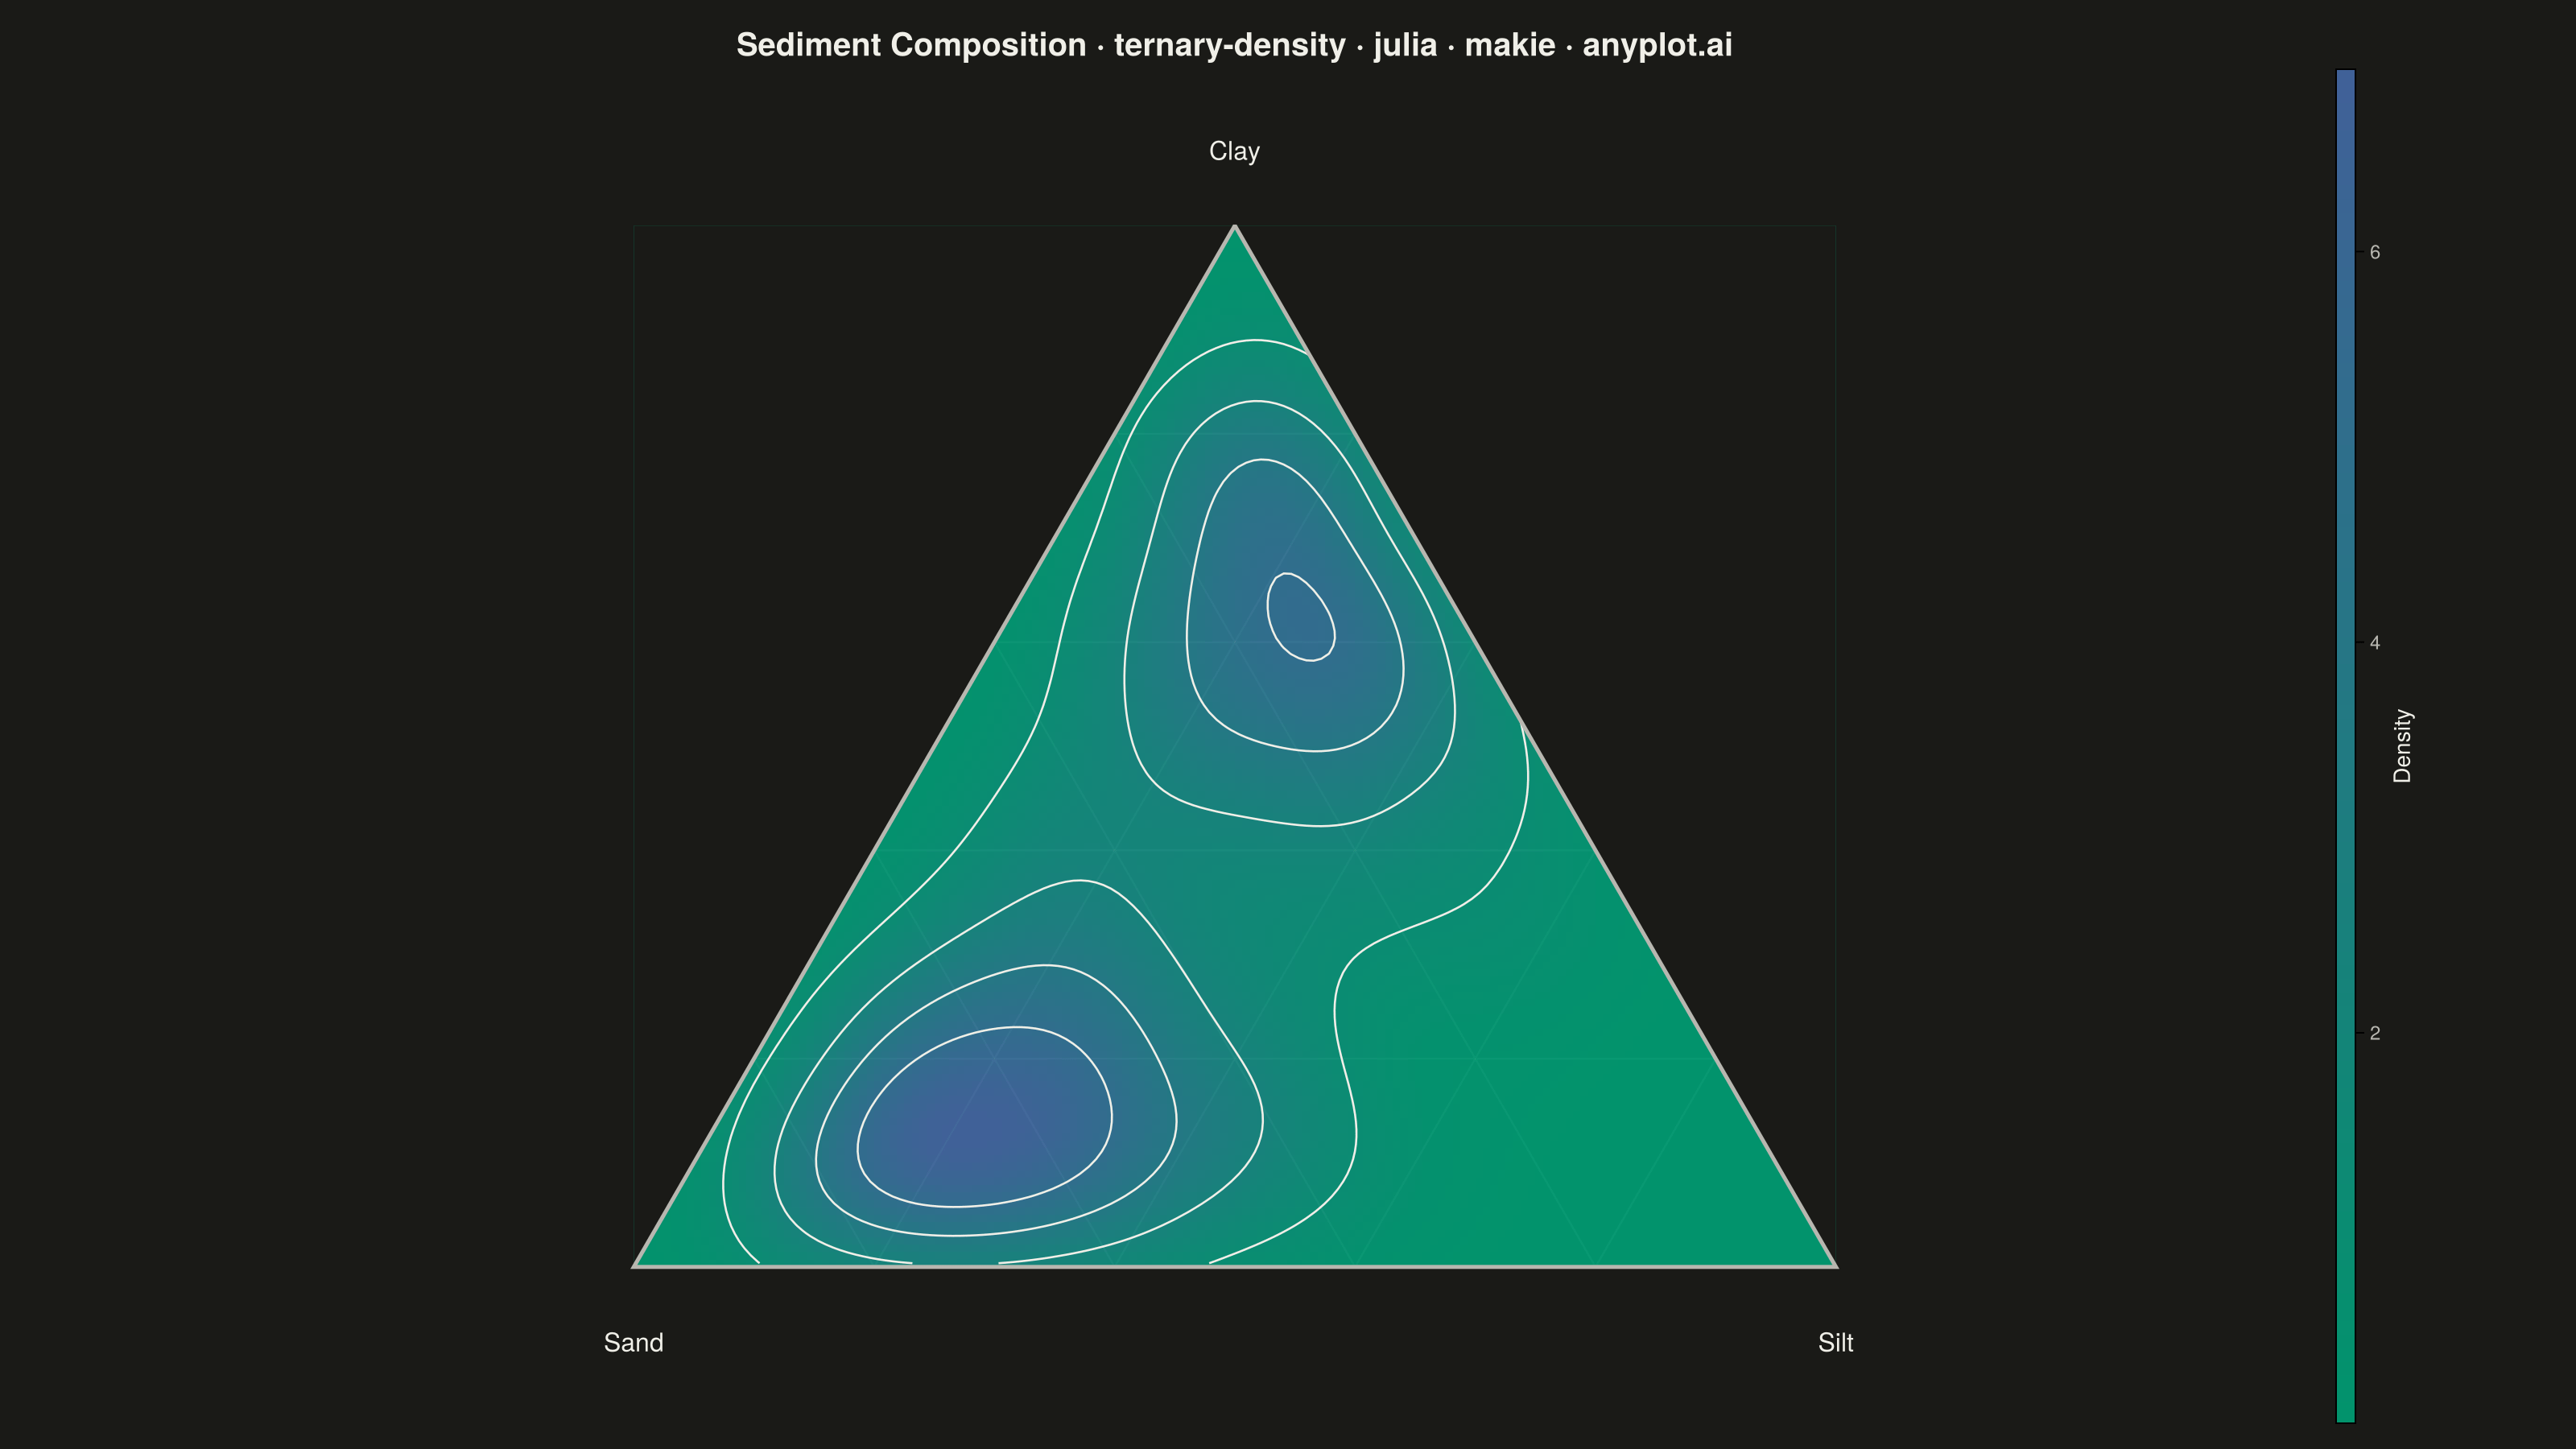
A ternary density plot combines a three-component ternary diagram with kernel density estimation to visualize where compositional data concentrates. Instead of showing individual points, this visualization uses a heatmap overlay to reveal the underlying probability distribution of compositions, making it ideal for identifying clusters, modes, and patterns in large compositional datasets.
# anyplot.ai
# ternary-density: Ternary Density Plot
# Library: makie 0.21.9 | Julia 1.11.9
# Quality: 91/100 | Created: 2026-09-02

using CairoMakie
using Colors
using Random
using Statistics

Random.seed!(42)

# --- Theme tokens -----------------------------------------------------------
const THEME    = get(ENV, "ANYPLOT_THEME", "light")
const PAGE_BG  = THEME == "light" ? colorant"#FAF8F1" : colorant"#1A1A17"
const INK      = THEME == "light" ? colorant"#1A1A17" : colorant"#F0EFE8"
const INK_SOFT = THEME == "light" ? colorant"#4A4A44" : colorant"#B8B7B0"
const GRID_RGBA = RGBAf(INK.r, INK.g, INK.b, 0.35)

# Imprint sequential colormap — single-polarity continuous data (density)
const IMPRINT_SEQ = cgrad([colorant"#009E73", colorant"#4467A3"])

# --- Data: simulated sediment composition (sand / silt / clay), two facies --
n_samples = 2400
n_sandy = round(Int, 0.55 * n_samples)

component_a = zeros(n_samples)  # sand
component_b = zeros(n_samples)  # silt
component_c = zeros(n_samples)  # clay

for i in 1:n_samples
    shape_a, shape_b, shape_c = i <= n_sandy ? (7, 3, 2) : (2, 3, 7)
    gamma_a = -sum(log.(rand(shape_a)))
    gamma_b = -sum(log.(rand(shape_b)))
    gamma_c = -sum(log.(rand(shape_c)))
    total = gamma_a + gamma_b + gamma_c
    component_a[i] = gamma_a / total
    component_b[i] = gamma_b / total
    component_c[i] = gamma_c / total
end

# Barycentric -> Cartesian (A at (0,0), B at (1,0), C at (0.5, sqrt(3)/2))
tri_height = sqrt(3) / 2
x_coords = component_b .+ component_c .* 0.5
y_coords = component_c .* tri_height

# --- Kernel density estimate on a fine grid, masked to the triangle --------
bandwidth = mean([std(x_coords), std(y_coords)]) * n_samples^(-1 / 6)

# Bin edges exactly at the triangle's bounding box, so the heatmap below has no
# half-cell overhang past [0, 1] x [0, tri_height] (Makie centers cells otherwise).
edge_xs = range(0, 1; length = 161)
edge_ys = range(0, tri_height; length = 141)
center_xs = (edge_xs[1:end-1] .+ edge_xs[2:end]) ./ 2
center_ys = (edge_ys[1:end-1] .+ edge_ys[2:end]) ./ 2

density_grid = Array{Float64}(undef, length(center_xs), length(center_ys))
for (i, gx) in enumerate(center_xs), (j, gy) in enumerate(center_ys)
    weights = exp.(-((gx .- x_coords) .^ 2 .+ (gy .- y_coords) .^ 2) ./ (2 * bandwidth^2))
    density_grid[i, j] = sum(weights) / (n_samples * 2 * pi * bandwidth^2)
end

contour_levels = maximum(density_grid) .* [0.15, 0.35, 0.55, 0.75]

# --- Figure -------------------------------------------------------------------
title_str = "Sediment Composition · ternary-density · julia · makie · anyplot.ai"

fig = Figure(
    size            = (1600, 900),
    fontsize        = 14,
    backgroundcolor = PAGE_BG,
)

ax = Axis(
    fig[1, 1];
    title           = title_str,
    titlesize       = 20,
    titlecolor      = INK,
    backgroundcolor = PAGE_BG,
    aspect          = DataAspect(),
)
hidedecorations!(ax)
hidespines!(ax)

# Ternary grid lines (beneath the density layer), every 20% of each component
for k in (0.2, 0.4, 0.6, 0.8)
    # constant component_a = k, parallel to edge B-C
    lines!(ax, [1 - k, (1 - k) * 0.5], [0, (1 - k) * tri_height]; color = GRID_RGBA, linewidth = 1.2)
    # constant component_b = k, parallel to edge A-C
    lines!(ax, [k, k + (1 - k) * 0.5], [0, (1 - k) * tri_height]; color = GRID_RGBA, linewidth = 1.2)
    # constant component_c = k, parallel to edge A-B
    lines!(ax, [k * 0.5, 1 - k * 0.5], [k * tri_height, k * tri_height]; color = GRID_RGBA, linewidth = 1.2)
end

# Density heatmap over the grid's bounding box (Imprint sequential)
hm = heatmap!(ax, edge_xs, edge_ys, density_grid; colormap = IMPRINT_SEQ, alpha = 0.92)

# Contour lines at key density levels for easier interpretation
contour!(ax, center_xs, center_ys, density_grid; levels = contour_levels, color = INK, linewidth = 1.3, alpha = 0.55)

# Mask the two bounding-box corners outside the triangle with crisp vector edges
# (avoids the staircase artifact a rectilinear heatmap grid would leave on the diagonals)
poly!(ax, Point2f[(0, 0), (0, tri_height), (0.5, tri_height)]; color = PAGE_BG, strokewidth = 0)
poly!(ax, Point2f[(1, 0), (1, tri_height), (0.5, tri_height)]; color = PAGE_BG, strokewidth = 0)

# Triangle outline
lines!(ax, [0, 1, 0.5, 0], [0, 0, tri_height, 0]; color = INK_SOFT, linewidth = 2.5)

# Vertex labels
text!(ax, 0, -0.05; text = "Sand", align = (:center, :top), color = INK, fontsize = 16)
text!(ax, 1, -0.05; text = "Silt", align = (:center, :top), color = INK, fontsize = 16)
text!(ax, 0.5, tri_height + 0.05; text = "Clay", align = (:center, :bottom), color = INK, fontsize = 16)

# Explicit limits — automatic axis limits don't account for text bounding boxes,
# which would otherwise clip the vertex labels against the scene edge.
xlims!(ax, -0.1, 1.1)
ylims!(ax, -0.13, tri_height + 0.13)

Colorbar(fig[1, 2], hm; label = "Density", labelcolor = INK, ticklabelcolor = INK_SOFT, labelsize = 14, ticklabelsize = 12)
colsize!(fig.layout, 1, Relative(0.88))

# --- Save -------------------------------------------------------------------
save("plot-$(THEME).png", fig; px_per_unit = 2)
Runnable source as JSON, for any HTTP client: https://api.anyplot.ai/specs/ternary-density/makie/code. Any spec id and library id listed in llms-full.txt fit the same URL shape; every URL below is complete and callable.
{
  "spec_id": "ternary-density",
  "language": "julia",
  "library": "makie",
  "page": "https://anyplot.ai/ternary-density/julia/makie",
  "hub": "https://anyplot.ai/ternary-density",
  "code_json": "https://api.anyplot.ai/specs/ternary-density/makie/code",
  "spec_json": "https://api.anyplot.ai/specs/ternary-density",
  "render_light_png": "https://storage.googleapis.com/anyplot-images/plots/ternary-density/julia/makie/plot-light.png",
  "render_dark_png": "https://storage.googleapis.com/anyplot-images/plots/ternary-density/julia/makie/plot-dark.png",
  "quality_score": 91.0,
  "license": "MIT",
  "guide": "https://anyplot.ai/llms.txt"
}
Part of Ternary Density Plot on anyplot.ai.