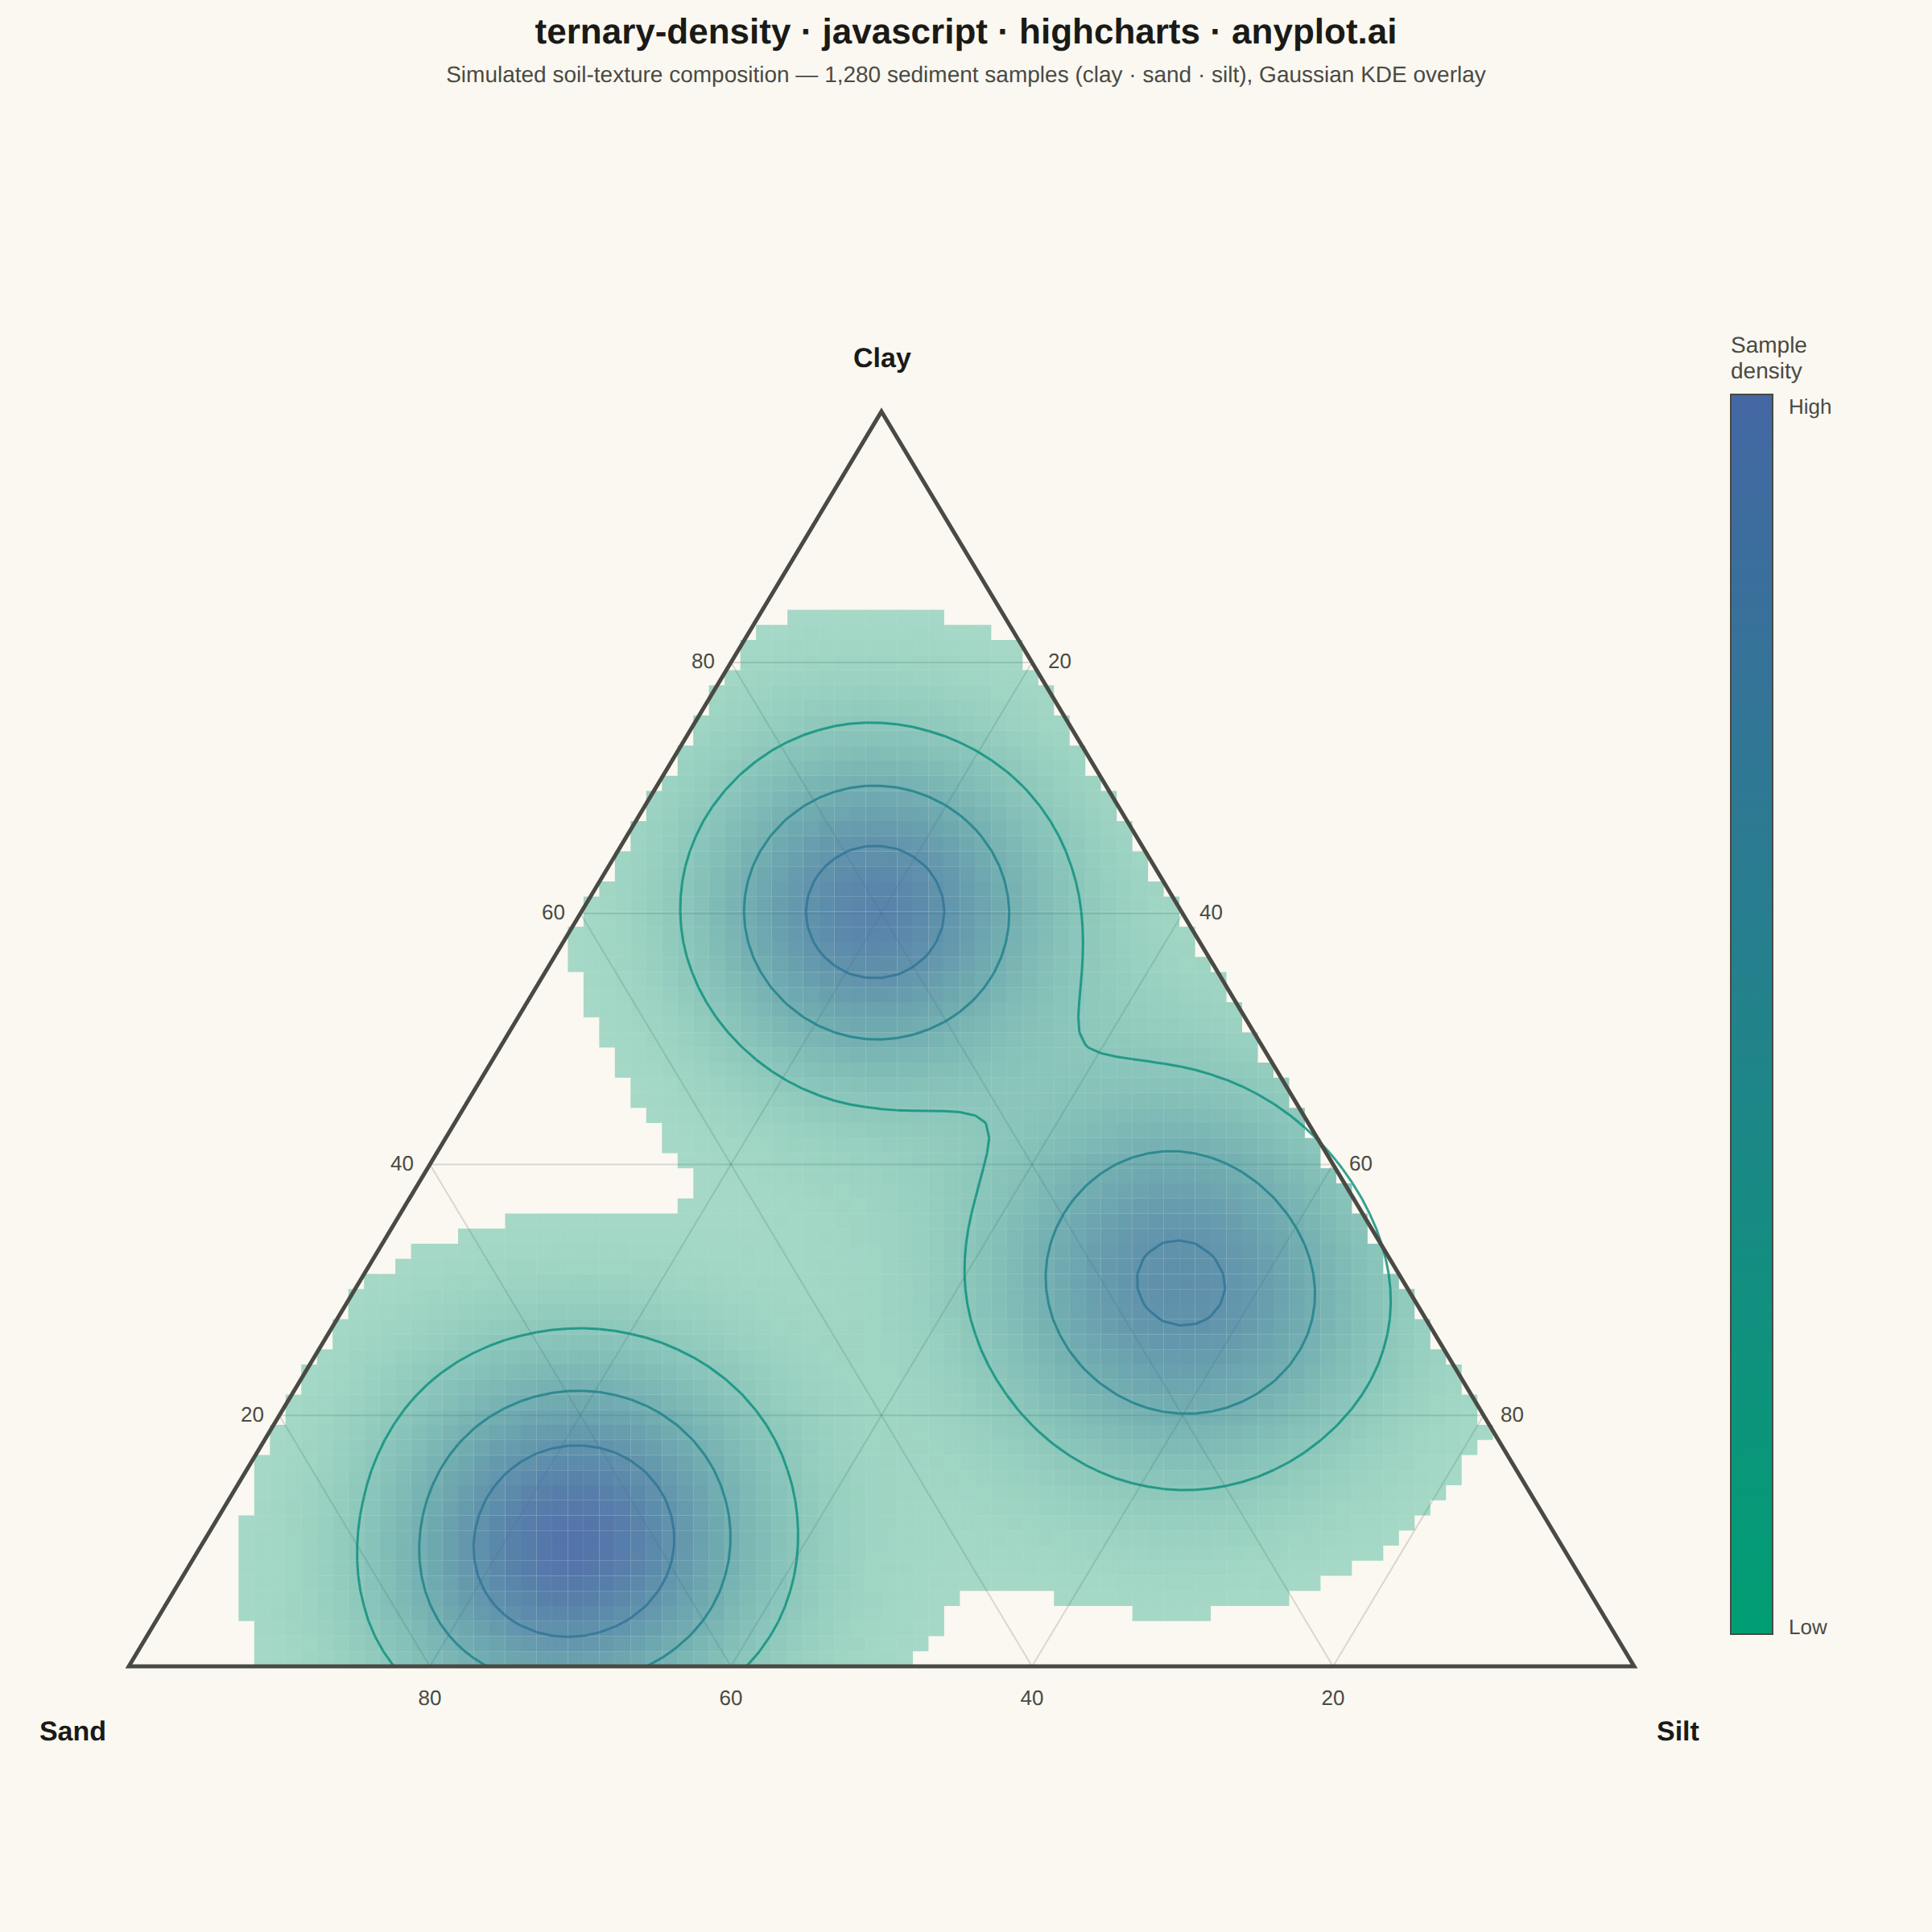
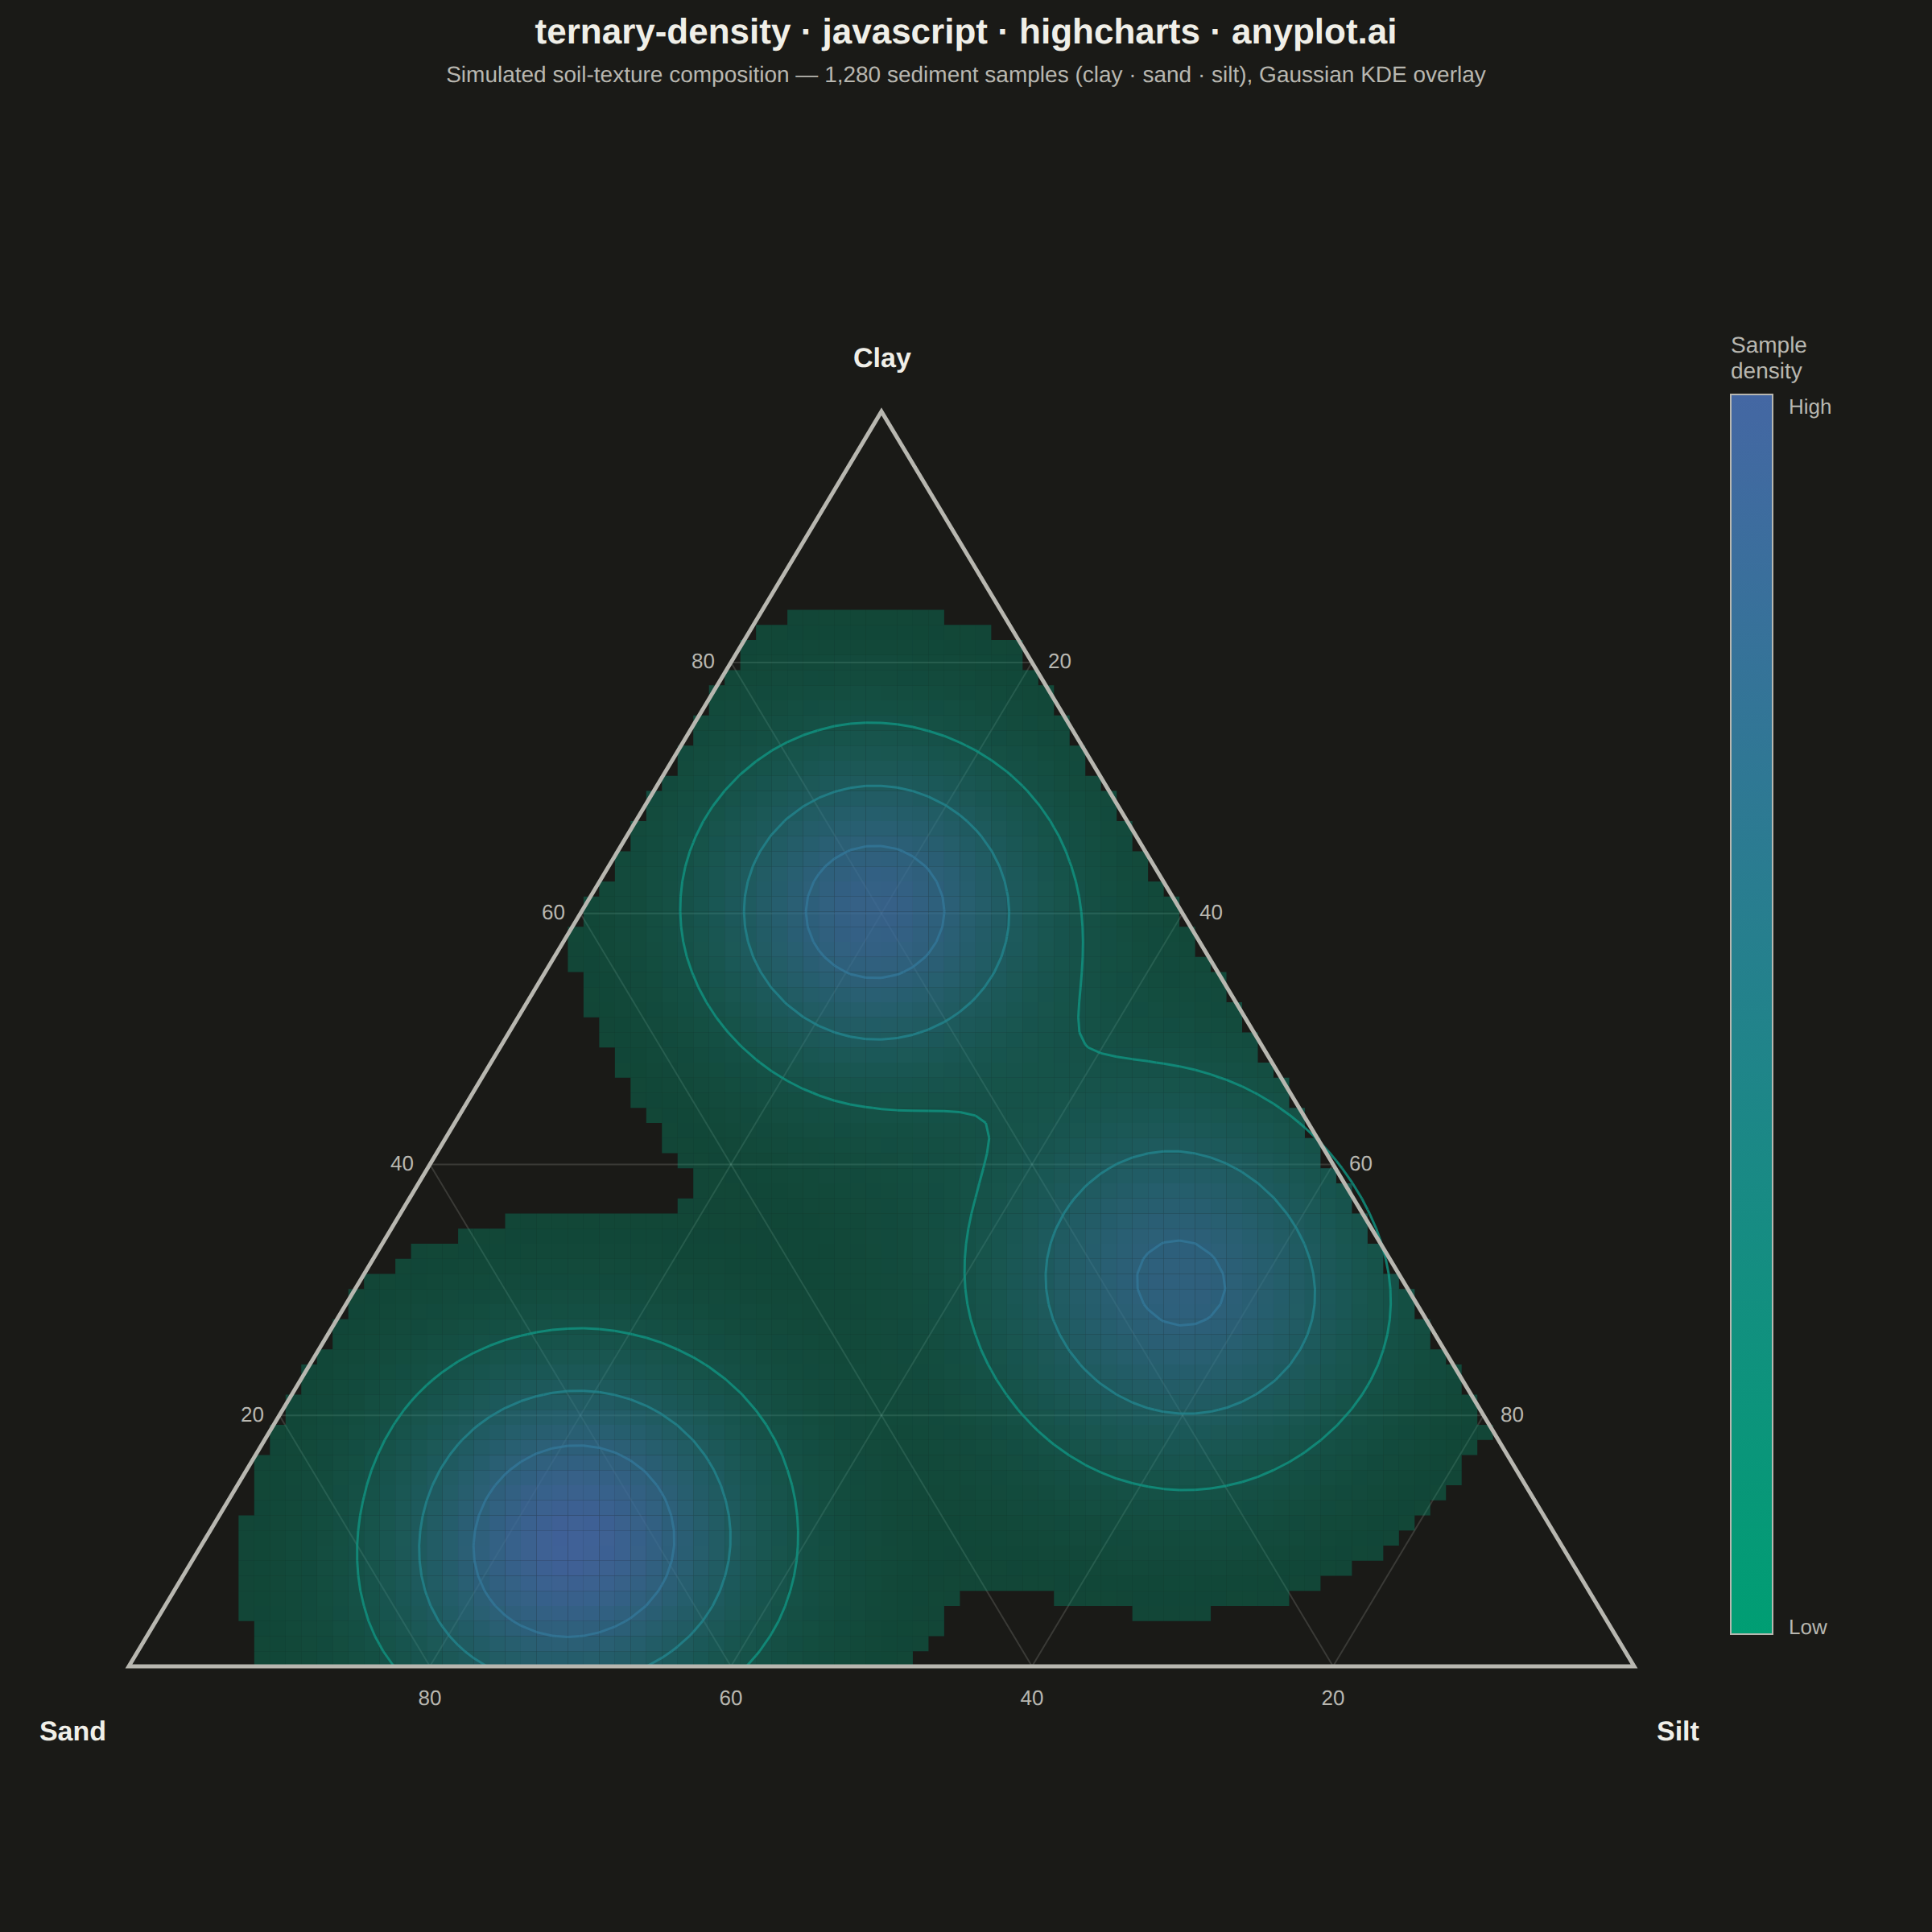
The same plot in 14 other libraries — JavaScript: Chart.js, D3.js, Apache ECharts, MUI X Charts; Python: Altair, Bokeh, lets-plot, Matplotlib, Plotly, plotnine, Pygal, Seaborn; R: ggplot2; Julia: Makie.jl. Compare all 15 side by side: Ternary Density Plot in Python, R, Julia and JavaScript.
A ternary density plot combines a three-component ternary diagram with kernel density estimation to visualize where compositional data concentrates. Instead of showing individual points, this visualization uses a heatmap overlay to reveal the underlying probability distribution of compositions, making it ideal for identifying clusters, modes, and patterns in large compositional datasets.
// anyplot.ai
// ternary-density: Ternary Density Plot
// Library: highcharts 12.6.0 | JavaScript 22.23.2
// Quality: 91/100 | Created: 2026-09-02
//# anyplot-orientation: square

const t = window.ANYPLOT_TOKENS;
const TITLE_TEXT = 'ternary-density · javascript · highcharts · anyplot.ai';
const SUBTITLE_TEXT = 'Simulated soil-texture composition — 1,280 sediment samples (clay · sand · silt), Gaussian KDE overlay';

// --- Deterministic PRNG (LCG) — the browser has no seeded RNG --------------
function makeLcg(seed) {
  let state = seed >>> 0;
  return () => {
    state = (state * 1664525 + 1013904223) >>> 0;
    return state / 4294967296;
  };
}
const rand = makeLcg(7);
function gaussian() {
  const u1 = Math.max(rand(), 1e-9);
  const u2 = rand();
  return Math.sqrt(-2 * Math.log(u1)) * Math.cos(2 * Math.PI * u2);
}

// --- Ternary geometry (unit triangle: x in [0,1], y in [0, H_UNIT]) --------
// Vertices: clay (top, fa=1), sand (bottom-left, fb=1), silt (bottom-right, fc=1)
const H_UNIT = Math.sqrt(3) / 2;
function baryToXY(fa, fb, fc) {
  return [fc + fa * 0.5, fa * H_UNIT];
}
function xyToBary(x, y) {
  const fa = y / H_UNIT;
  const fc = x - fa * 0.5;
  const fb = 1 - fa - fc;
  return [fa, fb, fc];
}
const INSIDE_EPS = 0.006;
function insideAt(x, y) {
  const [fa, fb, fc] = xyToBary(x, y);
  return fa >= -INSIDE_EPS && fb >= -INSIDE_EPS && fc >= -INSIDE_EPS;
}

// --- Data: three soil-texture clusters, sampled around their centroid ------
// (fa=clay fraction, fb=sand fraction, fc=silt fraction)
const CLUSTERS = [
  { fa: 0.1, fb: 0.65, fc: 0.25, n: 480, spread: 0.065 }, // sandy loam
  { fa: 0.3, fb: 0.15, fc: 0.55, n: 420, spread: 0.07 }, // silty clay loam
  { fa: 0.6, fb: 0.2, fc: 0.2, n: 380, spread: 0.06 }, // clay
];
const CLAMP_MIN = 0.01;

const points = [];
CLUSTERS.forEach(({ fa, fb, fc, n, spread }) => {
  const [ccx, ccy] = baryToXY(fa, fb, fc);
  for (let i = 0; i < n; i++) {
    let x = ccx + gaussian() * spread;
    let y = ccy + gaussian() * spread;
    let [pa, pb, pc] = xyToBary(x, y);
    if (pa < CLAMP_MIN || pb < CLAMP_MIN || pc < CLAMP_MIN) {
      pa = Math.max(pa, CLAMP_MIN);
      pb = Math.max(pb, CLAMP_MIN);
      pc = Math.max(pc, CLAMP_MIN);
      const s = pa + pb + pc;
      [x, y] = baryToXY(pa / s, pb / s, pc / s);
    }
    points.push([x, y]);
  }
});

// --- Kernel density estimate over a regular grid covering the triangle -----
const NX = 96;
const dx = 1 / NX;
const NY = Math.ceil(H_UNIT / dx);
const gx = Array.from({ length: NX + 1 }, (_, i) => i * dx);
const gy = Array.from({ length: NY + 1 }, (_, j) => j * dx);

const BANDWIDTH = 0.06;
const TWO_BW2 = 2 * BANDWIDTH * BANDWIDTH;
function kdeAt(x, y) {
  let sum = 0;
  for (let k = 0; k < points.length; k++) {
    const ddx = x - points[k][0];
    const ddy = y - points[k][1];
    sum += Math.exp(-(ddx * ddx + ddy * ddy) / TWO_BW2);
  }
  return sum;
}

const density = [];
let maxDensity = 0;
for (let i = 0; i <= NX; i++) {
  density[i] = [];
  for (let j = 0; j <= NY; j++) {
    const val = kdeAt(gx[i], gy[j]);
    density[i][j] = val;
    if (val > maxDensity) maxDensity = val;
  }
}
const normDensity = density.map((col) => col.map((v) => v / maxDensity));

// --- Filled density cells (only where all 4 corners lie inside the triangle) -
// Color/opacity interpolate continuously with the cell's average density
// (rather than quantizing into discrete bands) so adjacent cells blend into
// a smooth gradient instead of showing stair-stepped edges.
const CUTOFF = 0.035;
const cells = [];
for (let i = 0; i < NX; i++) {
  for (let j = 0; j < NY; j++) {
    const x0 = gx[i],
      x1 = gx[i + 1],
      y0 = gy[j],
      y1 = gy[j + 1];
    if (!insideAt(x0, y0) || !insideAt(x1, y0) || !insideAt(x0, y1) || !insideAt(x1, y1)) continue;
    const avg = (normDensity[i][j] + normDensity[i + 1][j] + normDensity[i][j + 1] + normDensity[i + 1][j + 1]) / 4;
    if (avg < CUTOFF) continue;
    cells.push({ x0, y0, x1, y1, avg });
  }
}

// --- Contour lines via marching squares (same technique as contour-basic) --
const CONTOUR_LEVELS = [0.25, 0.5, 0.75];
function contourSegments(level) {
  const segs = [];
  for (let i = 0; i < NX; i++) {
    for (let j = 0; j < NY; j++) {
      const a = normDensity[i][j],
        b = normDensity[i + 1][j],
        c = normDensity[i + 1][j + 1],
        d = normDensity[i][j + 1];
      const code = (a >= level ? 1 : 0) | (b >= level ? 2 : 0) | (c >= level ? 4 : 0) | (d >= level ? 8 : 0);
      if (code === 0 || code === 15) continue;

      function ep(x1, y1, v1, x2, y2, v2) {
        const s = (level - v1) / (v2 - v1);
        return [x1 + s * (x2 - x1), y1 + s * (y2 - y1)];
      }

      const eAB = ep(gx[i], gy[j], a, gx[i + 1], gy[j], b);
      const eBC = ep(gx[i + 1], gy[j], b, gx[i + 1], gy[j + 1], c);
      const eCD = ep(gx[i + 1], gy[j + 1], c, gx[i], gy[j + 1], d);
      const eDA = ep(gx[i], gy[j + 1], d, gx[i], gy[j], a);

      const lookup = {
        1: [[eDA, eAB]],
        14: [[eDA, eAB]],
        2: [[eAB, eBC]],
        13: [[eAB, eBC]],
        3: [[eDA, eBC]],
        12: [[eDA, eBC]],
        4: [[eBC, eCD]],
        11: [[eBC, eCD]],
        6: [[eAB, eCD]],
        9: [[eAB, eCD]],
        7: [[eDA, eCD]],
        8: [[eDA, eCD]],
        5: [
          [eDA, eAB],
          [eBC, eCD],
        ],
        10: [
          [eDA, eCD],
          [eAB, eBC],
        ],
      }[code];

      if (lookup) {
        lookup.forEach((seg) => {
          const midx = (seg[0][0] + seg[1][0]) / 2;
          const midy = (seg[0][1] + seg[1][1]) / 2;
          if (insideAt(midx, midy)) segs.push(seg);
        });
      }
    }
  }
  return segs;
}
const contourSegs = CONTOUR_LEVELS.map((level) => contourSegments(level));

// --- Colors: Imprint imprint_seq — density is single-polarity -------------
function lerpColor(c1, c2, tt) {
  const parse = (h) => [1, 3, 5].map((i) => parseInt(h.slice(i, i + 2), 16));
  const [r1, g1, b1] = parse(c1);
  const [r2, g2, b2] = parse(c2);
  return (
    '#' +
    [r1 + tt * (r2 - r1), g1 + tt * (g2 - g1), b1 + tt * (b2 - b1)]
      .map((v) => Math.round(v).toString(16).padStart(2, '0'))
      .join('')
  );
}
function cellColor(v) {
  return lerpColor(t.seq[0], t.seq[1], v);
}
function cellAlpha(v) {
  return 0.32 + 0.6 * v;
}

// --- Sparse hover layer (native Highcharts tooltip) — subsample the fine ---
// grid rather than one marker per cell, to keep the interactive layer light.
const HOVER_STRIDE = 4;
const hoverPoints = [];
for (let i = 0; i <= NX; i += HOVER_STRIDE) {
  for (let j = 0; j <= NY; j += HOVER_STRIDE) {
    if (!insideAt(gx[i], gy[j])) continue;
    const norm = normDensity[i][j];
    if (norm < CUTOFF) continue;
    const [fa, fb, fc] = xyToBary(gx[i], gy[j]);
    hoverPoints.push({ x: gx[i], y: gy[j], clay: fa * 100, sand: fb * 100, silt: fc * 100, density: norm * 100 });
  }
}

// --- Fixed chart geometry (square canvas, harness-guaranteed 1200x1200 CSS) -
const W = window.ANYPLOT_SIZE.width;
const H_PX = window.ANYPLOT_SIZE.height;
const MARGIN_LEFT = 80;
const MARGIN_RIGHT = 185;
const MARGIN_TOP_MIN = 155;
const MARGIN_BOTTOM_MIN = 95;
const PLOT_W = W - MARGIN_LEFT - MARGIN_RIGHT;
const PLOT_H = PLOT_W * H_UNIT;
const V_SLACK = H_PX - MARGIN_TOP_MIN - PLOT_H - MARGIN_BOTTOM_MIN;
const MARGIN_TOP = MARGIN_TOP_MIN + V_SLACK / 2;
const MARGIN_BOTTOM = MARGIN_BOTTOM_MIN + V_SLACK / 2;
const CHART_MARGIN = [MARGIN_TOP, MARGIN_RIGHT, MARGIN_BOTTOM, MARGIN_LEFT];
const HOVER_RADIUS = (dx * PLOT_W * HOVER_STRIDE) / 2 * 0.85;

const drawn = [];
function clearDrawn() {
  drawn.forEach((el) => {
    try {
      el.destroy();
    } catch (_err) {
      // already removed
    }
  });
  drawn.length = 0;
}

function drawTernary() {
  const chart = this;
  clearDrawn();
  const r = chart.renderer;
  const xAxis = chart.xAxis[0];
  const yAxis = chart.yAxis[0];
  const toPx = (xu, yu) => [xAxis.toPixels(xu, false), yAxis.toPixels(yu, false)];
  const baryPx = (fa, fb, fc) => toPx(fc + fa * 0.5, fa * H_UNIT);

  // Ternary gridlines (drawn first — the density layer's transparency lets
  // them show through in low-density cells and at the empty triangle edges).
  const gridGroup = r.g('ternary-gridlines').add();
  [0.2, 0.4, 0.6, 0.8].forEach((k) => {
    [
      [baryPx(k, 1 - k, 0), baryPx(k, 0, 1 - k)],
      [baryPx(1 - k, k, 0), baryPx(0, k, 1 - k)],
      [baryPx(1 - k, 0, k), baryPx(0, 1 - k, k)],
    ].forEach(([p1, p2]) => {
      r.path(['M', p1[0], p1[1], 'L', p2[0], p2[1]])
        .attr({ stroke: t.grid, 'stroke-width': 1 })
        .add(gridGroup);
    });
  });
  drawn.push(gridGroup);

  // Filled density cells (KDE heatmap overlay, continuous color per cell).
  const cellGroup = r.g('density-cells').add();
  cells.forEach(({ x0, y0, x1, y1, avg }) => {
    const [px0] = toPx(x0, 0);
    const [px1] = toPx(x1, 0);
    const [, py0] = toPx(0, y0);
    const [, py1] = toPx(0, y1);
    r.rect(Math.min(px0, px1), Math.min(py0, py1), Math.abs(px1 - px0), Math.abs(py1 - py0))
      .attr({ fill: cellColor(avg), opacity: cellAlpha(avg) })
      .add(cellGroup);
  });
  drawn.push(cellGroup);

  // Contour lines at key density levels.
  const contourGroup = r.g('contour-lines').add();
  CONTOUR_LEVELS.forEach((level, li) => {
    const color = lerpColor(t.seq[0], t.seq[1], level);
    contourSegs[li].forEach(([p1, p2]) => {
      const [x1p, y1p] = toPx(p1[0], p1[1]);
      const [x2p, y2p] = toPx(p2[0], p2[1]);
      r.path(['M', x1p, y1p, 'L', x2p, y2p])
        .attr({ stroke: color, 'stroke-width': 1.5, opacity: 0.85 })
        .add(contourGroup);
    });
  });
  drawn.push(contourGroup);

  // Triangle outline, on top so it stays crisp against the density fill.
  const apex = baryPx(1, 0, 0);
  const baseLeft = baryPx(0, 1, 0);
  const baseRight = baryPx(0, 0, 1);
  drawn.push(
    r
      .path(['M', apex[0], apex[1], 'L', baseLeft[0], baseLeft[1], 'L', baseRight[0], baseRight[1], 'Z'])
      .attr({ stroke: t.inkSoft, 'stroke-width': 2.5, fill: 'none' })
      .add()
  );

  // Edge tick labels — each edge scales the component opposite its far vertex.
  [0.2, 0.4, 0.6, 0.8].forEach((k) => {
    const label = `${Math.round(k * 100)}`;
    const leftTick = baryPx(k, 1 - k, 0);
    drawn.push(
      r
        .text(label, leftTick[0] - 10, leftTick[1] + 4)
        .attr({ align: 'right' })
        .css({ color: t.inkSoft, fontSize: '13px' })
        .add()
    );
    const rightTick = baryPx(1 - k, 0, k);
    drawn.push(
      r
        .text(label, rightTick[0] + 10, rightTick[1] + 4)
        .attr({ align: 'left' })
        .css({ color: t.inkSoft, fontSize: '13px' })
        .add()
    );
    const bottomTick = baryPx(0, k, 1 - k);
    drawn.push(
      r
        .text(label, bottomTick[0], bottomTick[1] + 24)
        .attr({ align: 'center' })
        .css({ color: t.inkSoft, fontSize: '13px' })
        .add()
    );
  });

  // Vertex labels.
  drawn.push(
    r
      .text('Clay', apex[0], apex[1] - 28)
      .attr({ align: 'center' })
      .css({ color: t.ink, fontSize: '17px', fontWeight: '600' })
      .add()
  );
  drawn.push(
    r
      .text('Sand', baseLeft[0] - 14, baseLeft[1] + 46)
      .attr({ align: 'right' })
      .css({ color: t.ink, fontSize: '17px', fontWeight: '600' })
      .add()
  );
  drawn.push(
    r
      .text('Silt', baseRight[0] + 14, baseRight[1] + 46)
      .attr({ align: 'left' })
      .css({ color: t.ink, fontSize: '17px', fontWeight: '600' })
      .add()
  );

  // Vertical colorbar (core Highcharts has no colorAxis module loaded).
  const barLeft = chart.plotLeft + chart.plotWidth + 60;
  const barTop = chart.plotTop + 20;
  const barWidth = 26;
  const barHeight = chart.plotHeight - 40;
  drawn.push(
    r
      .rect(barLeft, barTop, barWidth, barHeight)
      .attr({
        fill: {
          linearGradient: { x1: 0, y1: 1, x2: 0, y2: 0 },
          stops: [
            [0, t.seq[0]],
            [1, t.seq[1]],
          ],
        },
        stroke: t.inkSoft,
        'stroke-width': 1,
      })
      .add()
  );
  drawn.push(
    r
      .text('Sample', barLeft, barTop - 26)
      .attr({ align: 'left' })
      .css({ color: t.inkSoft, fontSize: '14px', fontWeight: '500' })
      .add()
  );
  drawn.push(
    r
      .text('density', barLeft, barTop - 10)
      .attr({ align: 'left' })
      .css({ color: t.inkSoft, fontSize: '14px', fontWeight: '500' })
      .add()
  );
  drawn.push(
    r
      .text('High', barLeft + barWidth + 10, barTop + 12)
      .attr({ align: 'left' })
      .css({ color: t.inkSoft, fontSize: '13px' })
      .add()
  );
  drawn.push(
    r
      .text('Low', barLeft + barWidth + 10, barTop + barHeight)
      .attr({ align: 'left' })
      .css({ color: t.inkSoft, fontSize: '13px' })
      .add()
  );
}

// --- Chart -------------------------------------------------------------
Highcharts.chart('container', {
  chart: {
    type: 'scatter',
    backgroundColor: 'transparent',
    animation: false,
    style: { fontFamily: 'inherit' },
    margin: CHART_MARGIN,
    events: { load: drawTernary, redraw: drawTernary },
  },
  credits: { enabled: false },
  title: { text: TITLE_TEXT, style: { color: t.ink, fontSize: '22px', fontWeight: '600' } },
  subtitle: { text: SUBTITLE_TEXT, style: { color: t.inkSoft, fontSize: '14px' } },
  xAxis: { visible: false, min: 0, max: 1, lineWidth: 0, tickWidth: 0, gridLineWidth: 0 },
  yAxis: { visible: false, min: 0, max: H_UNIT, lineWidth: 0, tickWidth: 0, gridLineWidth: 0 },
  legend: { enabled: false },
  tooltip: {
    enabled: true,
    backgroundColor: t.elevatedBg,
    borderColor: t.inkSoft,
    borderRadius: 6,
    style: { color: t.ink, fontSize: '13px' },
    formatter: function () {
      const p = this.point;
      return `<b>Clay ${p.clay.toFixed(0)}% · Sand ${p.sand.toFixed(0)}% · Silt ${p.silt.toFixed(0)}%</b><br/>Relative density: ${p.density.toFixed(0)}%`;
    },
  },
  plotOptions: {
    series: { animation: false },
    scatter: {
      enableMouseTracking: true,
      stickyTracking: false,
      marker: {
        enabled: true,
        symbol: 'circle',
        radius: HOVER_RADIUS,
        fillColor: 'rgba(0,0,0,0.001)',
        lineWidth: 0,
        states: { hover: { enabled: false } },
      },
    },
  },
  series: [{ type: 'scatter', name: 'Composition', data: hoverPoints }],
});
Runnable source as JSON, for any HTTP client: https://api.anyplot.ai/specs/ternary-density/highcharts/code. Any spec id and library id listed in llms-full.txt fit the same URL shape; every URL below is complete and callable.
{
  "spec_id": "ternary-density",
  "language": "javascript",
  "library": "highcharts",
  "page": "https://anyplot.ai/ternary-density/javascript/highcharts",
  "hub": "https://anyplot.ai/ternary-density",
  "code_json": "https://api.anyplot.ai/specs/ternary-density/highcharts/code",
  "spec_json": "https://api.anyplot.ai/specs/ternary-density",
  "render_light_png": "https://storage.googleapis.com/anyplot-images/plots/ternary-density/javascript/highcharts/plot-light.png",
  "render_dark_png": "https://storage.googleapis.com/anyplot-images/plots/ternary-density/javascript/highcharts/plot-dark.png",
  "interactive_light_html": "https://storage.googleapis.com/anyplot-images/plots/ternary-density/javascript/highcharts/plot-light.html",
  "interactive_dark_html": "https://storage.googleapis.com/anyplot-images/plots/ternary-density/javascript/highcharts/plot-dark.html",
  "quality_score": 91.0,
  "license": "MIT",
  "guide": "https://anyplot.ai/llms.txt"
}
Part of Ternary Density Plot on anyplot.ai.